Some common analytical tasks from the diary of the glamorous life of a business analyst-
1) removing duplicates from a dataset based on certain key values/variables
2) merging two datasets based on a common key/variable/s
3) creating a subset based on a conditional value of a variable
4) creating a subset based on a conditional value of a time-date variable
5) changing format from one date time variable to another
6) doing a means grouped or classified at a level of aggregation
7) creating a new variable based on if then condition
8) creating a macro to run same program with different parameters
9) creating a logistic regression model, scoring dataset,
10) transforming variables
11) checking roc curves of model
12) splitting a dataset for a random sample (repeatable with random seed)
13) creating a cross tab of all variables in a dataset with one response variable
14) creating bins or ranks from a certain variable value
15) graphically examine cross tabs
16) histograms
17) plot(density())
18)creating a pie chart
19) creating a line graph, creating a bar graph
20) creating a bubbles chart
21) running a goal seek kind of simulation/optimization
22) creating a tabular report for multiple metrics grouped for one time/variable
23) creating a basic time series forecast
and some case studies I could think of-
As the Director, Analytics you have to examine current marketing efficiency as well as help optimize sales force efficiency across various channels. In addition you have to examine multiple sales channels including inbound telephone, outgoing direct mail, internet email campaigns. The datawarehouse is an RDBMS but it has multiple data quality issues to be checked for. In addition you need to submit your budget estimates for next year’s annual marketing budget to maximize sales return on investment.
As the Director, Risk you have to examine the overdue mortgages book that your predecessor left you. You need to optimize collections and minimize fraud and write-offs, and your efforts would be measured in maximizing profits from your department.
As a social media consultant you have been asked to maximize social media analytics and social media exposure to your client. You need to create a mechanism to report particular brand keywords, as well as automated triggers between unusual web activity, and statistical analysis of the website analytics metrics. Above all it needs to be set up in an automated reporting dashboard .
As a consultant to a telecommunication company you are asked to monitor churn and review the existing churn models. Also you need to maximize advertising spend on various channels. The problem is there are a large number of promotions always going on, some of the data is either incorrectly coded or there are interaction effects between the various promotions.
As a modeller you need to do the following-
1) Check ROC and H-L curves for existing model
2) Divide dataset in random splits of 40:60
3) Create multiple aggregated variables from the basic variables
4) run regression again and again
5) evaluate statistical robustness and fit of model
6) display results graphically
All these steps can be broken down in little little pieces of code- something which i am putting down a list of.
Are there any common data analysis tasks that you think I am missing out- any common case studies ? let me know.
Here is an interview with Prof Luis Torgo, author of the recent best seller “Data Mining with R-learning with case studies”.
Ajay- Describe your career in science. How do you think can more young people be made interested in science.
Luis- My interest in science only started after I’ve finished my degree. I’ve entered a research lab at the University of Porto and started working on Machine Learning, around 1990. Since then I’ve been involved generally in data analysis topics both from a research perspective as well as from a more applied point of view through interactions with industry partners on several projects. I’ve spent most of my career at the Faculty of Economics of the University of Porto, but since 2008 I’m at the department of Computer Science of the Faculty of Sciences of the same university. At the same time I’ve been a researcher at LIAAD / Inesc Porto LA (www.liaad.up.pt).
I like a lot what I do and like science and the “scientific way of thinking”, but I cannot say that I’ve always thought of this area as my “place”. Most of all I like solving challenging problems through data analysis. If that translates into some scientific outcome than I’m more satisfied but that is not my main goal, though I’m kind of “forced” to think about that because of the constraints of an academic career.
That does not mean I’m not passionate about science, I just think there are many more ways of “doing science” than what is reflected in the usual “scientific indicators” that most institutions seem to be more and more obsessed about.
Regards interesting young people in science that is a hard question that I’m not sure I’m qualified to answer. I do tend to think that young people are more sensible to concrete examples of problems they think are interesting and that science helps in solving, as a way of finding a motivation for facing the hard work they will encounter in a scientific career. I do believe in case studies as a nice way to learn and motivate, and thus my book 😉
Ajay- Describe your new book “Data Mining with R, learning with case studies” Why did you choose a case study based approach? who is the target audience? What is your favorite case study from the book
Luis- This book is about learning how to use R for data mining. The book follows a “learn by doing it” approach to data mining instead of the more common theoretical description of the available techniques in this discipline. This is accomplished by presenting a series of illustrative case studies for which all necessary steps, code and data are provided to the reader. Moreover, the book has an associated web page (www.liaad.up.pt/~ltorgo/DataMiningWithR) where all code inside the book is given so that easy copy-paste is possible for the more lazy readers.
The language used in the book is very informal without many theoretical details on the used data mining techniques. For obtaining these theoretical insights there are already many good data mining books some of which are referred in “further readings” sections given throughout the book. The decision of following this writing style had to do with the intended target audience of the book.
In effect, the objective was to write a monograph that could be used as a supplemental book for practical classes on data mining that exist in several courses, but at the same time that could be attractive to professionals working on data mining in non-academic environments, and thus the choice of this more practically oriented approach.
Regards my favorite case study that is a hard question for an author… still I would probably choose the “Predicting Stock Market Returns” case study (Chapter 3). Not only because I like this challenging problem, but mainly because the case study addresses all aspects of knowledge discovery in a real world scenario and not only the construction of predictive models. It tackles data collection, data pre-processing, model construction, transforming predictions into actions using different trading policies, using business-related performance metrics, implementing a trading simulator for “real-world” evaluation, and laying out grounds for constructing an online trading system.
Obviously, for all these steps there are far too many options to be possible to describe/evaluate all of them in a chapter, still I do believe that for the reader it is important to see the overall picture, and read about the relevant questions on this problem and some possible paths that can be followed at these different steps.
In other words: do not expect to become rich with the solution I describe in the chapter !
Ajay- Apart from R, what other data mining software do you use or have used in the past. How would you compare their advantages and disadvantages with R
Luis- I’ve played around with Clementine, Weka, RapidMiner and Knime, but really only playing with teaching goals, and no serious use/evaluation in the context of data mining projects. For the latter I mainly use R or software developed by myself (either in R or other languages). In this context, I do not think it is fair to compare R with these or other tools as I lack serious experience with them. I can however, tell you about what I see as the main pros and cons of R. The main reason for using R is really not only the power of the tool that does not stop surprising me in terms of what already exists and keeps appearing as contributions of an ever growing community, but mainly the ability of rapidly transforming ideas into prototypes. Regards some of its drawbacks I would probably mention the lack of efficiency when compared to other alternatives and the problem of data set sizes being limited by main memory.
I know that there are several efforts around for solving this latter issue not only from the community (e.g. http://cran.at.r-project.org/web/views/HighPerformanceComputing.html), but also from the industry (e.g. Revolution Analytics), but I would prefer that at this stage this would be a standard feature of the language so the the “normal” user need not worry about it. But then this is a community effort and if I’m not happy with the current status instead of complaining I should do something about it!
Ajay- Describe your writing habit- How do you set about writing the book- did you write a fixed amount daily or do you write in bursts etc
Luis- Unfortunately, I write in bursts whenever I find some time for it. This is much more tiring and time consuming as I need to read back material far too often, but I cannot afford dedicating too much consecutive time to a single task. Actually, I frequently tease my PhD students when they “complain” about the lack of time for doing what they have to, that they should learn to appreciate the luxury of having a single task to complete because it will probably be the last time in their professional life!
Ajay- What do you do to relax or unwind when not working?
Luis- For me, the best way to relax from work is by playing sports. When I’m involved in some game I reset my mind and forget about all other things and this is very relaxing for me. A part from sports I enjoy a lot spending time with my family and friends. A good and long dinner with friends over a good bottle of wine can do miracles when I’m too stressed with work! Finally,I do love traveling around with my family.
Short Bio: Luis Torgo has a degree in Systems and Informatics Engineering and a PhD in Computer Science. He is an Associate Professor of the Department of Computer Science of the Faculty of Sciences of the University of Porto. He is also a researcher of the Laboratory of Artificial Intelligence and Data Analysis (LIAAD) belonging to INESC Porto LA. Luis Torgo has been an active researcher in Machine Learning and Data Mining for more than 20 years. He has lead several academic and industrial Data Mining research projects. Luis Torgo accompanies the R project almost since its beginning, using it on his research activities. He teaches R at different levels and has given several courses in different countries.
For reading “Data Mining with R” – you can visit this site, also to avail of a 20% discount the publishers have generously given (message below)-
For more information and to place an order, visit us at http://www.crcpress.com. Order online and apply 20% Off discount code 907HM at checkout. CRC is pleased to offer free standard shipping on all online orders!
Price: $79.95 Cat. #: K10510 ISBN: 9781439810187 ISBN 10: 1439810184 Publication Date: November 09, 2010 Number of Pages: 305 Availability: In Stock Binding(s): Hardback
A message from Predictive Analytics World on newly available videos. It has many free videos as well so you can check them out.
Access PAW DC Session Videos Now
Predictive Analytics World is pleased to announce on-demand access to the videos of PAW Washington DC, October 2010, including over 30 sessions and keynotes that you may view at your convenience. Access this leading predictive analytics content online now:
Select individual conference sessions, or recognize savings by registering for access to one or two full days of sessions. These on-demand videos deliver PAW DC right to your desk, covering hot topics and advanced methods such as:
PAW DC videos feature over 25 speakers with case studies from leading enterprises such as: CIBC, CEB, Forrester, Macy’s, MetLife, Microsoft, Miles Kimball, Monster.com, Oracle, Paychex, SunTrust, Target, UPMC, Xerox, Yahoo!, YMCA, and more.
Keynote: Five Ways Predictive Analytics Cuts Enterprise Risk
Eric Siegel,Ph.D., Program Chair, Predictive Analytics World
All business is an exercise in risk management. All organizations would benefit from measuring, tracking and computing risk as a core process, much like insurance companies do.
Predictive analytics does the trick, one customer at a time. This technology is a data-driven means to compute the risk each customer will defect, not respond to an expensive mailer, consume a retention discount even if she were not going to leave in the first place, not be targeted for a telephone solicitation that would have landed a sale, commit fraud, or become a “loss customer” such as a bad debtor or an insurance policy-holder with high claims.
In this keynote session, Dr. Eric Siegel reveals:
– Five ways predictive analytics evolves your enterprise to reduce risk
– Hidden sources of risk across operational functions
– What every business should learn from insurance companies
– How advancements have reversed the very meaning of fraud
– Why “man + machine” teams are greater than the sum of their parts for enterprise decision support
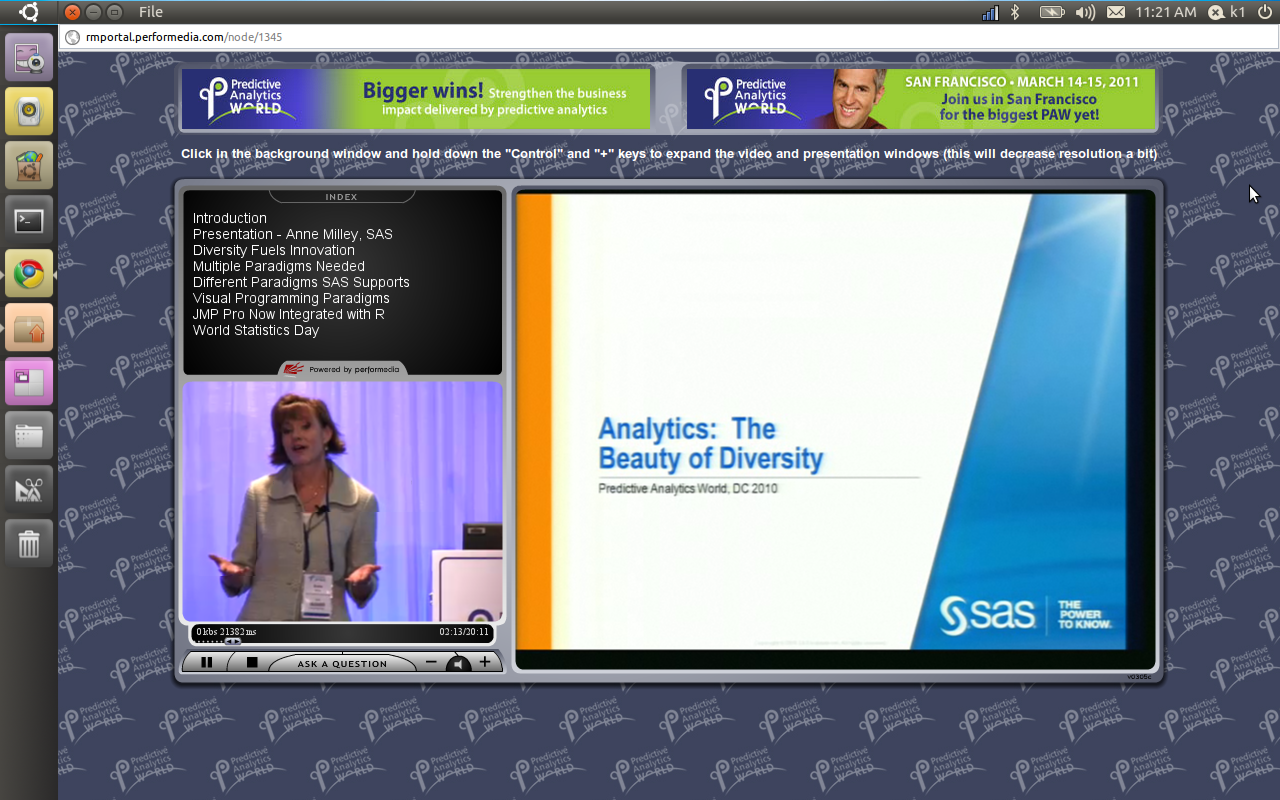
Platinum Sponsor Presentation: Analytics – The Beauty of Diversity
Anne H. Milley,Senior Director of Analytic Strategy, Worldwide Product Marketing, SAS
Analytics contributes to, and draws from, multiple disciplines. The unifying theme of “making the world a better place” is bred from diversity. For instance, the same methods used in econometrics might be used in market research, psychometrics and other disciplines. In a similar way, diverse paradigms are needed to best solve problems, reveal opportunities and make better decisions. This is why we evolve capabilities to formulate and solve a wide range of problems through multiple integrated languages and interfaces. Extending that, we have provided integration with other languages so that users can draw on the disciplines and paradigms needed to best practice their craft.
Gold Sponsor Presentation: Predictive Analytics Accelerate Insight for Financial Services
Finbarr Deely,Director of Business Development,ParAccel
Financial services organizations face immense hurdles in maintaining profitability and building competitive advantage. Financial services organizations must perform “what-if” scenario analysis, identify risks, and detect fraud patterns. The advanced analytic complexity required often makes such analysis slow and painful, if not impossible. This presentation outlines the analytic challenges facing these organizations and provides a clear path to providing the accelerated insight needed to perform in today’s complex business environment to reduce risk, stop fraud and increase profits. * The value of predictive analytics in Accelerating Insight * Financial Services Analytic Case Studies * Brief Overview of ParAccel Analytic Database
TOPIC: SURVEY ANALYSIS Case Study: YMCA Turning Member Satisfaction Surveys into an Actionable Narrative
Dean Abbott,President, Abbott Analytics
Employees are a key constituency at the Y and previous analysis has shown that their attitudes have a direct bearing on Member Satisfaction. This session will describe a successful approach for the analysis of YMCA employee surveys. Decision trees are built and examined in depth to identify key questions in describing key employee satisfaction metrics, including several interesting groupings of employee attitudes. Our approach will be contrasted with other factor analysis and regression-based approaches to survey analysis that we used initially. The predictive models described are currently in use and resulted in both greater understanding of employee attitudes, and a revised “short-form” survey with fewer key questions identified by the decision trees as the most important predictors.
TOPIC: INDUSTRY TRENDS 2010 Data Minter Survey Results: Highlights
Karl Rexer,Ph.D., Rexer Analytics
Do you want to know the views, actions, and opinions of the data mining community? Each year, Rexer Analytics conducts a global survey of data miners to find out. This year at PAW we unveil the results of our 4th Annual Data Miner Survey. This session will present the research highlights, such as:
Multiple Case Studies: U.S. DoD, U.S. DHS, SSA Text Mining: Lessons Learned
John F. Elder,Chief Scientist, Elder Research, Inc.
Text Mining is the “Wild West” of data mining and predictive analytics – the potential for gain is huge, the capability claims are often tall tales, and the “land rush” for leadership is very much a race.
In solving unstructured (text) analysis challenges, we found that principles from inductive modeling – learning relationships from labeled cases – has great power to enhance text mining. Dr. Elder highlights key technical breakthroughs discovered while working on projects for leading government agencies, including: Text Mining is the “Wild West” of data mining and predictive analytics – the potential for gain is huge, the capability claims are often tall tales, and the “land rush” for leadership is very much a race.
– Prioritizing searches for the Dept. of Homeland Security
– Quick decisions for Social Security Admin. disability
– Document discovery for the Dept. of Defense
– Disease discovery for the Dept. of Homeland Security
Keynote: How Target Gets the Most out of Its Guest Data to Improve Marketing ROI
Andrew Pole,Senior Manager, Media and Database Marketing, Target
In this session, you’ll learn how Target leverages its own internal guest data to optimize its direct marketing – with the ultimate goal of enhancing our guests’ shopping experience and driving in-store and online performance. You will hear about what guest data is available at Target, how and where we collect it, and how it is used to improve the performance and relevance of direct marketing vehicles. Furthermore, we will discuss Target’s development and usage of guest segmentation, response modeling, and optimization as means to suppress poor performers from mailings, determine relevant product categories and services for online targeted content, and optimally assign receipt marketing offers to our guests when offer quantities are limited.
Platinum Sponsor Presentation: Driving Analytics Into Decision Making
Jason Verlen,Director, SPSS Product Strategy & Management, IBM Software Group
Organizations looking to dramatically improve their business outcomes are turning to decision management, a convergence of technology and business processes that is used to streamline and predict the outcome of daily decision-making. IBM SPSS Decision Management technology provides the critical link between analytical insight and recommended actions. In this session you’ll learn how Decision Management software integrates analytics with business rules and business applications for front-line systems such as call center applications, insurance claim processing, and websites. See how you can improve every customer interaction, minimize operational risk, reduce fraud and optimize results.
TOPIC: DATA INFRASTRUCTURE AND INTEGRATION Case Study: Macy’s The world is not flat (even though modeling software has to think it is)
Paul Coleman,Director of Marketing Statistics, Macy’s Inc.
Software for statistical modeling generally use flat files, where each record represents a unique case with all its variables. In contrast most large databases are relational, where data are distributed among various normalized tables for efficient storage. Variable creation and model scoring engines are necessary to bridge data mining and storage needs. Development datasets taken from a sampled history require snapshot management. Scoring datasets are taken from the present timeframe and the entire available universe. Organizations, with significant data, must decide when to store or calculate necessary data and understand the consequences for their modeling program.
TOPIC: CUSTOMER VALUE Case Study: SunTrust When One Model Will Not Solve the Problem – Using Multiple Models to Create One Solution
Dudley Gwaltney,Group Vice President, Analytical Modeling, SunTrust Bank
In 2007, SunTrust Bank developed a series of models to identify clients likely to have large changes in deposit balances. The models include three basic binary and two linear regression models.
Based on the models, 15% of SunTrust clients were targeted as those most likely to have large balance changes. These clients accounted for 65% of the absolute balance change and 60% of the large balance change clients. The targeted clients are grouped into a portfolio and assigned to individual SunTrust Retail Branch. Since 2008, the portfolio generated a 2.6% increase in balances over control.
Using the SunTrust example, this presentation will focus on:
TOPIC: RESPONSE & CROSS-SELL Case Study: Paychex Staying One Step Ahead of the Competition – Development of a Predictive 401(k) Marketing and Sales Campaign
Jason Fox,Information Systems and Portfolio Manager,Paychex
In-depth case study of Paychex, Inc. utilizing predictive modeling to turn the tides on competitive pressures within their own client base. Paychex, a leading provider of payroll and human resource solutions, will guide you through the development of a Predictive 401(k) Marketing and Sales model. Through the use of sophisticated data mining techniques and regression analysis the model derives the probability a client will add retirement services products with Paychex or with a competitor. Session will include roadblocks that could have ended development and ROI analysis. Speaker: Frank Fiorille, Director of Enterprise Risk Management, Paychex Speaker: Jason Fox, Risk Management Analyst, Paychex
TOPIC: SEGMENTATION Practitioner: Canadian Imperial Bank of Commerce Segmentation Do’s and Don’ts
Daymond Ling,Senior Director, Modelling & Analytics,Canadian Imperial Bank of Commerce
The concept of Segmentation is well accepted in business and has withstood the test of time. Even with the advent of new artificial intelligence and machine learning methods, this old war horse still has its place and is alive and well. Like all analytical methods, when used correctly it can lead to enhanced market positioning and competitive advantage, while improper application can have severe negative consequences.
This session will explore what are the elements of success, and what are the worse practices that lead to failure. The relationship between segmentation and predictive modeling will also be discussed to clarify when it is appropriate to use one versus the other, and how to use them together synergistically.
TOPIC: SOCIAL DATA
Thought Leadership Social Network Analysis: Killer Application for Cloud Analytics
James Kobielus,Senior Analyst, Forrester Research
Social networks such as Twitter and Facebook are a potential goldmine of insights on what is truly going through customers´minds. Every company wants to know whether, how, how often, and by whom they´re being mentioned across the billowing new cloud of social media. Just as important, every company wants to influence those discussions in their favor, target new business, and harvest maximum revenue potential. In this session, Forrester analyst James Kobielus identifies fruitful applications of social network analysis in customer service, sales, marketing, and brand management. He presents a roadmap for enterprises to leverage their inline analytics initiatives and leverage high-performance data warehousing (DW) clouds and appliances in order to analyze shifting patterns of customer sentiment, influence, and propensity. Leveraging Forrester’s ongoing research in advanced analytics and customer relationship management, Kobielus will discuss industry trends, commercial modeling tools, and emerging best practices in social network analysis, which represents a game-changing new discipline in predictive analytics.
Trish Mathe,
Director of Database Marketing, Life Line Screening
While Life Line is successfully executing a US CRM roadmap, they are also beginning this same evolution abroad. They are beginning in the UK where Merkle procured data and built a response model that is pulling responses over 30% higher than competitors. This presentation will give an overview of the US CRM roadmap, and then focus on the beginning of their strategy abroad, focusing on the data procurement they could not get anywhere else but through Merkle and the successful modeling and analytics for the UK. Speaker: Ozgur Dogan, VP, Quantitative Solutions Group, Merkle Inc Speaker: Trish Mathe, Director of Database Marketing, Life Line Screening
TOPIC: SURVEY ANALYSIS Case Study: Forrester Making Survey Insights Addressable and Scalable – The Case Study of Forrester’s Technographics Benchmark Survey
Marketers use surveys to create enterprise wide applicable strategic insights to: (1) develop segmentation schemes, (2) summarize consumer behaviors and attitudes for the whole US population, and (3) use multiple surveys to draw unified views about their target audience. However, these insights are not directly addressable and scalable to the whole consumer universe which is very important when applying the power of survey intelligence to the one to one consumer marketing problems marketers routinely face. Acxiom partnered with Forrester Research, creating addressable and scalable applications of Forrester’s Technographics Survey and applied it successfully to a number of industries and applications.
TOPIC: HEALTHCARE Case Study: UPMC Health Plan A Predictive Model for Hospital Readmissions
Scott Zasadil,Senior Scientist, UPMC Health Plan
Hospital readmissions are a significant component of our nation’s healthcare costs. Predicting who is likely to be readmitted is a challenging problem. Using a set of 123,951 hospital discharges spanning nearly three years, we developed a model that predicts an individual’s 30-day readmission should they incur a hospital admission. The model uses an ensemble of boosted decision trees and prior medical claims and captures 64% of all 30-day readmits with a true positive rate of over 27%. Moreover, many of the ‘false’ positives are simply delayed true positives. 53% of the predicted 30-day readmissions are readmitted within 180 days.
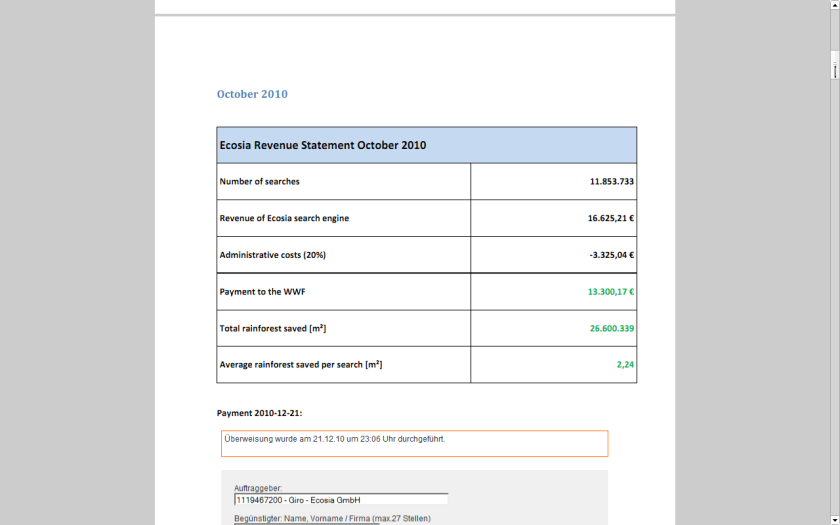
I recently found an interesting example of a website that both makes a lot of money and yet is much more efficient than any free or non profit. It is called ECOSIA
If you see a website that wants to balance administrative costs plus have a transparent way to make the world better- this is a great example.
World’s largest tropical forest reserve (38,867 square kilometers, or about the size of Switzerland)
Home to about 14% of all amphibian species and roughly 54% of all bird species in the Amazon – not to mention large populations of at least eight threatened species, including the jaguar
Includes part of the Guiana Shield containing 25% of world’s remaining tropical rainforests – 80 to 90% of which are still pristine
Holds the last major unpolluted water reserves in the Neotropics, containing approximately 20% of all of the Earth’s water
One of the last tropical regions on Earth vastly unaltered by humans
Significant contributor to climatic regulation via heat absorption and carbon storage
Click per milli (or CPM) gives you a very low low conversion compared to contacting ad sponsor directly.
But its a great data experiment-
as you can monitor which companies are likely to be advertised on your site (assume google knows more about their algols than you will)
which formats -banner or text or flash have what kind of conversion rates
what are the expected pay off rates from various keywords or companies (like business intelligence software, predictive analytics software and statistical computing software are similar but have different expected returns (if you remember your eco class)
NOW- Based on above data, you know whats your minimum baseline to expect from a private advertiser than a public, crowd sourced search engine one (like Google or Bing)
Lets say if you have 100000 views monthly. and assume one out of 1000 page views will lead to a click. Say the advertiser will pay you 1 $ for every 1 click (=1000 impressions)
Then your expected revenue is $100.But if your clicks are priced at 2.5$ for every click , and your click through rate is now 3 out of 1000 impressions- (both very moderate increases that can done by basic placement optimization of ad type, graphics etc)-your new revenue is 750$.
Be a good Samaritan- you decide to share some of this with your audience -like 4 Amazon books per month ( or I free Amazon book per week)- That gives you a cost of 200$, and leaves you with some 550$.
Wait! it doesnt end there- Adam Smith‘s invisible hand moves on .
You say hmm let me put 100 $ for an annual paper writing contest of $1000, donate $200 to one laptop per child ( or to Amazon rain forests or to Haiti etc etc etc), pay $100 to your upgraded server hosting, and put 350$ in online advertising. say $200 for search engines and $150 for Facebook.
Woah!
Month 1 would should see more people visiting you for the first time. If you have a good return rate (returning visitors as a %, and low bounce rate (visits less than 5 secs)- your traffic should see atleast a 20% jump in new arrivals and 5-10 % in long term arrivals. Ignoring bounces- within three months you will have one of the following
1) An interesting case study on statistics on online and social media advertising, tangible motivations for increasing community response , and some good data for study
2) hopefully better cost management of your server expenses
3)very hopefully a positive cash flow
you could even set a percentage and share the monthly (or annually is better actions) to your readers and advertisers.
go ahead- change the world!
the key paradigms here are sharing your traffic and revenue openly to everyone
donating to a suitable cause
helping increase awareness of the suitable cause
basing fixed percentages rather than absolute numbers to ensure your site and cause are sustained for years.
Additional features in R over other analytical packages-
1) Source Code is given to ensure complete custom solution and embedding for a particular application. Open source code has an advantage that is extensively peer- reviewed in Journals and Scientific Literature. This means bugs will found, shared and corrected transparently.
2) Wide literature of training material in the form of books is available for the R analytical platform.
3) Extensively the best data visualization tools in analytical software (apart from Tableau Software ‘s latest version). The extensive data visualization available in R is of the form a variety of customizable graphs, as well as animation. The principal reason third-party software initially started creating interfaces to R is because the graphical library of packages in R is more advanced as well as rapidly getting more features by the day.
4) Free in upfront license cost for academics and thus budget friendly for small and large analytical teams.
5) Flexible programming for your data environment. This includes having packages that ensure compatibility with Java, Python and C++.
6) Easy migration from other analytical platforms to R Platform. It is relatively easy for a non R platform user to migrate to R platform and there is no danger of vendor lock-in due to the GPL nature of source code and open community.
Statistics are numbers that tell (descriptive), advise ( prescriptive) or forecast (predictive). Analytics is a decision-making help tool. Analytics on which no decision is to be made or is being considered can be classified as purely statistical and non analytical. Thus ease of making a correct decision separates a good analytical platform from a not so good analytical platform. The distinction is likely to be disputed by people of either background- and business analysis requires more emphasis on how practical or actionable the results are and less emphasis on the statistical metrics in a particular data analysis task. I believe one clear reason between business analytics is different from statistical analysis is the cost of perfect information (data costs in real world) and the opportunity cost of delayed and distorted decision-making.
Specific to the following domains R has the following costs and benefits
Business Analytics
R is free per license and for download
It is one of the few analytical platforms that work on Mac OS
It’s results are credibly established in both journals like Journal of Statistical Software and in the work at LinkedIn, Google and Facebook’s analytical teams.
It has open source code for customization as per GPL
It also has a flexible option for commercial vendors like Revolution Analytics (who support 64 bit windows) as well as bigger datasets
It has interfaces from almost all other analytical software including SAS,SPSS, JMP, Oracle Data Mining, Rapid Miner. Existing license holders can thus invoke and use R from within these software
Huge library of packages for regression, time series, finance and modeling
High quality data visualization packages
Data Mining
R as a computing platform is better suited to the needs of data mining as it has a vast array of packages covering standard regression, decision trees, association rules, cluster analysis, machine learning, neural networks as well as exotic specialized algorithms like those based on chaos models.
Flexibility in tweaking a standard algorithm by seeing the source code
The RATTLE GUI remains the standard GUI for Data Miners using R. It was created and developed in Australia.
Business Dashboards and Reporting
Business Dashboards and Reporting are an essential piece of Business Intelligence and Decision making systems in organizations. R offers data visualization through GGPLOT, and GUI like Deducer and Red-R can help even non R users create a metrics dashboard
For online Dashboards- R has packages like RWeb, RServe and R Apache- which in combination with data visualization packages offer powerful dashboard capabilities.
R can be combined with MS Excel using the R Excel package – to enable R capabilities to be imported within Excel. Thus a MS Excel user with no knowledge of R can use the GUI within the R Excel plug-in to use powerful graphical and statistical capabilities.
Additional factors to consider in your R installation-
There are some more choices awaiting you now-
1) Licensing Choices-Academic Version or Free Version or Enterprise Version of R
2) Operating System Choices-Which Operating System to choose from? Unix, Windows or Mac OS.
3) Operating system sub choice- 32- bit or 64 bit.
4) Hardware choices-Cost -benefit trade-offs for additional hardware for R. Choices between local ,cluster and cloud computing.
5) Interface choices-Command Line versus GUI? Which GUI to choose as the default start-up option?
6) Software component choice- Which packages to install? There are almost 3000 packages, some of them are complimentary, some are dependent on each other, and almost all are free.
7) Additional Software choices- Which additional software do you need to achieve maximum accuracy, robustness and speed of computing- and how to use existing legacy software and hardware for best complementary results with R.
1) Licensing Choices-
You can choose between two kinds of R installations – one is free and open source from http://r-project.org The other R installation is commercial and is offered by many vendors including Revolution Analytics. However there are other commercial vendors too.
Windows remains the most widely used operating system on this planet. If you are experienced in Windows based computing and are active on analytical projects- it would not make sense for you to move to other operating systems. This is also based on the fact that compatibility problems are minimum for Microsoft Windows and the help is extensively documented. However there may be some R packages that would not function well under Windows- if that happens a multiple operating system is your next option.
Enterprise R from Revolution Analytics- Enterprise R from Revolution Analytics has a complete R Development environment for Windows including the use of code snippets to make programming faster. Revolution is also expected to make a GUI available by 2011. Revolution Analytics claims several enhancements for it’s version of R including the use of optimized libraries for faster performance.
MacOS
Reasons for choosing MacOS remains its considerable appeal in aesthetically designed software- but MacOS is not a standard Operating system for enterprise systems as well as statistical computing. However open source R claims to be quite optimized and it can be used for existing Mac users. However there seem to be no commercially available versions of R available as of now for this operating system.
Linux
Ubuntu
Red Hat Enterprise Linux
Other versions of Linux
Linux is considered a preferred operating system by R users due to it having the same open source credentials-much better fit for all R packages and it’s customizability for big data analytics.
Ubuntu Linux is recommended for people making the transition to Linux for the first time. Ubuntu Linux had an marketing agreement with revolution Analytics for an earlier version of Ubuntu- and many R packages can installed in a straightforward way as Ubuntu/Debian packages are available. Red Hat Enterprise Linux is officially supported by Revolution Analytics for it’s enterprise module. Other versions of Linux popular are Open SUSE.
Multiple operating systems-
Virtualization vs Dual Boot-
You can also choose between having a VMware VM Player for a virtual partition on your computers that is dedicated to R based computing or having operating system choice at the startup or booting of your computer. A software program called wubi helps with the dual installation of Linux and Windows.
64 bit vs 32 bit – Given a choice between 32 bit versus 64 bit versions of the same operating system like Linux Ubuntu, the 64 bit version would speed up processing by an approximate factor of 2. However you need to check whether your current hardware can support 64 bit operating systems and if so- you may want to ask your Information Technology manager to upgrade atleast some operating systems in your analytics work environment to 64 bit operating systems.
Hardware choices- At the time of writing this book, the dominant computing paradigm is workstation computing followed by server-client computing. However with the introduction of cloud computing, netbooks, tablet PCs, hardware choices are much more flexible in 2011 than just a couple of years back.
Hardware costs are a significant cost to an analytics environment and are also remarkably depreciated over a short period of time. You may thus examine your legacy hardware, and your future analytical computing needs- and accordingly decide between the various hardware options available for R.
Unlike other analytical software which can charge by number of processors, or server pricing being higher than workstation pricing and grid computing pricing extremely high if available- R is well suited for all kinds of hardware environment with flexible costs. Given the fact that R is memory intensive (it limits the size of data analyzed to the RAM size of the machine unless special formats and /or chunking is used)- it depends on size of datasets used and number of concurrent users analyzing the dataset. Thus the defining issue is not R but size of the data being analyzed.
Local Computing- This is meant to denote when the software is installed locally. For big data the data to be analyzed would be stored in the form of databases.
Server version- Revolution Analytics has differential pricing for server -client versions but for the open source version it is free and the same for Server or Workstation versions.
Workstation
Cloud Computing- Cloud computing is defined as the delivery of data, processing, systems via remote computers. It is similar to server-client computing but the remote server (also called cloud) has flexible computing in terms of number of processors, memory, and data storage. Cloud computing in the form of public cloud enables people to do analytical tasks on massive datasets without investing in permanent hardware or software as most public clouds are priced on pay per usage. The biggest cloud computing provider is Amazon and many other vendors provide services on top of it. Google is also coming for data storage in the form of clouds (Google Storage), as well as using machine learning in the form of API (Google Prediction API)
Amazon
Google
Cluster-Grid Computing/Parallel processing- In order to build a cluster, you would need the RMpi and the SNOW packages, among other packages that help with parallel processing.
How much resources
RAM-Hard Disk-Processors- for workstation computing
Instances or API calls for cloud computing
Interface Choices
Command Line
GUI
Web Interfaces
Software Component Choices
R dependencies
Packages to install
Recommended Packages
Additional software choices
Additional legacy software
Optimizing your R based computing
Code Editors
Code Analyzers
Libraries to speed up R
citation- R Development Core Team (2010). R: A language and environment for statistical computing. R Foundation for Statistical Computing,Vienna, Austria. ISBN 3-900051-07-0, URL http://www.R-project.org.
Tal G, creator of the rbloggers.com website, has created a new blog aggregator for SAS language users at http://sas-x.com/
With almost 26 blogs joining there (I suspect many more should join , it seems like a good website to use for analytics users and students. My favorite SAS Blog is http://statcompute.spaces.live.com/ – its pure code- little anything else.
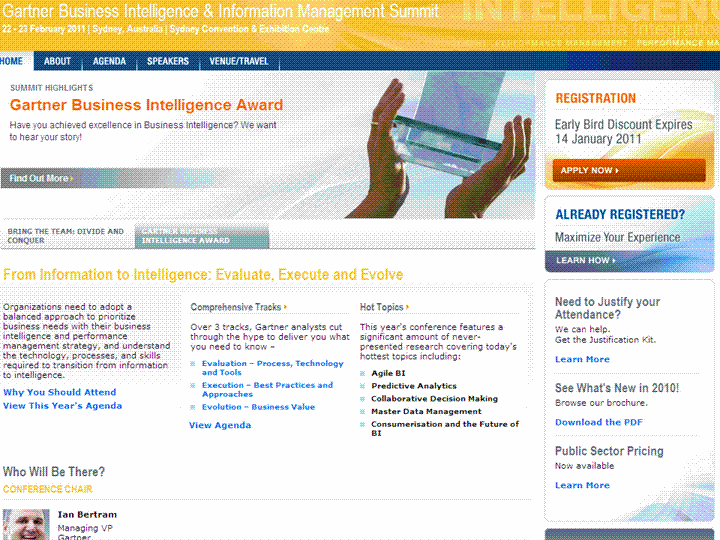
At Gartner Business Intelligence & Information Management Summit 2011 you will experience a unique mix of Gartner research presentations, guest keynote addresses, real-life case studies and interactive panel discussions to provide you with a holistic view of the business intelligence and performance management landscape. Information, insight and advice are channeled through an increasingly targeted and focused approach, taking you from the high-level strategic view all the way to your specific issue.
Click here to view the full agenda or download the brochure.
AGENDA HIGHLIGHTS
Guest Keynote Address Future Thinking – Global Trends and Thinking that are Upending your Business
Analytics – Business Intelligence and Performance Management ITScore
Analyst User Roundtables:
Enterprise Information Management – Focusing on What Matters to the Business
Sharepoint – thin edge of the wedge to the MS family
Preparing for the 2020 workplace
Worldwide Expertise at Your Fingertips! Your questions on Business Intelligence and Performance Management answered. Meet the Gartner Analysts presenting at the Summit and book your exclusive 30 minute one-on-one (lap top dance) with the Analysts of your choice.