SAS for R Users

I recently managed to get a copy of SAS University Edition.  Screenshot from 2015-03-04 19:54:34

1) Here were some problems I had to resolve- The download size is 1.5 gb of a zipped file ( a virtual machine image). Since I have a internet broadband based in India it led to many failed attempts before I could get it. The unzipped file is almost 3.5 gb. You can get the download file here http://www.sas.com/en_us/software/university-edition/download-software.html.

Secondly the hardware needed is 64 bit, so I basically upgraded my Dell Computer. This was a useful upgrade for me anyway.

2) You can get an Internet Download Manager to resume downloading in case your Internet connection has issues downloading a 1.5 gb file in one go. For Linux you can see http://flareget.com/download/

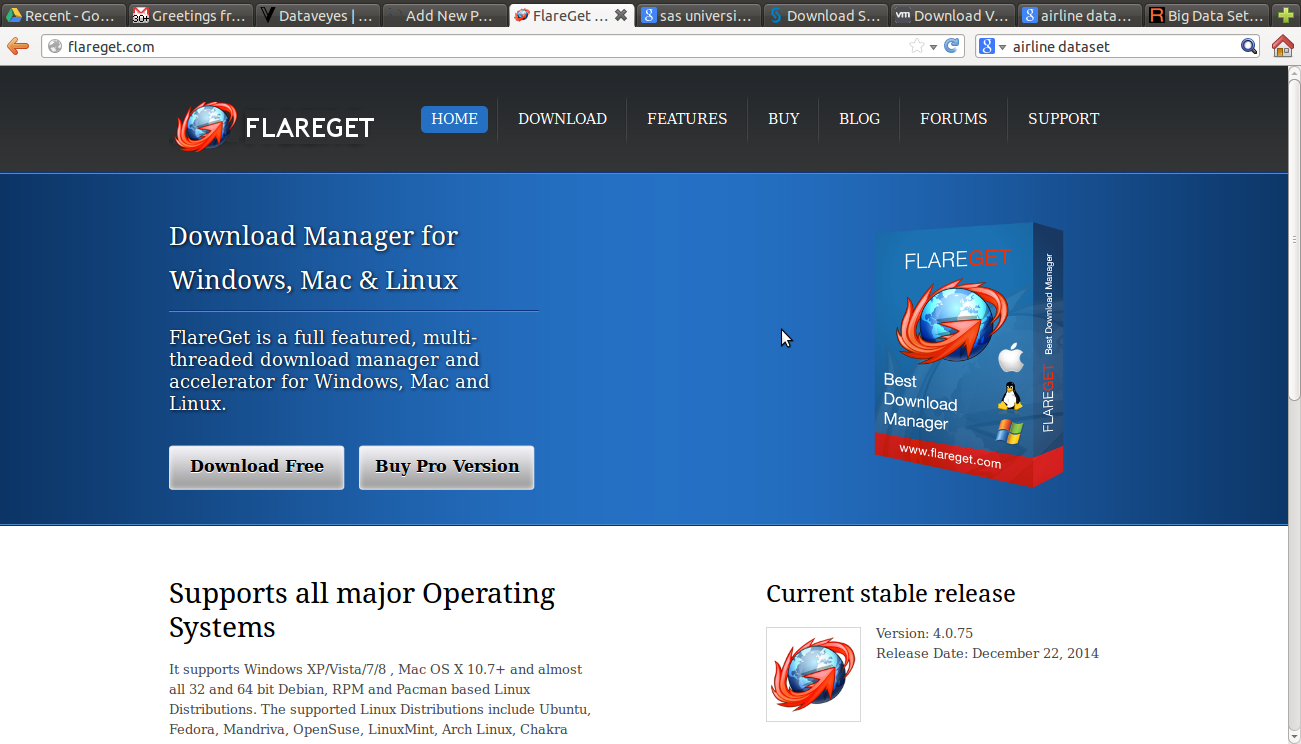
and for Windows http://www.internetdownloadmanager.com/download.html


3) I chose VM Player for Linux because I am much more comfortable with VM Player ( Desktop free version). I got that from here ~200 MB https://my.vmware.com/web/vmware/free#desktop_end_user_computing/vmware_player/6_0

Screenshot from 2015-03-04 19:39:17

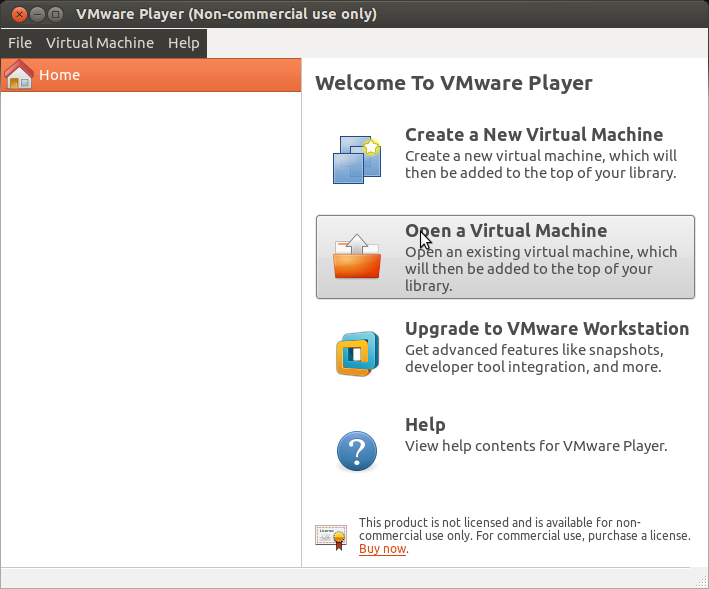
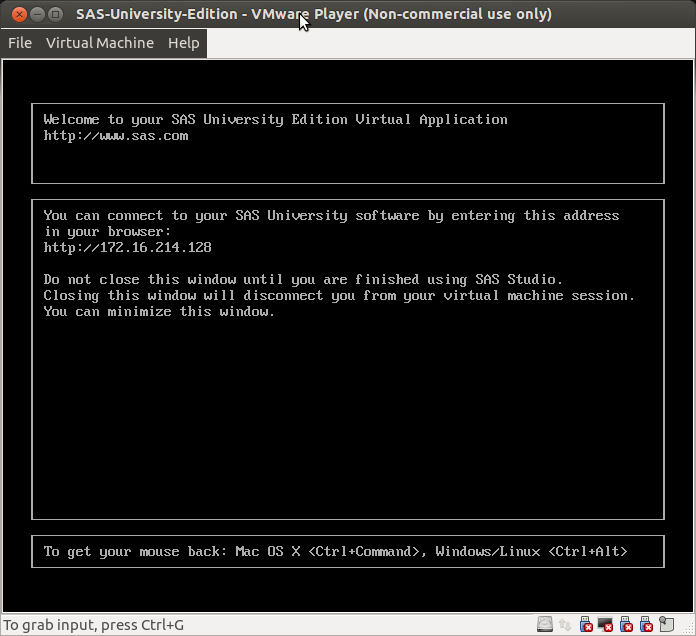
4) Finally I installed VM Player and Open an Existing Virtual Machine to boot up SAS University Edition  Screenshot from 2015-03-04 19:43:08


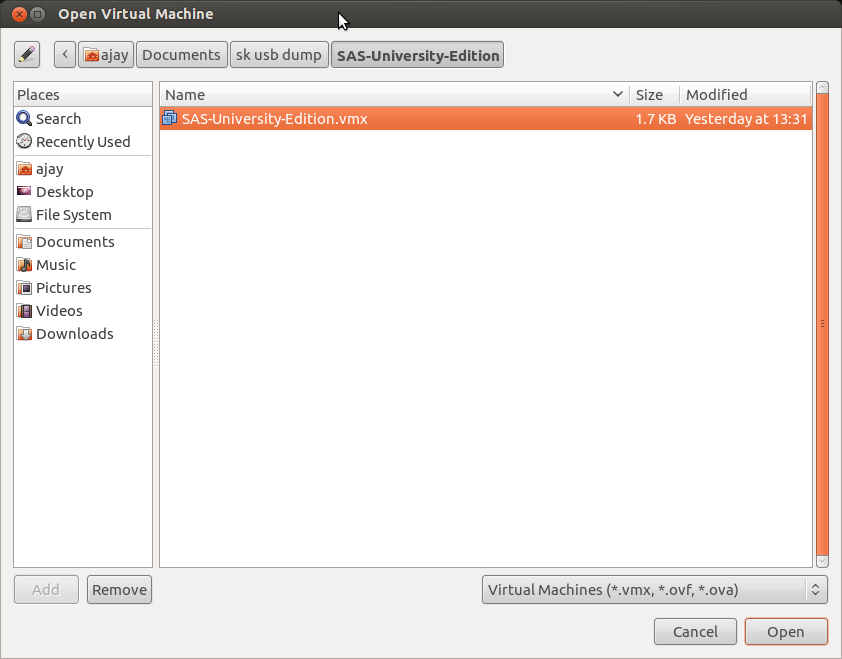
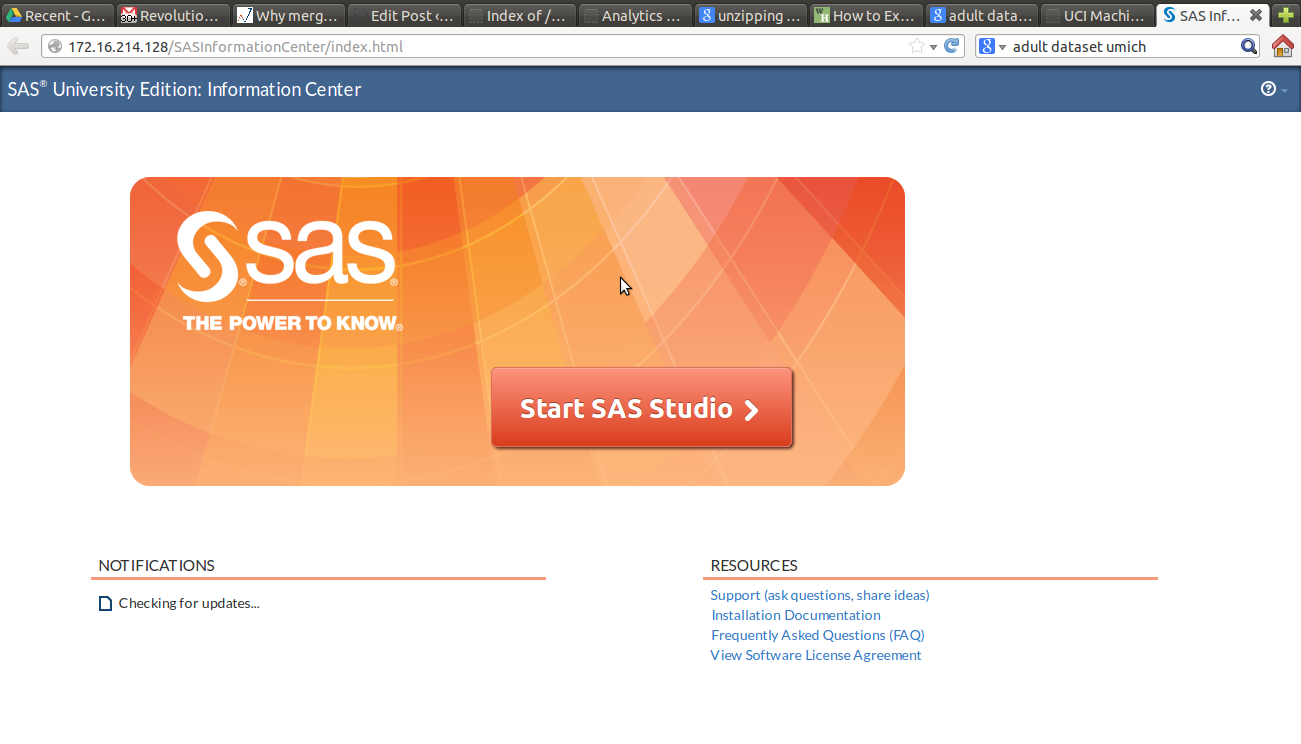
I was able to open the SAS Studio at the IP Address provided.

Screenshot from 2015-03-04 21:52:32

5)


I downloaded a   Dataset from this collection here

https://archive.ics.uci.edu/ml/datasets/Adult


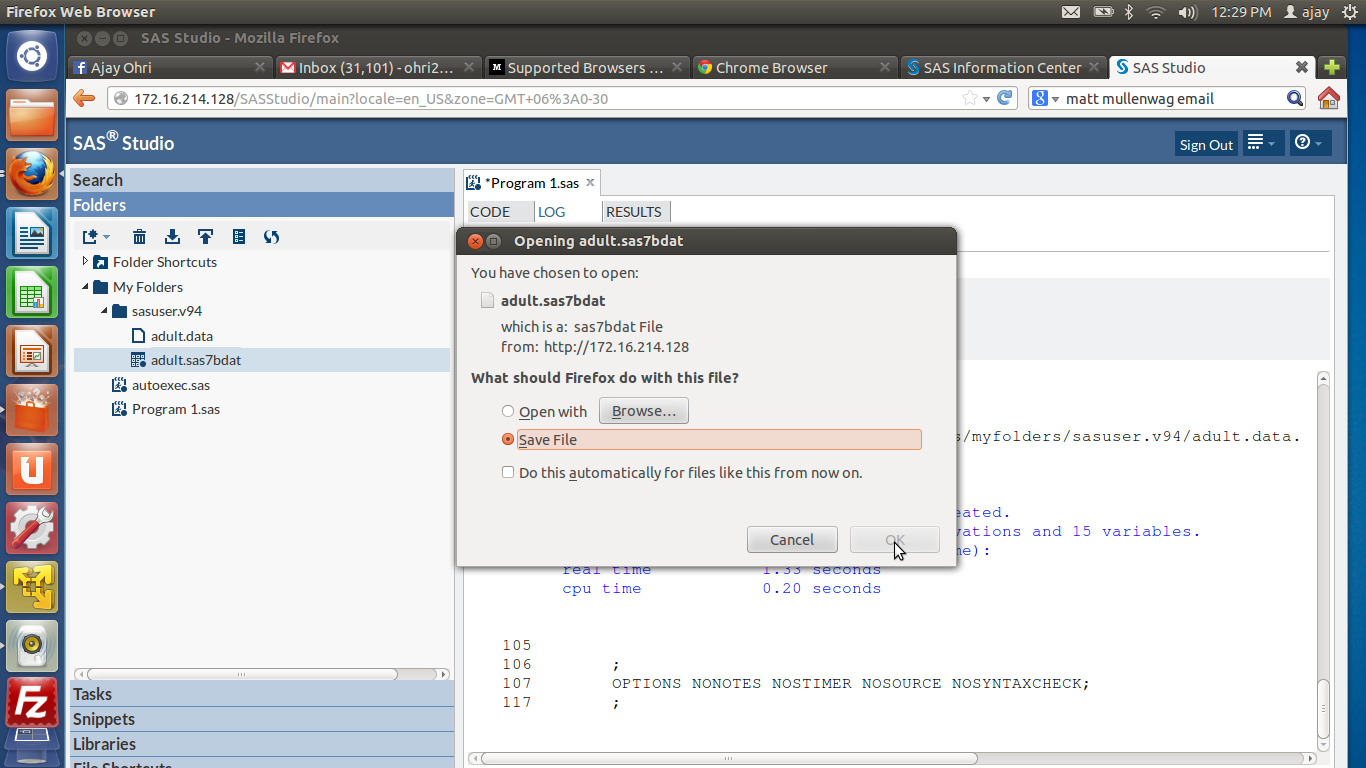
6) Then I uploaded it to within the SAS Studio System

Screenshot from 2015-02-28 17:06:34Screenshot from 2015-03-03 12:29:07

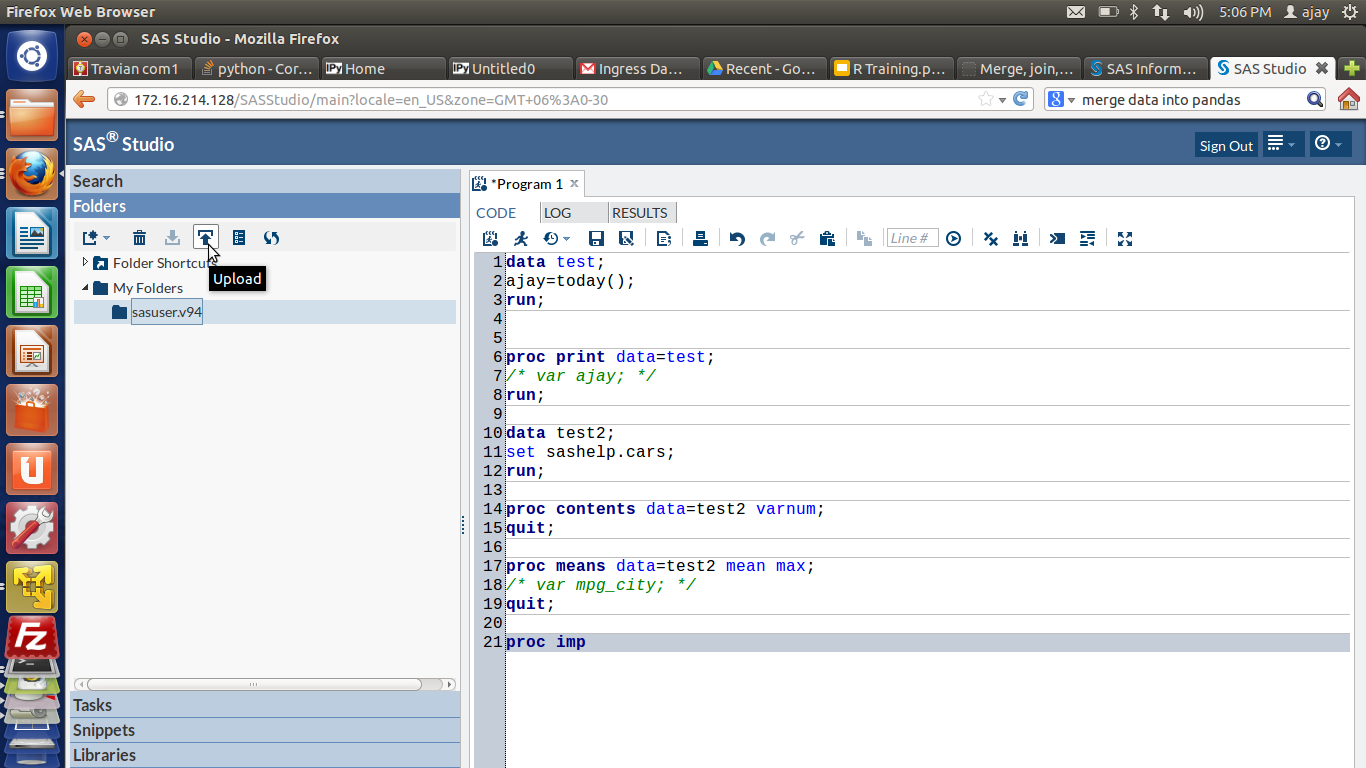
7) Lastly I was able to run some basic commandsScreenshot from 2015-03-03 12:27:48

Screenshot from 2015-03-04 21:54:06

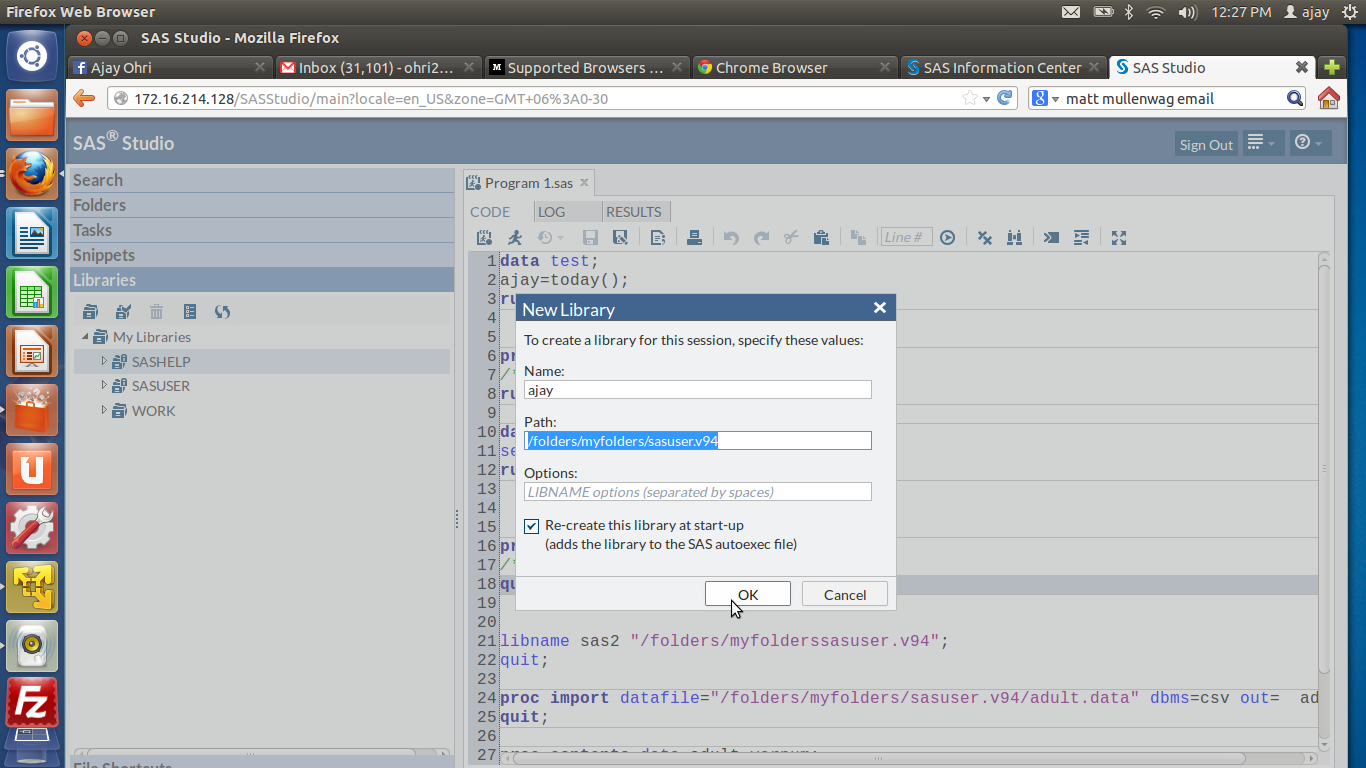
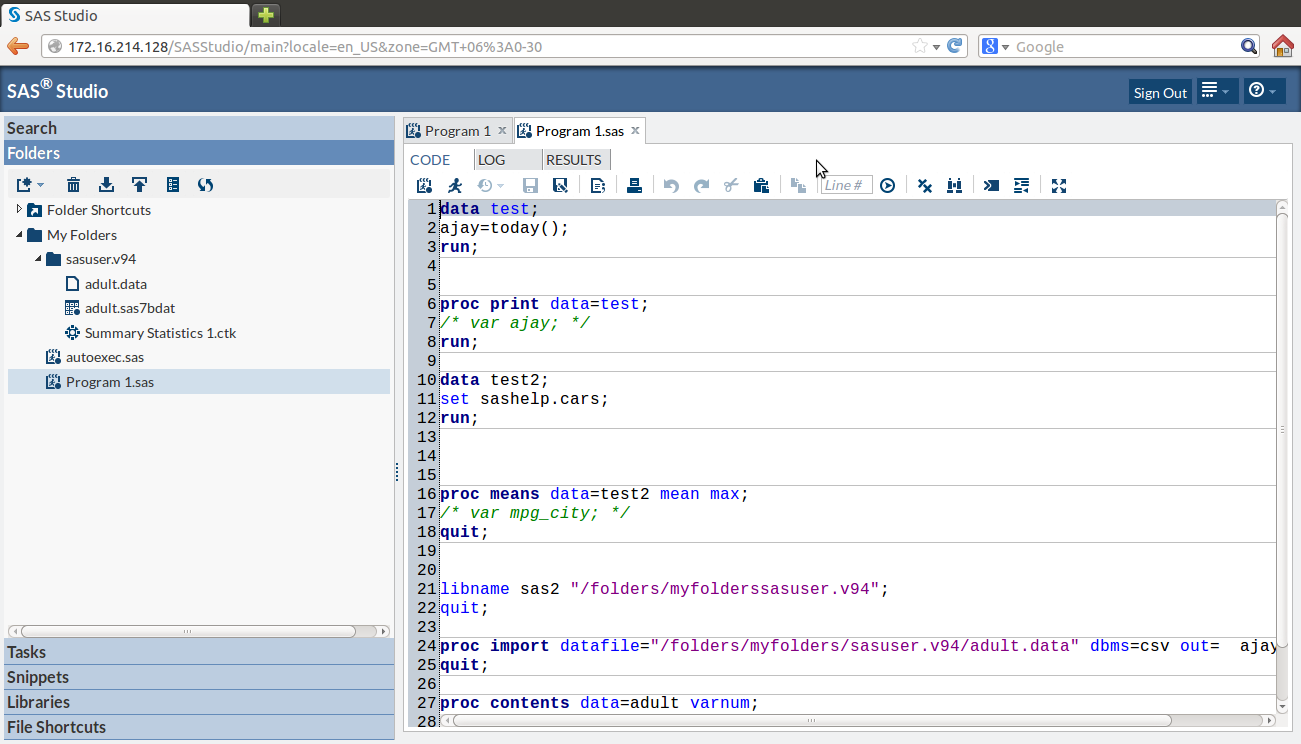
I was really impressed by the enhancements made to the interface, the ability to search command help through a drop down, the color coded editor and of course the case insensitive SAS language (though I am not a fan of the semi colon I loved using Ctrl + / for easy commenting and uncommenting)

  1. For a SAS turned R turned SAS coder- here are some views
  2. SAS has different windows for coding, log and output. R generally has one
  3. SAS is case insensitive while R is case sensitive. This is a blessing especially for variable and dataset names.
  4. SAS deals with Datasets than can be considered the same as Rs Data Frame.
  5. R’s flexibility in data types is not really comparable to SAS as it is quite fast enough.
  6. SAS has a Macro Language for repeatable tasks
  7. SQL is embedded within SAS as Proc SQL and in R through sqldf package
  8. You have to pay for each upgrade in SAS ecosystem. I am not clear on the transparent pricing, which components does what and whether they have a cloud option for renting by the hour. How about one web page that lists product description and price.
  9. SAS University Edition is a OS agnostic tool, for that itself it is quite impressive compared to say Academic Edition of Revolution Analytics.
  10. R is object oriented and uses [] and $ notation for sub objects. SAS is divided into two main parts- data and proc steps, and uses the . notation and var system
  11. SAS language has a few basic procs but many many options.
  12. How good a SAS coder you are often depends on what you can do in data manipulation in SAS Data Step
  13. Graphics is still better in R ggplot. But the SAS speed is thrilling.
  14. RAM is limited in the University Edition to 1 GB but I found that still quite fast. However I can upload only a 10 mb file to the SAS Studio for University Edition which I found reasonable for teaching purposes.


Saving Output in R for Presentations

While SAS language has a beautifully designed ODS (Output Delivery System) for saving output from certain analysis in excel files (and html and others), in R one can simply use the object, put it in a write.table and save it a csv file using the file parameter within write.table.

As a business analytics consultant, the output from a Proc Means, Proc Freq (SAS) or a summary/describe/table command (in R) is to be presented as a final report. Copying and pasting is not feasible especially for large amounts of text, or remote computers.

Using the following we can simple save the output  in R


> getwd()
[1] “C:/Users/KUs/Desktop/Ajay”
> setwd(“C:\Users\KUs\Desktop”)

#We shifted the directory, so we can save output without putting the entire path again and again for each step.

#I have found the summary command most useful for initial analysis and final display (particularly during the data munging step)

nams=summary(ajay)

# I assigned a new object to the analysis step (summary), it could also be summary,names, describe (HMisc) or table (for frequency analysis),
> write.table(nams,sep=”,”,file=”output.csv”)

Note: This is for basic beginners in R using it for business analytics dealing with large number of variables.


pps: Note

If you have a large number of files in a local directory to be read in R, you can avoid typing the entire path again and again by modifying the file parameter in the read.table and changing the working directory to that folder


setwd(“C:/Users/KUs/Desktop/”)
ajayt1=read.table(file=”test1.csv”,sep=”,”,header=T)

ajayt2=read.table(file=”test2.csv”,sep=”,”,header=T)


and so on…

maybe there is a better approach somewhere on Stack Overflow or R help, but this will work just as well.

you can then merge the objects created ajayt1 and ajayt2… (to be continued)

Protected: Converting SAS language code to Java

This content is password protected. To view it please enter your password below:

Protected: Using SAS and C/C++ together

This content is password protected. To view it please enter your password below:

Open Source Compiler for SAS language/ GNU -DAP

A Bold GNU Head
Image via Wikipedia

I am still testing this out.

But if you know bit more about make and .compile in Ubuntu check out

http://www.gnu.org/software/dap/

I loved the humorous introduction

Dap is a small statistics and graphics package based on C. Version 3.0 and later of Dap can read SBS programs (based on the utterly famous, industry standard statistics system with similar initials – you know the one I mean)! The user wishing to perform basic statistical analyses is now freed from learning and using C syntax for straightforward tasks, while retaining access to the C-style graphics and statistics features provided by the original implementation. Dap provides core methods of data management, analysis, and graphics that are commonly used in statistical consulting practice (univariate statistics, correlations and regression, ANOVA, categorical data analysis, logistic regression, and nonparametric analyses).

Anyone familiar with the basic syntax of C programs can learn to use the C-style features of Dap quickly and easily from the manual and the examples contained in it; advanced features of C are not necessary, although they are available. (The manual contains a brief introduction to the C syntax needed for Dap.) Because Dap processes files one line at a time, rather than reading entire files into memory, it can be, and has been, used on data sets that have very many lines and/or very many variables.

I wrote Dap to use in my statistical consulting practice because the aforementioned utterly famous, industry standard statistics system is (or at least was) not available on GNU/Linux and costs a bundle every year under a lease arrangement. And now you can run programs written for that system directly on Dap! I was generally happy with that system, except for the graphics, which are all but impossible to use,  but there were a number of clumsy constructs left over from its ancient origins.

http://www.gnu.org/software/dap/#Sample output

  • Unbalanced ANOVA
  • Crossed, nested ANOVA
  • Random model, unbalanced
  • Mixed model, balanced
  • Mixed model, unbalanced
  • Split plot
  • Latin square
  • Missing treatment combinations
  • Linear regression
  • Linear regression, model building
  • Ordinal cross-classification
  • Stratified 2×2 tables
  • Loglinear models
  • Logit  model for linear-by-linear association
  • Logistic regression
  • Copyright © 2001, 2002, 2003, 2004 Free Software Foundation, Inc., 51 Franklin Street, Fifth Floor, Boston, MA 02110-1301, USA

    sounds too good to be true- GNU /DAP joins WPS workbench and Dulles Open’s Carolina as the third SAS language compiler (besides the now defunct BASS software) see http://en.wikipedia.org/wiki/SAS_language#Controversy


    Also see http://en.wikipedia.org/wiki/DAP_(software)

    Dap was written to be a free replacement for SAS, but users are assumed to have a basic familiarity with the C programming language in order to permit greater flexibility. Unlike R it has been designed to be used on large data sets.

    It has been designed so as to cope with very large data sets; even when the size of the data exceeds the size of the computer’s memory

    %d bloggers like this: