Is Game of Thrones more popular than Lost
Not quite. But its getting there!
http://www.google.com/trends/explore#q=game%20of%20thrones%2C%20%2Fm%2F0828jw&cmpt=q
Not quite. But its getting there!
http://www.google.com/trends/explore#q=game%20of%20thrones%2C%20%2Fm%2F0828jw&cmpt=q
Here is a short post in retrieving information from the Google+ API using R, and then analysing it.
To create an API key:
from- https://developers.google.com/+/api/oauth
and the R code
#install.packages("plusser") library(plusser) help(plusser) library(RCurl) options(RCurlOptions = list(cainfo = system.file("CurlSSL", "cacert.pem", package = "RCurl"))) setAPIkey('AIzaSyBtYqDsAtzp4FOS7FGbrc_n6mD-uJIOvcQ') myProfile=harvestProfile("+AjayOhri", parseFun = parseProfile) str(myProfile) myposts=harvestPage("+AjayOhri", parseFun = parsePost, results = 1, nextToken = NULL, cr = 1) str(myposts) head(myposts) plot(myposts$ti,myposts$nC) #number of comments plot(myposts$ti,myposts$nP) #number of likes or plus 1 plot(myposts$ti,myposts$nR) #number of reshares some screenshots and images![]()
You can also see the Rpubs document here http://rpubs.com/decisionstats2/plusser Now you can do text analysis and sentiment analysis on myposts$msg and do social media analysis on what makes people like what kind of content. For better results, use a google plus id (page or person) which has a lot of PUBLIC posts!
Hu ha! Latest sexy software from our man Dr Hadley Wickham and his ninjas at RStudio. Now YOU can make a Business Intelligence software for FREE. How good is it? time will tell if someone can use it to give Tableau Software and Qlikview a run for the money
Seriously- I would like to see ONE implementation of RHadoop and Shiny with ggplot2 and d3
(Big data analytics indeed 😉 )
from
———————————-
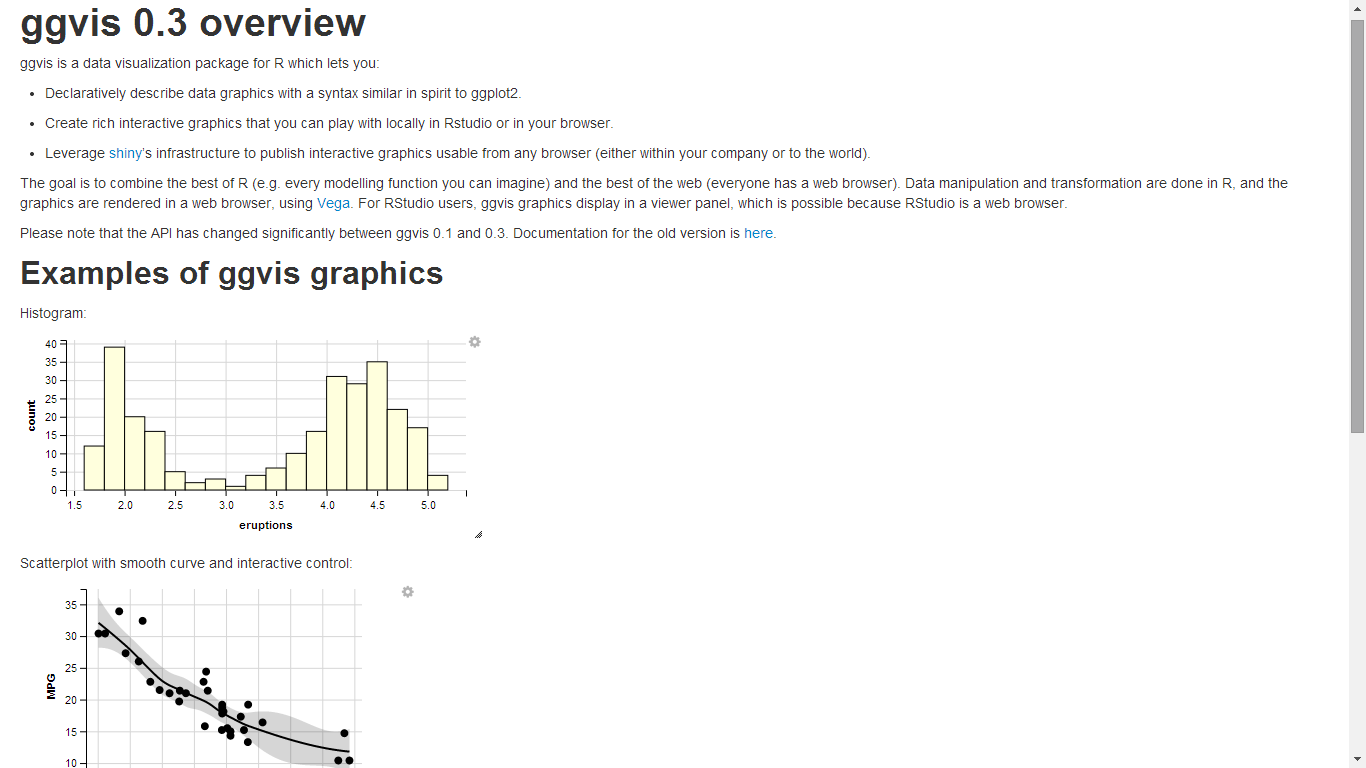
ggvis is a data visualization package for R which lets you:
The goal is to combine the best of R (e.g. every modelling function you can imagine) and the best of the web (everyone has a web browser). Data manipulation and transformation are done in R, and the graphics are rendered in a web browser, using Vega. For RStudio users, ggvis graphics display in a viewer panel, which is possible because RStudio is a web browser.
Please note that the API has changed significantly between ggvis 0.1 and 0.3. Documentation for the old version is here.
a great way to learn Git easily is here https://try.github.io/
This is a much better designed code school project than the one for R
However Swirl is a great way to learn R in an interactive way. its only drawback is it needs to be integrated with something like http://www.r-fiddle.org/#/ for a true automated browser only version
Why do I favor automated elearning solutions now? Because teaching the same thing again and again can be boring for the teacher and videos can be boring for the students. Note how the potential student is given positive reinforcement to boost his morale, something any good teacher know.
Based on – the literary and strategic classic
There is a disturbing trend I see in members of R Community particularly in its evangelical wing, in claiming R is the panacea and cure for all things statistical. No one software can and will be able to handle all the parts of the data analytics pipeline equally well, there will always be trade-offs based on perceptual assessments of both current needs and future trends.
While an employee of a proprietary software company can and will always claim that his software is the best and fastest for everything, what has happened over the past few years is that analytics open source software people have been neatly split into Pythonistas and R Users.
This is a disturbing trend. Rather than mimick and copy libraries and packages between R and Python, there should be a movement for greater inter-operability and transparency in cross training. Why cant you teach Pandas in a R Meetup and Why cant you learn ggplot2 in a Python meetup.
United we stand and both R and Python communities will gain. Divided, the opponents of open source will end up appropriating the work of the community and laugh all the way to the bank.
More R and More Python. Like Rum with Cola. Not Seperately, but together. Is that a pipe dream, or will that benefit industry? I would love to see atleast one big startup making products and services in both!