Interview Heiko Miertzsch eoda #rstats #startups

This is an interview wit Heiko Miertzsch, founder EODA ( http://www.eoda.de/en/).  EODA is a cutting edge startup . recently they launched a few innovative products that made me sit up and pay attention. In this interview, Heiko Miertzsch , the founder of eoda talks on the startup journey and the vision of analytics.

eoda_logo
DecisionStats (DS)- Describe the journey of your startup eoda. What made you choose R as the platform for your software and training. Name a few turning points and milestones in your corporate journey

Heiko Miertzsch (HM)- eoda was founded in 2010 by Oliver and me. We both have a strong background in analytics and Information Technology industry. So we observed the market a while before starting the business. We saw two trends: First, a lot of new Technologies and Tools for data analysis appeared and second Open Source seemed to become more and more important for several reasons. Just to name one the easiness to share experience and code in a broad and professional community. Disruptive forces seem to change the market and we just don’t want back the wrong horse.

From the beginning on we tested R and we were enthusiastic. We started choosing R for our projects, software development, services and build up a training program for R. We already believed in 2010 that R has a successful future. It was more flexible than other statistic languages, more powerful in respect of the functionality, you could integrate it in an existing environment and much more.

DS- You make both Software products and services. What are the challenges in marketing both?

HM- We even do more: We provide consulting, training, individual software, customizing software and services. It is pure fun for us to go to our customers and say “hey, we can help you solving your analytical problems, no matter what kind of service you want to buy, what kind of infrastructure you use, if you want to learn about forest trees or buy a SaaS solution to predict your customers revenues”. In a certain way we don’t see barriers between these delivery models because we use analytics as our basis. First of all, we focus on the analytical problem of our customers and then we find the ideal solution together with the customer.

DS- Describe your software tableR. How does it work, what is the pricing and what is the benefit to user. Name a few real life examples if available for usage.

HM- Today the process of data collection, analysis and presenting the results is characterized by the use of a heterogeneous software environment with many tools, file formats and manual processing steps. tableR supports the entire process from design a questionnaire, share a structured format with the CAXI software, import the data and doing the analysis and plot the table report with only one single solution. The base report comes with just one click and if you want to go more into detail you can enhance your analysis with your own R code.

tableR is used in a closed beta at the moment and the open beta will in start next weeks.

(It is available at http://www.eoda.de/en/tableR.html)

DS- Describe your software translateR (http://www.eoda.de/en/translateR.html) . How does it work, what is the pricing and what is the benefit to user. Name a few real life examples if available for usage.

HM- Many companies realized the advantages of the open source programming language R. translateR allows a fast and inexpensive migration to R – currently from SPSS code.

The manual migration of complex SPSS® scripts has always been tedious and error-prone. translateR will help here and the task of translating by hand becomes a thing of the past. The beta test of translateR will also start in the next weeks.

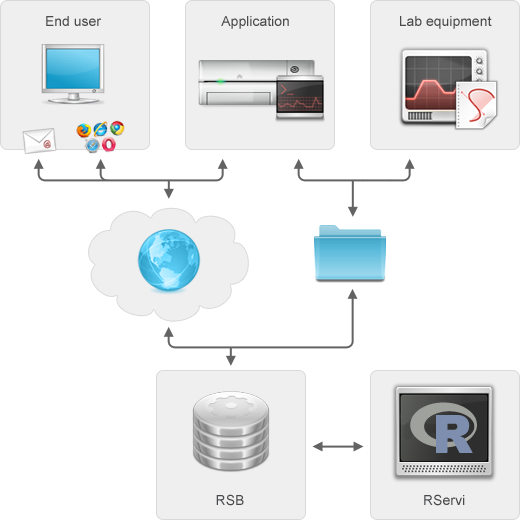
DS- How do you think we can use R on the cloud for better analytics?

HM- Well, R seems to bring together the best “Data Scientists” of the world with all their different focuses on different methods, vertical knowledge, technical experience and more. The cloud is a great workplace: It holds the data – a lot of data and it offers a technical platform with computing power. If it succeeds to bring these two aspects together, we could provide a lot of knowledge to solve a lot of problems – with individual and global impact.

DS- What advantages and disadvantages does working on the cloud give to a R user?

HM- In terms of R I don’t see other aspects than in using the cloud in general.

DS- Startup life can be hectic – what do you do to relax.

HM- Oliver and I have both families, so eoda is our time to relax – just fun. I guess we do the same typical things like others, Oliver plays soccer and goes running. I like any kind of endurance sports and go climbing, the first to give the thoughtless space the second to train to focus on a concrete target.

About-

translateR is the new service from German based R specialist eoda, which helps users to translate SPSS® Code to R automatically. translateR is developed in cooperation with the University of Kassel and financially supported by the LOEWE-program of the state Hessen. translateR will be available as a cloud service and as a desktop application.

eoda offers consulting, software development and training for analytical and statistical questions. eoda is focused on R and specializes in integrating R into existing software environments.


Interview Tobias Verbeke Open Analytics #rstats #startups

Here is an interview with Tobias Verbeke, Managing Director of Open Analytics (http://www.openanalytics.eu/). Open Analytics is doing cutting edge work with R in the enterprise software space.
Ajay- Describe your career journey including your involvement with Open Source and R. What things enticed you to try R?

Tobias- I discovered the free software foundation while still at university and spent wonderful evenings configuring my GNU/Linux system and reading RMS essays. For the statistics classes proprietary software was proposed and that was obviously not an option, so I started tackling all problems using R which was at the time (around 2000) still an underdog together with pspp (a command-line SPSS clone) and xlispstat. From that moment on, I decided that R was the hammer and all problems to be solved were nails 😉 In my early career I worked as a statistician / data miner for a general consulting company which gave me the opportunity to bring R into Fortune 500 companies and learn what was needed to support its use in an enterprise context. In 2008 I founded Open Analytics to turn these lessons into practice and we started building tools to support the data analysis process using R. The first big project was Architect, which started as an eclipse-based R IDE, but more and more evolves into an IDE for data science more generally. In parallel we started working on infrastructure to automate R-based analyses and to plug R (and therefore statistical logic) into larger business processes and soon we had a tool suite to cover the needs of industry.

Ajay- What is RSB all about- what needs does it satisfy- who can use it ?

Tobias– RSB stands for the R Service Bus and is communication middleware and a work manager for R jobs. It allows to trigger and receive results from R jobs using a plethora of protocols such as RESTful web services, e-mail protocols, sftp, folder polling etc. The idea is to enable people to push a button (or software to make a request) and have them receive automated R based analysis results or reports for their data.

Ajay- What is your vision and what have been the challenges and learning so far in the project

Tobias– RSB started when automating toxicological analyses in pharmaceutical industry in collaboration with Philippe Lamote. Together with David Dossot, an exceptional software architect in Vancouver, we decided to cleanly separate concerns, namely to separate the integration layer (RSB) from the statistical layer (R) and, likewise, from the application layer. As a result any arbitrary R code can be run via RSB and any client application can interact with RSB as long as it can talk one of the many supported protocols. This fundamental design principle makes us different from alternative solutions where statistical logic and integration logic are always somehow interwoven, which results in maintenance and integration headaches. One of the challenges has been to keep focus on the core task of automating statistical analyses and not deviating into features that would turn RSB into a tool for interaction with an R session, which deserves an entirely different approach. Rservice-diagram

Ajay- Computing seems to be moving to an heterogeneous cloud , server and desktop model. What do you think about the R and Cloud Computing- current and future

Tobias– From a freedom perspective, cloud computing and the SaaS model is often a step backwards, but in our own practice we obviously follow our customers’ needs and offer RSB hosting from our data centers as well. Also, our other products e.g. the R IDE Architect are ready for the cloud and use on servers via Architect Server. As far as R itself concerns in relation to cloud computing, I foresee its use to increase. At Open Analytics we see an increasing demand for R-based statistical engines that power web applications living in the cloud.

Ajay- You recently released RSB version 6. What are all the new features. What is the planned roadmap going forward

Tobias– RSB 6.0 is all about large-scale production environments and strong security. It kicked off on a project where RSB was responsible for spitting 8500 predictions per second. Such large-scale production deployments of RSB motivated the development of a series of features. First of all RSB was made lightning fast: we achieved a full round trip from REST call to prediction in 7 ms on the mentioned use case. In order to allow for high throughput, RSB also gained a synchronous API (RSB 5.0 had an asynchronous API only). Another new feature is the availability of client-side connection pooling to the pool manager of R processes that are read to serve RSB. Besides speed, this type of production environments also need monitoring and resilience in case of issues. For the monitoring, we made sure that everything is in place for monitoring and remotely querying not only the RSB application itself, but also the pool of R processes managed by RServi.


(Note from Ajay- RJ is an open source library providing tools and interfaces to integrate R in Java applications. RJ project also provides a pool for R engines, easy to setup and manage by a web-interface or JMX. One or multiple client can borrow the R engines (called RServi)  see http://www.walware.de/it/rj/ and https://github.com/walware/rj-servi)
Also, we now allow to define node validation strategies to be able to check that R nodes are still functioning properly. If not, the nodes are killed and new nodes are started and added to the pool. In terms of security, we are now able to cover a very wide spectrum of authentication and authorization. We have machines up and running using openid, basic http authentication, LDAP, SSL client certificates etc. to serve everyone from the individual user who is happy with openid authentication for his RSB app to large investment banks who have very strong security requirements. The next step is to provide tighter integration with Architect, such that people can release new RSB applications without leaving the IDE.

Ajay- How does the startup ecosystem in Europe compare with say the SF Bay Area, What are some of the good things and not so great things

Tobias– I do not feel qualified to answer such a question, since I founded a single company in Antwerp, Belgium. That being said, Belgium is great! 🙂

Ajay- How can we popularize STEM education using MooCs , training etc

Tobias– Free software. Free as in beer and as in free speech!

Ajay- Describe the open source ecosystem in general and R ecosystem in  particular for Europe. How does it compare with other locations in your opinion

Tobias– Open source is probably a global ecosystem and crosses oceans very easily. Dries Buytaert started off Drupal in Belgium and now operates from the US interacting with a global community. From a business perspective, there are as many open source models as there are open source companies. I noticed that the major US R companies (Revolution Analytics and RStudio) cherished the open source philosophy initially, but drifted both into models combining open source and proprietary components. At Open Analytics, there are only open source products and enterprise customers have access to exactly the same functionality as a student may have in a developing country. That being said, I don’t believe this is a matter of geography, but has to do more with the origins and different strategies of the companies.

Ajay- What do you do for work life balance and de stressing when not shipping  code.

Tobias- In a previous life the athletics track helped keeping hands off the keyboard. Currently, my children find very effective ways to achieve similar goals

About-

OpenAnalytics is a consulting company specialized in statistical computing using open technologies. You can read more on it at http://www.openanalytics.eu

How cheap is cloud computing anyway?

So I wanted to really find out how cheap the cloud was- but I got confused by the 23 kinds of instances than Amazon has http://aws.amazon.com/ec2/pricing/ and 15 kinds of instances at https://developers.google.com/compute/pricing.

or whether there is any price collusion between them 😉

Now Amazon has spot pricing so I can bid for prices as well (http://aws.amazon.com/ec2/purchasing-options/spot-instances/ ) and upto 60% off for reserved instances (http://aws.amazon.com/ec2/purchasing-options/reserved-instances/) but charges $2 for dedicated instances (which are not dedicated but pay as you go)

Dedicated Per Region Fee

  • $2 per hour – An additional fee is charged once per hour in which at least one Dedicated Instance of any type is running in a Region.

Google has sustained discounts ( will not offer Windows on the cloud though!)

The table below describes the discount at each usage level. These discounts apply for all instance types.

Usage Level (% of month) % at which incremental is charged Example incremental rate (USD/per hour) for an n1-standard-1 instance
0%-25% 100% of base rate $0.07
25%-50% 80% of base rate $0.056
50%-75% 60% of base rate $0.042
75%-100% 40% of base rate $0.028


Anyways- I tried to create this simple table to help me with it- after all  hard disks are cheap- it is memory I want on the cloud !

Or maybe I am wrong and the cloud is not so cheap- or its just too complicated for someone to build a pricing calculator that can take in prices from all providers (Amazon, Azure, Google Compute) and show us the money!

vCPU RAM(GiB) $ per Hour Type -Linux Usage Provider Notes
t2.micro 1 1 $0.01 General Purpose – Current Generation Amazon (North Virginia) Amazon also has spot instances
t2.small 1 2 $0.03 General Purpose – Current Generation Amazon (North Virginia) that can lower prices
t2.medium 2 4 $0.05 General Purpose – Current Generation Amazon (North Virginia)
m3.medium 1 3.75 $0.07 General Purpose – Current Generation Amazon (North Virginia)
m3.large 2 7.5 $0.14 General Purpose – Current Generation Amazon (North Virginia)
m3.xlarge 4 15 $0.28 General Purpose – Current Generation Amazon (North Virginia)
m3.2xlarge 8 30 $0.56 General Purpose – Current Generation Amazon (North Virginia)
c3.large 2 3.75 $0.11 Compute Optimized – Current Generation Amazon (North Virginia)
c3.xlarge 4 7.5 $0.21 Compute Optimized – Current Generation Amazon (North Virginia)
c3.2xlarge 8 15 $0.42 Compute Optimized – Current Generation Amazon (North Virginia)
c3.4xlarge 16 30 $0.84 Compute Optimized – Current Generation Amazon (North Virginia)
c3.8xlarge 32 60 $1.68 Compute Optimized – Current Generation Amazon (North Virginia)
g2.2xlarge 8 15 $0.65 GPU Instances – Current Generation Amazon (North Virginia)
r3.large 2 15 $0.18 Memory Optimized – Current Generation Amazon (North Virginia)
r3.xlarge 4 30.5 $0.35 Memory Optimized – Current Generation Amazon (North Virginia)
r3.2xlarge 8 61 $0.70 Memory Optimized – Current Generation Amazon (North Virginia)
r3.4xlarge 16 122 $1.40 Memory Optimized – Current Generation Amazon (North Virginia)
r3.8xlarge 32 244 $2.80 Memory Optimized – Current Generation Amazon (North Virginia)
i2.xlarge 4 30.5 $0.85 Storage Optimized – Current Generation Amazon (North Virginia)
i2.2xlarge 8 61 $1.71 Storage Optimized – Current Generation Amazon (North Virginia)
i2.4xlarge 16 122 $3.41 Storage Optimized – Current Generation Amazon (North Virginia)
i2.8xlarge 32 244 $6.82 Storage Optimized – Current Generation Amazon (North Virginia)
hs1.8xlarge 16 117 $4.60 Storage Optimized – Current Generation Amazon (North Virginia)
n1-standard-1 1 3.75 $0.07 Standard Google -US Google charges per minute
n1-standard-2 2 7.5 $0.14 Standard Google -US of usage (subject to minimum of 10 minutes)
n1-standard-4 4 15 $0.28 Standard Google -US
n1-standard-8 8 30 $0.56 Standard Google -US
n1-standard-16 16 60 $1.12 Standard Google -US
n1-highmem-2 2 13 $0.16 High Memory Google -US
n1-highmem-4 4 26 $0.33 High Memory Google -US
n1-highmem-8 8 52 $0.66 High Memory Google -US
n1-highmem-16 16 104 $1.31 High Memory Google -US
n1-highcpu-2 2 1.8 $0.09 High CPU Google -US
n1-highcpu-4 4 3.6 $0.18 High CPU Google -US
n1-highcpu-8 8 7.2 $0.35 High CPU Google -US
n1-highcpu-16 16 14.4 $0.70 High CPU Google -US
f1-micro 1 0.6 $0.01 Shared Core Google -US
g1-small 1 1.7 $0.04 Shared Core Google -US

Using Windows Azure Machine Learning as a service with R #rstats

A Brief Tutorial I wrote by playing with the software at manage.windowsazure.com

Interview Louis Bajuk-Yorgan TIBCO Enterprise Runtime for R (TERR) #rstats

Here is an interview with Louis Bajuk-Yorgan, from TIBCO.  TIBCO which was the leading commercial vendor to S Plus, the precursor of the R language makes a commercial enterprise version of R called TIBCO Enterprise Runtime for R (TERR). Louis also presented recently at User2014 http://user2014.stat.ucla.edu/abstracts/talks/54_Bajuk-Yorgan.pdf

09b7eb1

DecisionStats(DS)- How is TERR different from Revolution Analytics or Oracle R. How is it similar.

Louis Bajuk-Yorgan (Lou)– TERR is unique, in that it is the only commercially-developed alternative R interpreter. Unlike other vendors, who modify and extend the open source R engine, we developed TERR from the ground up, leveraging our 20+ years of experience with the closely-related S-PLUS engine.
Because of this, we were able to architect TERR to be faster, more scalable, and handle memory much more efficiently than the open source R engine. Other vendors are constrained by the limitations of the open source R engine, especially around memory management.
Another important difference is that TERR can be licensed to customers and partners for tight integration into their software, which delivers a better experience for their customers. Other vendors typically integrate loosely with open source R, keeping R at arm’s length to protect their IP from the risk of contamination by R’s GPL license. They often force customers to download, install and configure R separately, making for a much more difficult customer experience.
Finally, TIBCO provides full support for the TERR engine, giving large enterprise customers the confidence to use it in their production environments. TERR is integrated in several TIBCO products, including Spotfire and Streambase, enabling customers to take models developed in TERR and quickly integrate them into BI and real-time applications.

DS- How much of R is TERR compatible with?

Lou- We regularly test TERR with a wide variety of R packages, and extend TERR to greater R coverage  over time. We are currently compatible with ~1800 CRAN packages, as well as many bioconductor packages. The full list of compatible CRAN packages is available at the TERR Community site at tibcommunity.com.

DS- Describe Tibco Cloud Compute Grid, What are it’s applications for data science.

Lou- Tibco Cloud Compute Grid leverages the Tibco Gridserver architecture, which has been used by major Wall Street firms to run massively-parallel applications across tens of thousands of individual nodes. TIBCO CCG brings this robust platform to the cloud, enabling anyone to run massively-parallel jobs on their Amazon EC2 account. The platform is ideal for Big Computation types of jobs, such as Monte Carlo simulation and risk calculations. More information can be found at the TIBCO Cloud Marketplace at https://marketplace.cloud.tibco.com/.

DS-  What advantages does TIBCO’s rich history with the S project give it for the R project.

Lou- Our 20+ years of experience with S-PLUS gave us a unique knowledge of the commercial applications of the S/R language, deep experience with architecting, extending and maintaining a commercial S language engine, strong ties to the R community and a rich trove of algorithms we could apply on developing the TERR engine.

DS-  Describe  some benchmarks of TERR with open source of R.

Lou- While the speed of individual operations will vary, overall TERR is roughly 2-10x faster than open source R when applied to small data sets, but 10-100x  faster when applied to larger data sets. This is because TERR’s efficient memory management enables it to handle larger data more reliably, and stay more linear in performance as data sizes increase.
 TERR

DS-  TERR is not open source. Why is that?

Lou-  While open sourcing TERR is an option we continue to consider, we’ve decided to intially focus our energy and time on building the best S/R language engine possible. Running a successful, vibrant open source project is a significant undertaking to do well, and if we choose to do so, we will invest accordingly.
Instead, for now we’ve decided to make a Developer Editon of TERR freely available, so that the R community at large could still benefit from our work on TERR. The Developer Editon is available at tap.tibco.com.

DS- How is TIBCO a company to work for potential data scientists.

Lou- Great! I’ve have worked in this space for nearly 18 years in large part because I get the opportunity to work with customers in many different industries (such as Life Sciences, Financial Services, Energy, Consumer Packaged Goods, etc),  who are trying to solve valuable and interesting problems.
We have an entire team of data scientists, called the Industry Analytics Group, who work on these sorts of problems for our customers, and we are always looking for more Data Scientists to join that team.

DS-  How is TIBCO giving back to the R Community globally. What are it’s plans on community.

Lou- As mentioned above, we make a free Developers Editon of TERR available. In addition, we’ve been sponsors of useR for several years, we contribute feedback to the R Core team as we develop TERR, and we often open source packages that we develop for TERR to that they can be used with open source R as well.  This has included packages ported from S-PLUS (such as sjdbc) and new packages (such as tibbrConnector).

DS- As a sixth time attendee of UseR, Describe  the evolution of R ecosystem as you have observed it.

Lou- It has been fascinating  to see how the R community has grown and evolved over the years. The useR conference at UCLA this year was the largest ever (700+ attendees), with more commercial sponsors than ever before (including enterprise heavyweights like TIBCO, Teradata and Oracle, smaller analytic vendors like RStudio, Revolution and Alteryx, and new companies like plot.ly). What really struck me, however, was the nature of the attendees. There were far more attendees from commercial companies this year, many of whom were R users. More so than in the past, there were many people who simply wanted to learn about R.
About-
Lou Bajuk-Yorgan leads Predictive Analytics product strategy at TIBCO Spotfire, including the development of the new TIBCO Enterprise Runtime for R. With a background in Physics and Atmospheric Sciences, Lou was a Research Scientist at NASA JPL before focusing on analytics and BI software 16 years ago. An avid cyclist, runner and gamer, Lou frequently speaks and tweets (@LouBajuk) about the importance of Predictive Analytics for the most valuable business challenges.

Interview Jan de Leeuw Founder JSS

Here is an interview with one of the greatest statisticians and educator of this generation, Prof Jan de Leeuw. In this exclusive and free wheeling interview, Prof De Leeuw talks on the evolution of technology, education, statistics and generously shares nuggets of knowledge of interest to present and future statisticians.

1

DecisionStats(DS)- You have described UCLA Dept of Statistics as your magnum opus.Name a couple of turning points in your career which helped in this creation .

Jan de Leeuw (JDL) –From about 1980 until 1987 I was head of the Department of Data Theory at Leiden University. Our work there produced a large number of dissertations which we published using our own publishing company. I also became president of the Psychometric Society in 1987. These developments resulted in an invitation from UCLA to apply for the position of director of the interdepartmental program in social statistics, with a joint appointment in Mathematics and Psychology. I accepted the offer in 1987. The program eventually morphed into the new Department of Statistics in 1998.

DS- Describe your work with Gifi software and non linear multivariate analysis.

JDL- I started working on NLMVA and MDS in 1968, while I was a graduate student researcher in the new Department of Data Theory. Joe Kruskal and Doug Carroll invited me to spend a year at Bells Labs in Murray Hill in 1973-1974. At that time I also started working with Forrest Young and his student Yoshio Takane. This led to the sequence of “alternating least squares” papers, mainly in Psychometrika. After I returned to Leiden we set up a group of young researchers, supported by NWO (the Dutch equivalent of the NSF) and by SPSS, to develop a series of Fortran programs for NLMVA and MDS.
In 1980 the group had grown to about 10-15 people, and we gave a succesful postgraduate course on the “Gifi methods”, which eventually became the 1990 Gifi book. By the time I left Leiden most people in the group had gone on to do other things, although I continued to work in the area with some graduate students from Leiden and Los Angeles. Then around 2010 I worked with Patrick Mair, visiting scholar at UCLA, to produce the R packages smacof, anacor, homals, aspect, and isotone. Also see https://www.youtube.com/watch?v=u733Mf7jX24

DS- You have presided over almost 5 decades of changes in statistics.  Can you describe the effect of changes in computing and statistical languages over the years, and some learning from these changes

JDL- I started in 1968 with PL/I. Card decks had to be flown to Paris to be compiled and executed on the IBM/360 mainframes. Around the same time APL came up and satisfied my personal development needs, although of course APL code was difficult to communicate. It was even difficult to underatand your own code after a week. We had APL symbol balls on the Selectrix typewriters and APL symbols on the character terminals. The basic model was there — you develop in an interpreted language (APL) and then for production you use a compiled language (FORTRAN). Over the years APL was replaced by XLISP and then by R. Fortran was largely replaced by C, I never switched to C++ or Java. We discouraged our students to use SAS or SPSS or MATLAB. UCLA Statistics promoted XLISP-STAT for quite a long time, but eventually we had to give it up. See http://www.stat.ucla.edu/~deleeuw/janspubs/2005/articles/deleeuw_A_05.pdf.

(In 1998 the UCLA Department of Statistics, which had been one of the major users of Lisp-Stat, and one of the main producers of Lisp-Stat code, decided to switch to S/R. This paper discusses why this decision was made, and what the pros and the cons were. )

Of course the WWW came up in the early nineties and we used a lot of CGI and PHP to write instructional software for browsers.

Generally, there has never been an computational environment like R — so integrated with statistical practice and development, and so enormous, accessible and democratic. I must admit I personally still prefer to use R as originally intended: as a convenient wrapper around and command line interface for compiled libraries and code. But it is also great for rapid prototyping, and in that role it has changed the face of statistics.
The fact that you cannot really propose statistical computations without providing R references and in many cases R code has contributed a great deal to reproducibility and open access.

DS- Does Big Data and Cloud Computing , in the era of data deluge require a new focus on creativity in statistics or just better application in industry of statistical computing over naive models
JDL- I am not really active in Big Data and Cloud Computing, mostly because I am more of a developer than a data analyst. That is of course a luxury.
The data deluge has been there for a long time (sensors in the road surface, satellites, weather stations, air pollution monitors, EEG’s, MRI’s) but until fairly recently there were no tools, both in hardware and software, to attack these data sets. Of course big data sets have changed the face of statistics once again, because in the context of big data the emphasis on optimality and precise models becomes laughable. What I see in the area is a lot of computer science, a lot of fads, a lot of ad-hoc work, and not much of a general rational approach. That may be unavoidable.
DS- What is your biggest failure in professional life
JDL- I decided in 1963 to major in psychology, mainly because I wanted to discover big truths about myself. About a year later I discovered that psychology and philosophy do not produce big truths, and that my self was not a very interesting object of study anyway. I switched to physics for a while, and minored in math, but by that time I already had a research assistant job, was developing software, and was not interested any more in going to lectures and doing experiments. In a sense I dropped out. It worked out fairly well, but it sometimes gives rise to imposter syndrome.
DS- If you had to do it all over again, what are the things you would really look forward to doing.

JDL- I really don’t know how to answer this. A life cannot be corrected, repeated, or relived.

DS- What motivates you to start Journal of Statistical software and  push for open access.
JDL- That’s basically in the UserR! 2014 presentation. See http://gifi.stat.ucla.edu/janspubs/2014/notes/deleeuw_mullen_U_14.pdf
DS-  How can we make the departments of Statistics and departments of Computer Science work closely for better industry relevant syllabus especially in data mining, business analytics and statistical computing.
JDL- That’s hard. The cultures are very different — CS is so much more agressive and self-assured, as well as having more powerful tools and better trained students. We have tried joint appointments but they do not work very well. There are some interdisciplinary programs but generally CS dominates and provides the basic keywords such as neural nets, machine learning, data mining, cloud computing and so on. One problem is that in many universities statistics is the department that teaches the introductory statistics courses, and not much more. Statistics is forever struggling to define itself, to fight silly battles about foundations, and to try to control the centrifugal forces that do statistics outside statistics departments.
DS- What are some of the work habits that have helped you be more productive in your writing and research
JDL– Well, if one is not brilliant, one has to be a workaholic. It’s hard on the family. I decided around 1975 that my main calling was to gather and organize groups of reseachers with varying skills and interests — and not to publish as much as possible. That helped.
Jan de Leeuw (born December 19, 1945) is a Dutch statistician, and Distinguished Professor of Statistics and Founding Chair of the Department of Statistics, University of California, Los Angeles. He is known as the founding editor and editor-in-chief of the Journal of Statistical Software, as well as editor-in-chief of the Journal of Multivariate Analysis.