Is Python going to be better than R for Big Data Analytics and Data Science? #rstats #python

Uptil now the R ecosystem of package developers has mostly shrugged away the Big Data question. In   a fascinating insight Hadley Wickham said this in a recent interview- shockingly it mimicks the FUD you know who has been accused of ( source

https://peadarcoyle.wordpress.com/2015/08/02/interview-with-a-data-scientist-hadley-wickham/

5. How do you respond when you hear the phrase ‘big data’? Big data is extremely overhyped and not terribly well defined. Many people think they have big data, when they actually don’t.

I think there are two particularly important transition points:

* From in-memory to disk. If your data fits in memory, it’s small data. And these days you can get 1 TB of ram, so even small data is big!

* From one computer to many computers.

R is a fantastic environment for the rapid exploration of in-memory data, but there’s no elegant way to scale it to much larger datasets. Hadoop works well when you have thousands of computers, but is incredible slow on just one machine. Fortunately, I don’t think one system needs to solve all big data problems.

To me there are three main classes of problem:

1. Big data problems that are actually small data problems, once you have the right subset/sample/summary.

2. Big data problems that are actually lots and lots of small data problems

3. Finally, there are irretrievably big problems where you do need all the data, perhaps because you fitting a complex model. An example of this type of problem is recommender systems

Ajay- One of the reasons of non development of R Big Data packages is- it takes money. The private sector in R ecosystem is a duopoly ( Revolution Analytics ( acquired by Microsoft) and RStudio (created by Microsoft Alum JJ Allaire). Since RStudio actively tries as a company to NOT step into areas Revolution Analytics works in- it has not ventured into Big Data in my opinion for strategic reasons.

Revolution Analytics project on RHadoop is actually just one consultant working on it here https://github.com/RevolutionAnalytics/RHadoop and it has not been updated since six months

We interviewed the creator of R Hadoop here https://decisionstats.com/2014/07/10/interview-antonio-piccolboni-big-data-analytics-rhadoop-rstats/

However Python developers have been trying to actually develop systems for Big Data actively. The Hadoop ecosystem and the Python ecosystem are much more FOSS friendly even in enterprise solutions.

This is where Python is innovating over R in Big Data-

http://blaze.pydata.org/en/latest/

  • Blaze: Translates NumPy/Pandas-like syntax to systems like databases.

    Blaze presents a pleasant and familiar interface to us regardless of what computational solution or database we use. It mediates our interaction with files, data structures, and databases, optimizing and translating our query as appropriate to provide a smooth and interactive session.

  • Odo: Migrates data between formats.

    Odo moves data between formats (CSV, JSON, databases) and locations (local, remote, HDFS) efficiently and robustly with a dead-simple interface by leveraging a sophisticated and extensible network of conversions. http://odo.pydata.org/en/latest/perf.html

    odo takes two arguments, a target and a source for a data transfer.

    >>> from odo import odo
    >>> odo(source, target)  # load source into target 
  • Dask.array: Multi-core / on-disk NumPy arrays

    Dask.arrays provide blocked algorithms on top of NumPy to handle larger-than-memory arrays and to leverage multiple cores. They are a drop-in replacement for a commonly used subset of NumPy algorithms.

  • DyND: In-memory dynamic arrays

    DyND is a dynamic ND-array library like NumPy. It supports variable length strings, ragged arrays, and GPUs. It is a standalone C++ codebase with Python bindings. Generally it is more extensible than NumPy but also less mature.  https://github.com/libdynd/libdynd

    The core DyND developer team consists of Mark Wiebe and Irwin Zaid. Much of the funding that made this project possible came through Continuum Analytics and DARPA-BAA-12-38, part of XDATA.

    LibDyND, a component of the Blaze project, is a C++ library for dynamic, multidimensional arrays. It is inspired by NumPy, the Python array programming library at the core of the scientific Python stack, but tries to address a number of obstacles encountered by some of its users. Examples of this are support for variable-sized string and ragged array types. The library is in a preview development state, and can be thought of as a sandbox where features are being tried and tweaked to gain experience with them.

    C++ is a first-class target of the library, the intent is that all its features should be easily usable in the language. This has many benefits, such as that development within LibDyND using its own components is more natural than in a library designed primarily for embedding in another language.

    This library is being actively developed together with its Python bindings,

http://dask.pydata.org/en/latest/

On a single machine dask increases the scale of comfortable data from fits-in-memory to fits-on-diskby intelligently streaming data from disk and by leveraging all the cores of a modern CPU.

Users interact with dask either by making graphs directly or through the dask collections which provide larger-than-memory counterparts to existing popular libraries:

  • dask.array = numpy + threading
  • dask.bag = map, filter, toolz + multiprocessing
  • dask.dataframe = pandas + threading

Dask primarily targets parallel computations that run on a single machine. It integrates nicely with the existing PyData ecosystem and is trivial to setup and use:

conda install dask
or
pip install dask

https://github.com/cloudera/ibis

When open source fights- closed source wins. When the Jedi fight the Sith Lords will win

So will R people rise to the Big Data challenge or will they bury their heads in sands like an ostrich or a kiwi. Will Python people learn from R design philosophies and try and incorporate more of it without redesigning the wheel

Converting code from one language to another automatically?

How I wish there was some kind of automated conversion tool – that would convert a CRAN R package into a standard Python package which is pip installable

Machine learning for more machine learning anyone?

The Amazing Watson makes Data Science so elementary

I got the email from IBM saying try out Watson, yada yada yada. I was not so sure what to expect. So i uploaded the diamonds dataset from the flagbearer ggplot2 package in R.

Simple benchmark- can IBM Watson data viz beat the best data viz package (ggplot2) in the best statistical language (R)

To my chagrin and humility- here are the results

Interface is awesome

Watson actually asks questions which an experienced Data Scientist would ask

The default data visualization is actually superior but the tabs for customizing appearance needs some work.

STEP 1

Just uploaded the dataset and these were some of the questions asked by Watson to me.

Screenshot from 2015-07-16 00:25:30


Screenshot from 2015-07-16 00:25:07Step 2

Look at how Watson answers one of these questions

Screenshot from 2015-07-16 00:17:40

Screenshot from 2015-07-16 00:16:29

Screenshot from 2015-07-16 00:15:43


Screenshot from 2015-07-16 00:32:49Step 3

I added human input(me) to try and customize it

Screenshot from 2015-07-16 00:33:12


Screenshot from 2015-07-16 00:33:25

SAS for R Users

I recently managed to get a copy of SAS University Edition.  Screenshot from 2015-03-04 19:54:34

1) Here were some problems I had to resolve- The download size is 1.5 gb of a zipped file ( a virtual machine image). Since I have a internet broadband based in India it led to many failed attempts before I could get it. The unzipped file is almost 3.5 gb. You can get the download file here http://www.sas.com/en_us/software/university-edition/download-software.html.

Secondly the hardware needed is 64 bit, so I basically upgraded my Dell Computer. This was a useful upgrade for me anyway.

2) You can get an Internet Download Manager to resume downloading in case your Internet connection has issues downloading a 1.5 gb file in one go. For Linux you can see http://flareget.com/download/

and for Windows http://www.internetdownloadmanager.com/download.html


3) I chose VM Player for Linux because I am much more comfortable with VM Player ( Desktop free version). I got that from here ~200 MB https://my.vmware.com/web/vmware/free#desktop_end_user_computing/vmware_player/6_0

Screenshot from 2015-03-04 19:39:17

4) Finally I installed VM Player and Open an Existing Virtual Machine to boot up SAS University Edition  Screenshot from 2015-03-04 19:43:08


I was able to open the SAS Studio at the IP Address provided.

Screenshot from 2015-03-04 21:52:32

5)


I downloaded a   Dataset from this collection here

https://archive.ics.uci.edu/ml/datasets/Adult


6) Then I uploaded it to within the SAS Studio System

Screenshot from 2015-02-28 17:06:34Screenshot from 2015-03-03 12:29:07

7) Lastly I was able to run some basic commandsScreenshot from 2015-03-03 12:27:48

Screenshot from 2015-03-04 21:54:06

I was really impressed by the enhancements made to the interface, the ability to search command help through a drop down, the color coded editor and of course the case insensitive SAS language (though I am not a fan of the semi colon I loved using Ctrl + / for easy commenting and uncommenting)

  1. For a SAS turned R turned SAS coder- here are some views
  2. SAS has different windows for coding, log and output. R generally has one
  3. SAS is case insensitive while R is case sensitive. This is a blessing especially for variable and dataset names.
  4. SAS deals with Datasets than can be considered the same as Rs Data Frame.
  5. R’s flexibility in data types is not really comparable to SAS as it is quite fast enough.
  6. SAS has a Macro Language for repeatable tasks
  7. SQL is embedded within SAS as Proc SQL and in R through sqldf package
  8. You have to pay for each upgrade in SAS ecosystem. I am not clear on the transparent pricing, which components does what and whether they have a cloud option for renting by the hour. How about one web page that lists product description and price.
  9. SAS University Edition is a OS agnostic tool, for that itself it is quite impressive compared to say Academic Edition of Revolution Analytics.
  10. R is object oriented and uses [] and $ notation for sub objects. SAS is divided into two main parts- data and proc steps, and uses the . notation and var system
  11. SAS language has a few basic procs but many many options.
  12. How good a SAS coder you are often depends on what you can do in data manipulation in SAS Data Step
  13. Graphics is still better in R ggplot. But the SAS speed is thrilling.
  14. RAM is limited in the University Edition to 1 GB but I found that still quite fast. However I can upload only a 10 mb file to the SAS Studio for University Edition which I found reasonable for teaching purposes.


Training in R on the WeekendR in February

I have agreed to teach R on the Weekend. As a change from my usual online trainings these will be in the class. I am collaborating with http://weekendr.in/r-training.html

For an initial price the cost is Rs 5500 (~100 USD) for 8 sessions of 3 hours each in the classroom. This is only for New Delhi, India as of now.

You can review the course here http://weekendr.in/r-training.html

Screenshot from 2015-01-23 13:40:41

Interview Tobias Verbeke Open Analytics #rstats #startups

Here is an interview with Tobias Verbeke, Managing Director of Open Analytics (http://www.openanalytics.eu/). Open Analytics is doing cutting edge work with R in the enterprise software space.
Ajay- Describe your career journey including your involvement with Open Source and R. What things enticed you to try R?

Tobias- I discovered the free software foundation while still at university and spent wonderful evenings configuring my GNU/Linux system and reading RMS essays. For the statistics classes proprietary software was proposed and that was obviously not an option, so I started tackling all problems using R which was at the time (around 2000) still an underdog together with pspp (a command-line SPSS clone) and xlispstat. From that moment on, I decided that R was the hammer and all problems to be solved were nails 😉 In my early career I worked as a statistician / data miner for a general consulting company which gave me the opportunity to bring R into Fortune 500 companies and learn what was needed to support its use in an enterprise context. In 2008 I founded Open Analytics to turn these lessons into practice and we started building tools to support the data analysis process using R. The first big project was Architect, which started as an eclipse-based R IDE, but more and more evolves into an IDE for data science more generally. In parallel we started working on infrastructure to automate R-based analyses and to plug R (and therefore statistical logic) into larger business processes and soon we had a tool suite to cover the needs of industry.

Ajay- What is RSB all about- what needs does it satisfy- who can use it ?

Tobias– RSB stands for the R Service Bus and is communication middleware and a work manager for R jobs. It allows to trigger and receive results from R jobs using a plethora of protocols such as RESTful web services, e-mail protocols, sftp, folder polling etc. The idea is to enable people to push a button (or software to make a request) and have them receive automated R based analysis results or reports for their data.

Ajay- What is your vision and what have been the challenges and learning so far in the project

Tobias– RSB started when automating toxicological analyses in pharmaceutical industry in collaboration with Philippe Lamote. Together with David Dossot, an exceptional software architect in Vancouver, we decided to cleanly separate concerns, namely to separate the integration layer (RSB) from the statistical layer (R) and, likewise, from the application layer. As a result any arbitrary R code can be run via RSB and any client application can interact with RSB as long as it can talk one of the many supported protocols. This fundamental design principle makes us different from alternative solutions where statistical logic and integration logic are always somehow interwoven, which results in maintenance and integration headaches. One of the challenges has been to keep focus on the core task of automating statistical analyses and not deviating into features that would turn RSB into a tool for interaction with an R session, which deserves an entirely different approach. Rservice-diagram

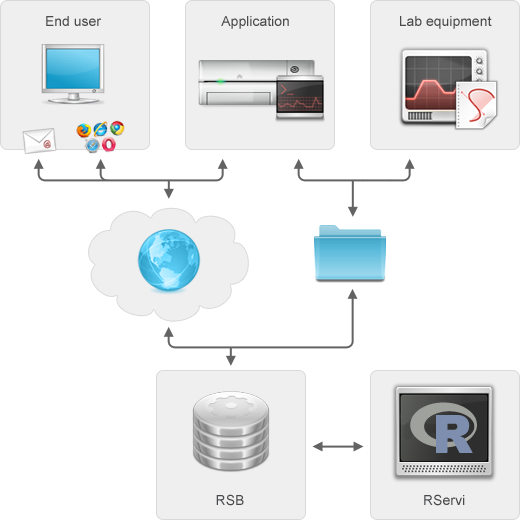
Ajay- Computing seems to be moving to an heterogeneous cloud , server and desktop model. What do you think about the R and Cloud Computing- current and future

Tobias– From a freedom perspective, cloud computing and the SaaS model is often a step backwards, but in our own practice we obviously follow our customers’ needs and offer RSB hosting from our data centers as well. Also, our other products e.g. the R IDE Architect are ready for the cloud and use on servers via Architect Server. As far as R itself concerns in relation to cloud computing, I foresee its use to increase. At Open Analytics we see an increasing demand for R-based statistical engines that power web applications living in the cloud.

Ajay- You recently released RSB version 6. What are all the new features. What is the planned roadmap going forward

Tobias– RSB 6.0 is all about large-scale production environments and strong security. It kicked off on a project where RSB was responsible for spitting 8500 predictions per second. Such large-scale production deployments of RSB motivated the development of a series of features. First of all RSB was made lightning fast: we achieved a full round trip from REST call to prediction in 7 ms on the mentioned use case. In order to allow for high throughput, RSB also gained a synchronous API (RSB 5.0 had an asynchronous API only). Another new feature is the availability of client-side connection pooling to the pool manager of R processes that are read to serve RSB. Besides speed, this type of production environments also need monitoring and resilience in case of issues. For the monitoring, we made sure that everything is in place for monitoring and remotely querying not only the RSB application itself, but also the pool of R processes managed by RServi.


(Note from Ajay- RJ is an open source library providing tools and interfaces to integrate R in Java applications. RJ project also provides a pool for R engines, easy to setup and manage by a web-interface or JMX. One or multiple client can borrow the R engines (called RServi)  see http://www.walware.de/it/rj/ and https://github.com/walware/rj-servi)
Also, we now allow to define node validation strategies to be able to check that R nodes are still functioning properly. If not, the nodes are killed and new nodes are started and added to the pool. In terms of security, we are now able to cover a very wide spectrum of authentication and authorization. We have machines up and running using openid, basic http authentication, LDAP, SSL client certificates etc. to serve everyone from the individual user who is happy with openid authentication for his RSB app to large investment banks who have very strong security requirements. The next step is to provide tighter integration with Architect, such that people can release new RSB applications without leaving the IDE.

Ajay- How does the startup ecosystem in Europe compare with say the SF Bay Area, What are some of the good things and not so great things

Tobias– I do not feel qualified to answer such a question, since I founded a single company in Antwerp, Belgium. That being said, Belgium is great! 🙂

Ajay- How can we popularize STEM education using MooCs , training etc

Tobias– Free software. Free as in beer and as in free speech!

Ajay- Describe the open source ecosystem in general and R ecosystem in  particular for Europe. How does it compare with other locations in your opinion

Tobias– Open source is probably a global ecosystem and crosses oceans very easily. Dries Buytaert started off Drupal in Belgium and now operates from the US interacting with a global community. From a business perspective, there are as many open source models as there are open source companies. I noticed that the major US R companies (Revolution Analytics and RStudio) cherished the open source philosophy initially, but drifted both into models combining open source and proprietary components. At Open Analytics, there are only open source products and enterprise customers have access to exactly the same functionality as a student may have in a developing country. That being said, I don’t believe this is a matter of geography, but has to do more with the origins and different strategies of the companies.

Ajay- What do you do for work life balance and de stressing when not shipping  code.

Tobias- In a previous life the athletics track helped keeping hands off the keyboard. Currently, my children find very effective ways to achieve similar goals

About-

OpenAnalytics is a consulting company specialized in statistical computing using open technologies. You can read more on it at http://www.openanalytics.eu

Using Windows Azure Machine Learning as a service with R #rstats

A Brief Tutorial I wrote by playing with the software at manage.windowsazure.com

Interview Antonio Piccolboni Big Data Analytics RHadoop #rstats

Here is an interview with Antonio Piccolboni , a consultant on big data analytics who has most notably worked on the RHadoop project for Revolution Analytics. Here he tells us about writing better code, and the projects he has been involved with.
ap
 
DecisionStats(DS)- Describe your career journey from being a computer science student to one of the principal creators for RHadoop. What motivated you, what challenges did you overcome. What were the turning points.(You have 3500+ citations. What are most of those citations regarding.)

Antonio (AP)- I completed my undergrad in CS in Italy. I liked research and industry didn’t seem so exciting back then, both because of the lack of a local industry and the Microsoft monopoly, so I entered the PhD program.
After a couple of false starts I focused on bioinformatics. I was very fortunate to get involved in an international collaboration and that paved the way for a move to the United States. I wanted to work in the US as an academic, but for a variety of reasons that didn’t work out.
Instead I briefly joined a new proteomics department in a mass spectrometry company, then a research group doing transcriptomics, also in industry, but largely grant-funded. That’s the period when I accumulated most of my citations.
After several years there, I realized that bioinformatics was not offering the opportunities I was hoping for and that I was missing out on great changes that were happening in the computer industry, in particular Hadoop, so after much deliberation I took the plunge and worked first for a web ratings company and then a social network, where I took the role of what is now called a “data scientist”, using the statistical skills that I acquired during the first part of my career. After taking a year off to work on my own idea I became a free lance and Revolution Analytics one of my clients, and I became involved in RHadoop.
As you can see there were several turning points. It seems to me one needs to seek a balance of determination and flexibility, both mental and financial, to explore different options, while trying to make the most of each experience. Also, be at least aware of what happens outside your specialty area. Finally, the mandatory statistical warning: any generalizations from a single career are questionable at best.


DS-What are the top five things you have learnt for better research productivity and code output in your distinguished career as a computer scientist.
AP-1. Keep your code short. Conciseness in code seems to correlate with a variety of desirable properties, like testability and maintainability. There are several aspects to it and I have a linkblog about this (asceticprogrammer.info). If I had said “simple”, different people would have understood different things, but when you say “short” it’s clear and actionable, albeit not universally accepted.
2. Test your code. Since proving code correct is unfeasible for the vast majority of projects, development is more like an experimental science, where you assemble programs and then corroborate that they have the desired properties via experiments. Testing can have many forms, but no testing is no option.
3. Many seem to think that programming is an abstract activity somewhere in between mathematics and machines. I think a developer’s constituency are people, be them the millions using a social network or the handful using a specialized API. So I try to understand how people interact with my work, what they try to achieve, what their background is and so forth.
4. Programming is a difficult activity, meaning that failure happens even to the best and brightest. Learning to take risk into account and mitigate it is very important.
5. Programs are dynamic artifacts. For each line of code, one may not only ask if it is correct but for how long, as assumptions shift, or how often it will be executed. For a feature, one could wonder how many will use it, and how many additional lines of code will be necessary to maintain it.
6. Bonus statistical suggestion: check the assumptions. Academic statistics has an emphasis on theorems and optimality, bemoaned already by Tukey over sixty years ago. Theorems are great guides for data analysis, but rely on assumptions being met, and, when they are not, consequences can be unpredictable. When you apply the most straightforward, run of the mill test or estimator, you are responsible for checking the assumptions, or otherwise validating the results. “It looked like a normal distribution” won’t cut it when things go wrong.


DS-Describe the RHadoop project- especially the newer plyrmr package. How was the journey to create it.
AP-Hadoop is for data and R is for statistics, to use slogans, so it’s natural to ask the question of how to combine them, and RHadoop is one possible answer.
We selected a few important components of Hadoop and provided an R API. plyrmr is an offshoot of rmr, which is an API to the mapreduce system. While rmr has enjoyed some success, we received feedback that a simplified API would enable even more people to directly access and analyze the data.Again based on feedback we decided to focus on structured data, equivalent to an R data frame. We tried to reduce the role of user-defined functions as parameters to be fed into the API, and when custom functions are needed they are simpler. Grouping and regrouping the data is fundamental to mapreduce. While in rmr the programmer has to process two data structures, one for the data itself and the other describing the grouping, plyrmr uses a very familiar SQL-like “group” function.
Finally, we added a layer of delayed evaluation that allows to perform certain optimizations automatically and encourages reuse by reducing the cost of abstraction. We found enough commonalities with the popular package plyr that we decided to use it as a model, hence the tribute in the name. This lowers the cognitive burden for a typical user.


DS-Hue is an example of making interfaces easier for users to use Hadoop. so are sandboxes and video trainings. How can we make it easier to create better interfaces to software like RHadoop et al
AP- It’s always a trade-off between power and ease of use, however I believe that the ability to express analyses in a repeatable and communicable way is fundamental to science and necessary to business and one of the key elements in the success of R. I haven’t seen a point and click GUI that satisfies these requirements yet, albeit it’s not inconceivable. For me, the most fruitful effort is still on languages and APIs. While some people write their own algorithms, the typical data analyst needs a large repertoire of algorithms that can be applied to specific problems. I see a lot of straightforward adaptations of sequential algorithms or parallel algorithms that work at smaller scales, and I think that’s the wrong direction. Extreme data sizes call for algorithms that work within stricter memory, work and communication constraints than before. On the other hand, the abundance of data, at least in some cases, offers the option of using less powerful or efficient statistics. It’s a trade off whose exploration has just started.


DS-What do you do to maintain work life balance and manage your time
 
AP- I think becoming a freelancer affords me a flexibility that employed work generally lacks. I can put in more or fewer hours depending on competing priorities and can move them around other needs, like being with family in the morning or going for a bike ride while it’s sunny.  I am not sure I manage my time incredibly well, but I try to keep track of where I spend it at least by broad categories, whether I am billing it to a client or not. “If you can not measure it, you can not improve it”, a quote usually attributed to Lord Kelvin.

 
DS- What do you think is the future of R as an enterprise and research software in terms of computing on mobile, desktop, cloud and how do you see things evolve from here

AP- One of the most interesting things that are happening right now is the development of different R interpreters. A successful language needs at least two viable implementations in my opinion. None of the alternatives is ready for prime time at the moment, but work is ongoing. Some implementations are experimental but demonstrate technological advances that can be then incorporated into the other interpreters. The main challenge is transitioning the language and the community to the world of parallel and distributed programming, which is a hardware-imposed priority. RHadoop is meant to help with that, for the largest data sets. Collaboration and publishing on the web is being addressed by many valuable tools and it looks to me the solutions exist already and it’s more a problem of adoption.  For the enterprise, there are companies offering training, consulting, licensing,  centralized deployments,  database APIs, you name it. It would be interesting to see touch interfaces applied to interactive data visualization, but while there is progress on the latter, touch on desktop is limited to a single platform and R doesn’t run on mobile, so I don’t see it as an imminent development.


About
Antonio Piccolboni is an  experienced data scientist (FlowingdataRadar on this emerging role) with industrial and academic backgrounds currently working as an independent consultant on big data analytics. His clients include Revolution Analytics. His other recent work is on social network analysis (hi5) and web analytics (Quantcast). You can contact him via http://piccolboni.info/about.html or his LinkedIn profile