
I got the email from IBM saying try out Watson, yada yada yada. I was not so sure what to expect. So i uploaded the diamonds dataset from the flagbearer ggplot2 package in R.
Simple benchmark- can IBM Watson data viz beat the best data viz package (ggplot2) in the best statistical language (R)
To my chagrin and humility- here are the results
Interface is awesome
Watson actually asks questions which an experienced Data Scientist would ask
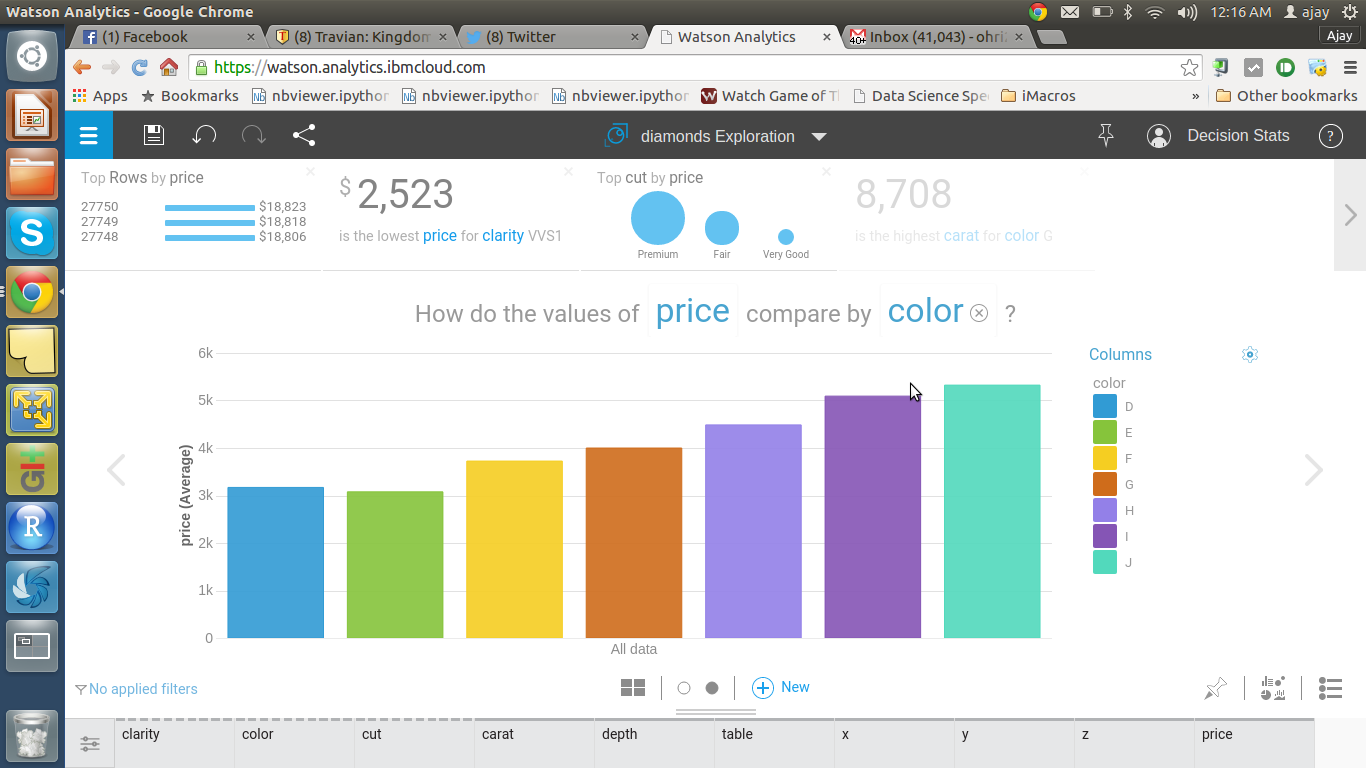
The default data visualization is actually superior but the tabs for customizing appearance needs some work.
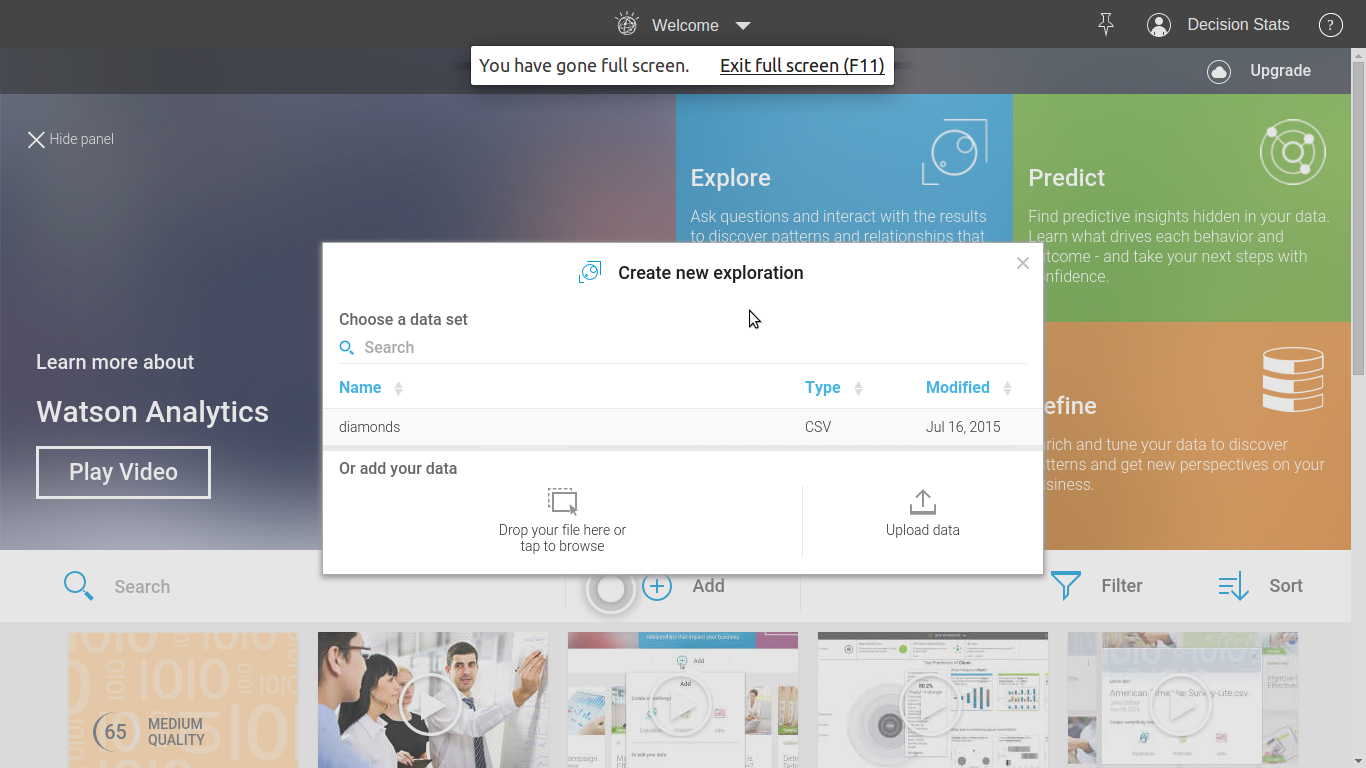
STEP 1
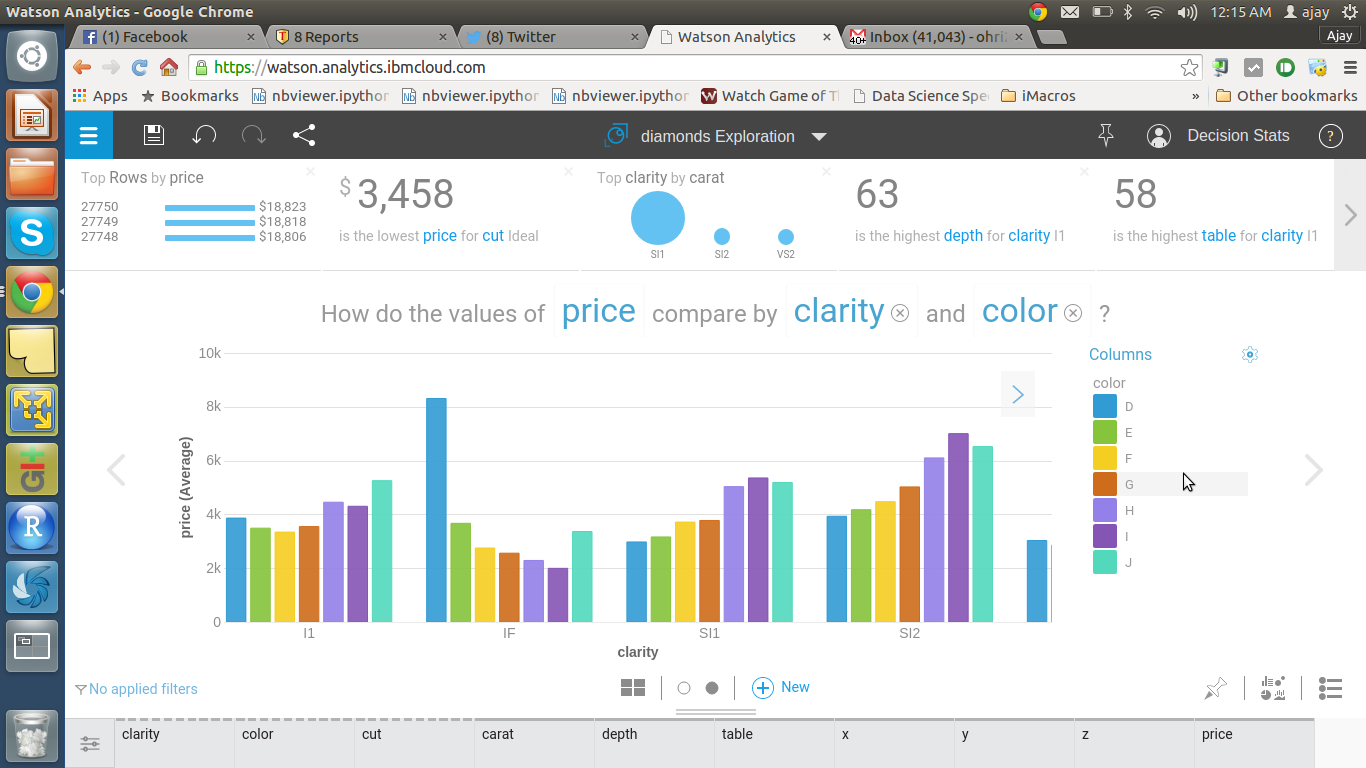
Just uploaded the dataset and these were some of the questions asked by Watson to me.
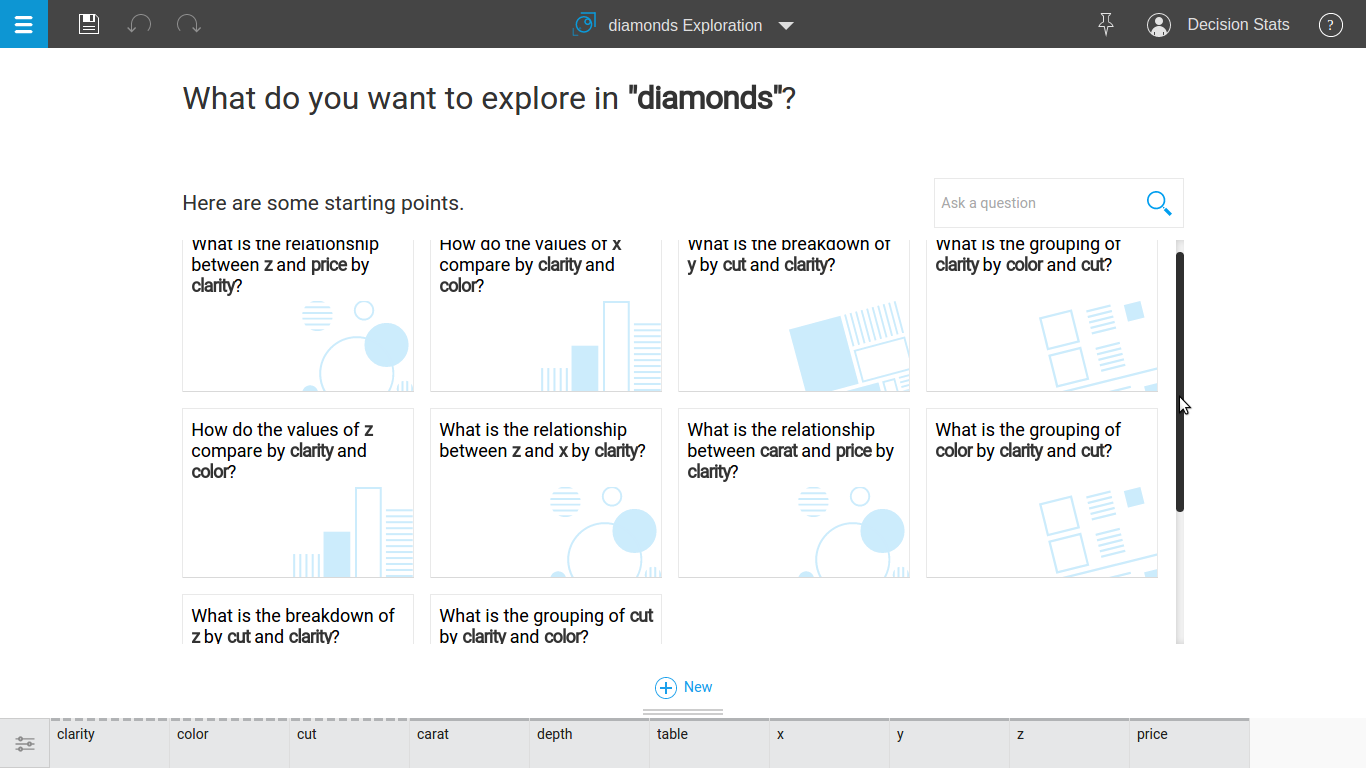 Step 2
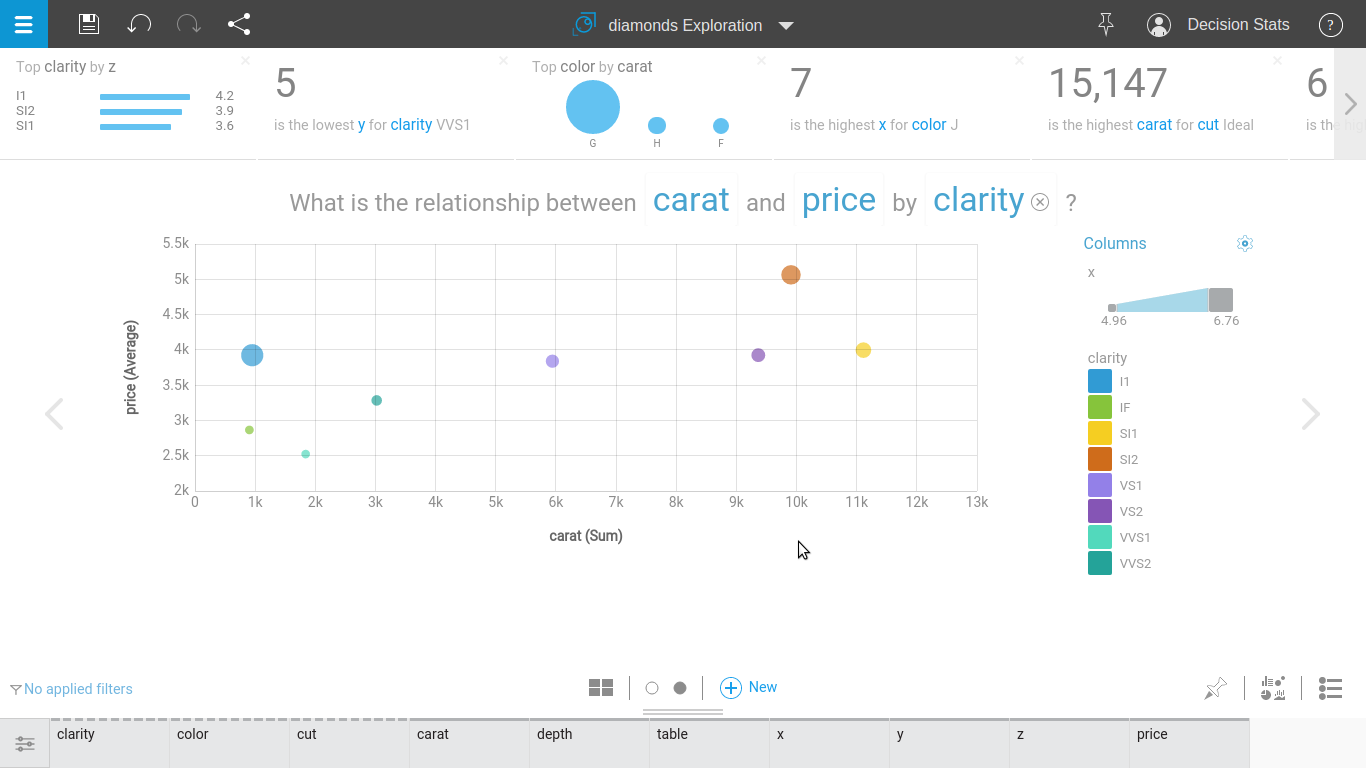
Look at how Watson answers one of these questions
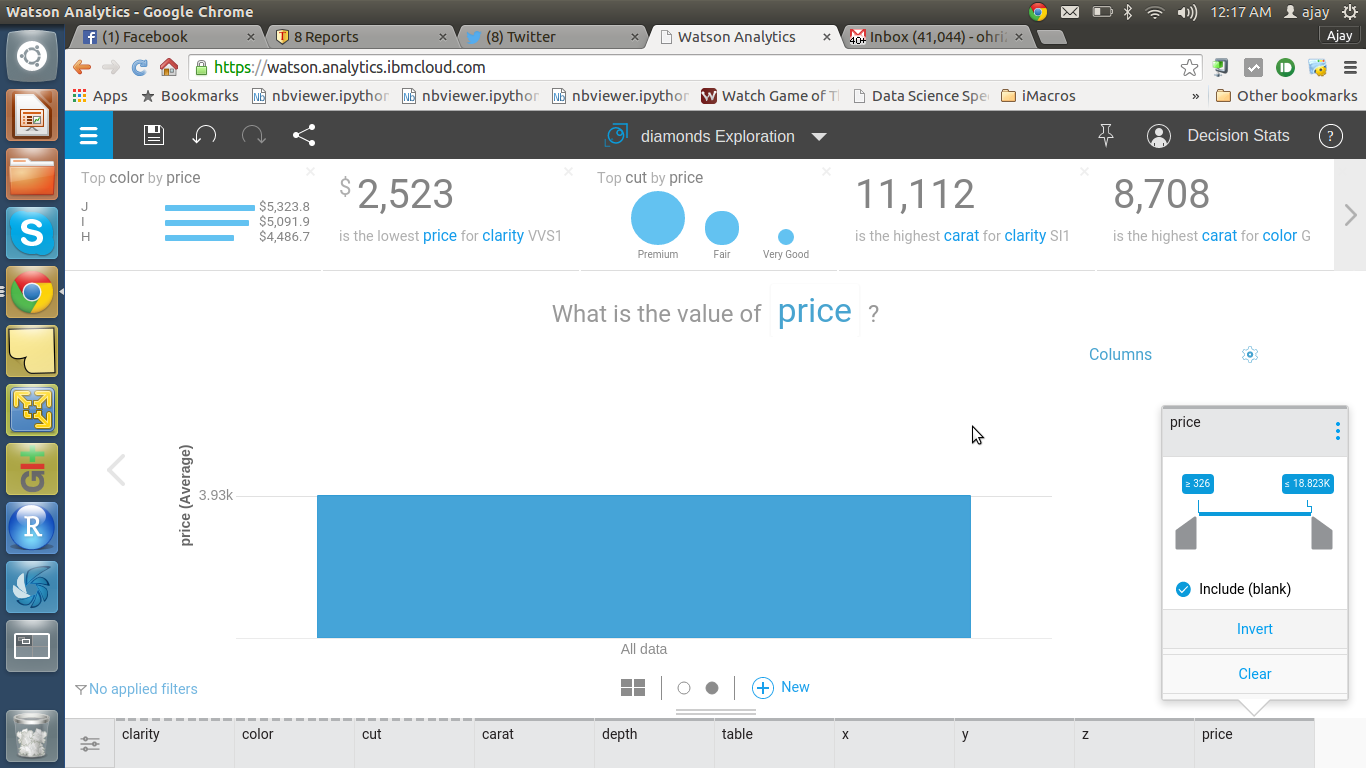
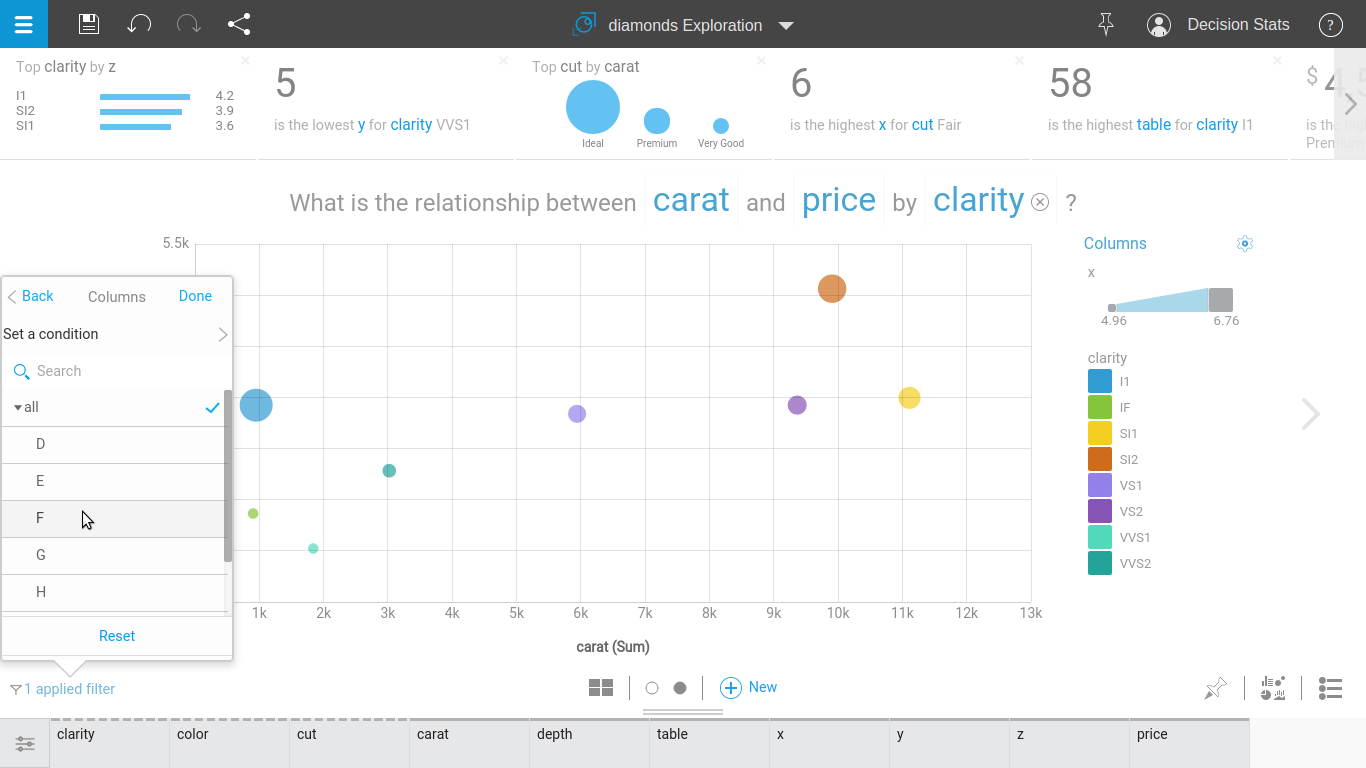
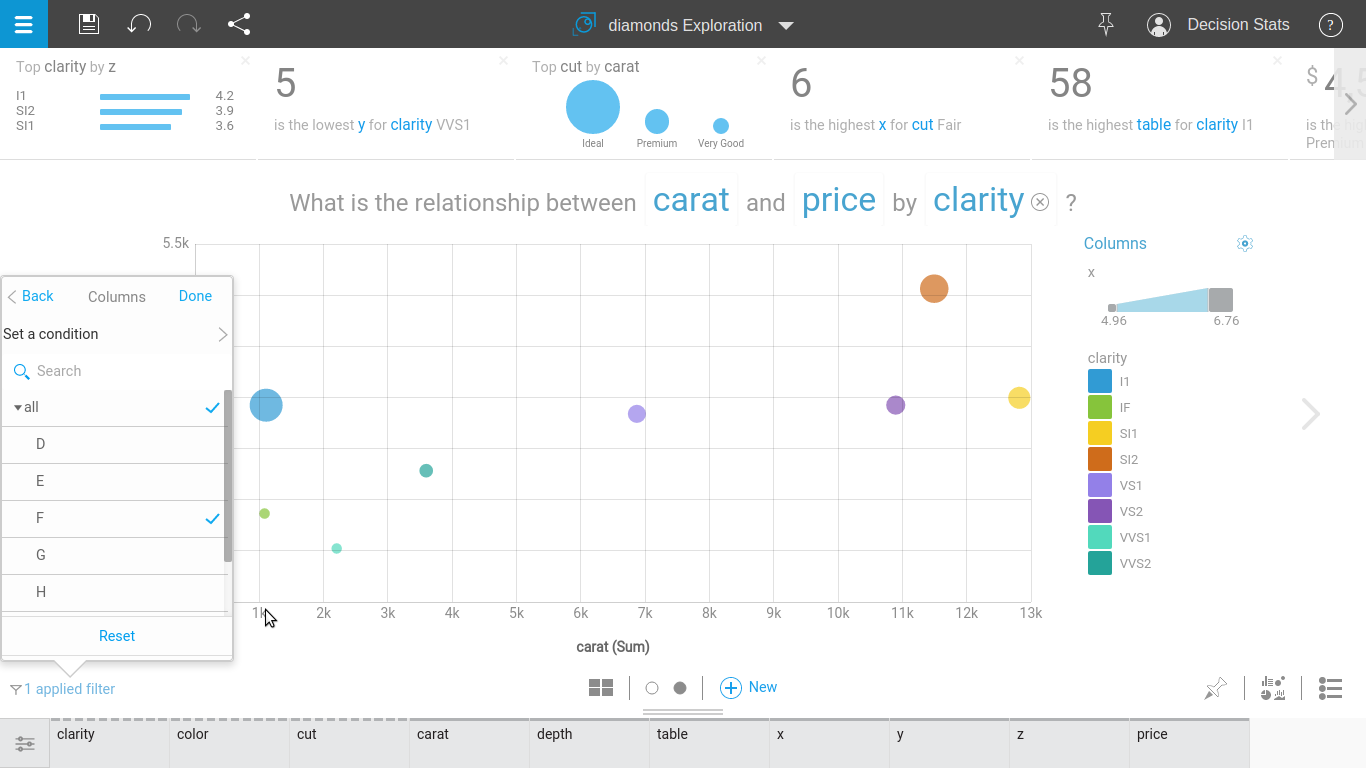
 Step 3
I added human input(me) to try and customize it

Is that the default UI for Watson Analytics. It looks so un-IBM like.