Is Python going to be better than R for Big Data Analytics and Data Science? #rstats #python

Uptil now the R ecosystem of package developers has mostly shrugged away the Big Data question. In   a fascinating insight Hadley Wickham said this in a recent interview- shockingly it mimicks the FUD you know who has been accused of ( source

https://peadarcoyle.wordpress.com/2015/08/02/interview-with-a-data-scientist-hadley-wickham/

5. How do you respond when you hear the phrase ‘big data’? Big data is extremely overhyped and not terribly well defined. Many people think they have big data, when they actually don’t.

I think there are two particularly important transition points:

* From in-memory to disk. If your data fits in memory, it’s small data. And these days you can get 1 TB of ram, so even small data is big!

* From one computer to many computers.

R is a fantastic environment for the rapid exploration of in-memory data, but there’s no elegant way to scale it to much larger datasets. Hadoop works well when you have thousands of computers, but is incredible slow on just one machine. Fortunately, I don’t think one system needs to solve all big data problems.

To me there are three main classes of problem:

1. Big data problems that are actually small data problems, once you have the right subset/sample/summary.

2. Big data problems that are actually lots and lots of small data problems

3. Finally, there are irretrievably big problems where you do need all the data, perhaps because you fitting a complex model. An example of this type of problem is recommender systems

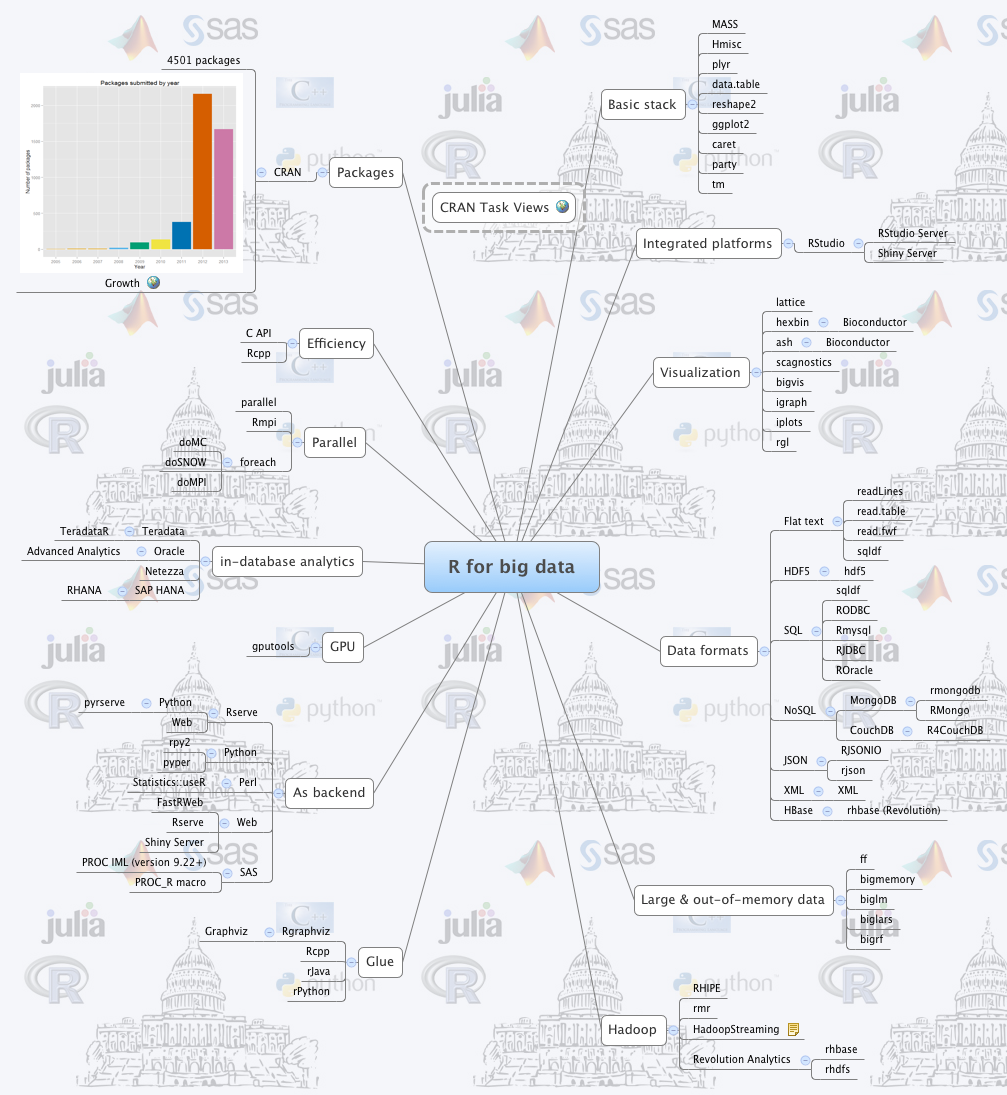
Ajay- One of the reasons of non development of R Big Data packages is- it takes money. The private sector in R ecosystem is a duopoly ( Revolution Analytics ( acquired by Microsoft) and RStudio (created by Microsoft Alum JJ Allaire). Since RStudio actively tries as a company to NOT step into areas Revolution Analytics works in- it has not ventured into Big Data in my opinion for strategic reasons.

Revolution Analytics project on RHadoop is actually just one consultant working on it here https://github.com/RevolutionAnalytics/RHadoop and it has not been updated since six months

We interviewed the creator of R Hadoop here https://decisionstats.com/2014/07/10/interview-antonio-piccolboni-big-data-analytics-rhadoop-rstats/

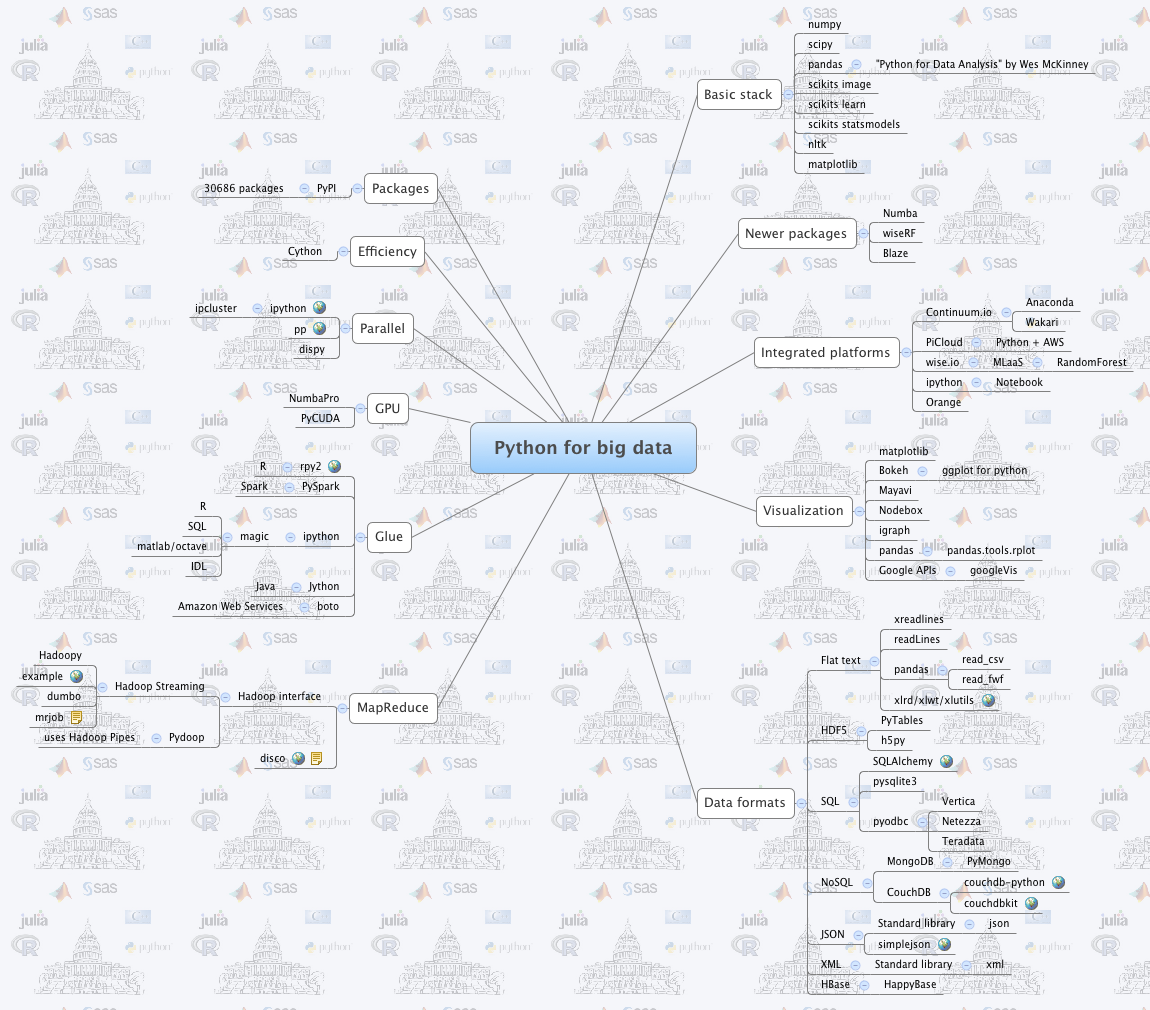
However Python developers have been trying to actually develop systems for Big Data actively. The Hadoop ecosystem and the Python ecosystem are much more FOSS friendly even in enterprise solutions.

This is where Python is innovating over R in Big Data-

http://blaze.pydata.org/en/latest/

  • Blaze: Translates NumPy/Pandas-like syntax to systems like databases.

    Blaze presents a pleasant and familiar interface to us regardless of what computational solution or database we use. It mediates our interaction with files, data structures, and databases, optimizing and translating our query as appropriate to provide a smooth and interactive session.

  • Odo: Migrates data between formats.

    Odo moves data between formats (CSV, JSON, databases) and locations (local, remote, HDFS) efficiently and robustly with a dead-simple interface by leveraging a sophisticated and extensible network of conversions. http://odo.pydata.org/en/latest/perf.html

    odo takes two arguments, a target and a source for a data transfer.

    >>> from odo import odo
    >>> odo(source, target)  # load source into target 
  • Dask.array: Multi-core / on-disk NumPy arrays

    Dask.arrays provide blocked algorithms on top of NumPy to handle larger-than-memory arrays and to leverage multiple cores. They are a drop-in replacement for a commonly used subset of NumPy algorithms.

  • DyND: In-memory dynamic arrays

    DyND is a dynamic ND-array library like NumPy. It supports variable length strings, ragged arrays, and GPUs. It is a standalone C++ codebase with Python bindings. Generally it is more extensible than NumPy but also less mature.  https://github.com/libdynd/libdynd

    The core DyND developer team consists of Mark Wiebe and Irwin Zaid. Much of the funding that made this project possible came through Continuum Analytics and DARPA-BAA-12-38, part of XDATA.

    LibDyND, a component of the Blaze project, is a C++ library for dynamic, multidimensional arrays. It is inspired by NumPy, the Python array programming library at the core of the scientific Python stack, but tries to address a number of obstacles encountered by some of its users. Examples of this are support for variable-sized string and ragged array types. The library is in a preview development state, and can be thought of as a sandbox where features are being tried and tweaked to gain experience with them.

    C++ is a first-class target of the library, the intent is that all its features should be easily usable in the language. This has many benefits, such as that development within LibDyND using its own components is more natural than in a library designed primarily for embedding in another language.

    This library is being actively developed together with its Python bindings,

http://dask.pydata.org/en/latest/

On a single machine dask increases the scale of comfortable data from fits-in-memory to fits-on-diskby intelligently streaming data from disk and by leveraging all the cores of a modern CPU.

Users interact with dask either by making graphs directly or through the dask collections which provide larger-than-memory counterparts to existing popular libraries:

  • dask.array = numpy + threading
  • dask.bag = map, filter, toolz + multiprocessing
  • dask.dataframe = pandas + threading

Dask primarily targets parallel computations that run on a single machine. It integrates nicely with the existing PyData ecosystem and is trivial to setup and use:

conda install dask
or
pip install dask

https://github.com/cloudera/ibis

When open source fights- closed source wins. When the Jedi fight the Sith Lords will win

So will R people rise to the Big Data challenge or will they bury their heads in sands like an ostrich or a kiwi. Will Python people learn from R design philosophies and try and incorporate more of it without redesigning the wheel

Converting code from one language to another automatically?

How I wish there was some kind of automated conversion tool – that would convert a CRAN R package into a standard Python package which is pip installable

Machine learning for more machine learning anyone?

Data Munging using #rstats Part 1 -Understanding Data Quality

This is a series of posts on Data Munging using R.

we will examine the various ways to input data and examine errors in the data input stage. We will accordingly study ways to detect errors and rectify them using the R language. People estimate that almost 60-70% of a project’s time goes in the data input, data quality and data validation stage. By the principle of Garbage-In -Garbage -Out, we believe that an analysis is only as good as the input quality of data. Thus data quality is both an integral part as well as one of the first stages in a project before we move to comprehensive statistical analysis.

Data Quality is an important part of studying data manipulation. How do we define Data Quality?

In this chapter, Data quality is defined as manipulating data in the desired shape, size and format. We further elaborate that as follows-

Data that is useful for analysis without any errors is high quality data.

Data that is problematic for accurate analysis because of any errors is low quality data.

Data Quality errors are defined as deviations from actual data, due to systematic, computing or human mistakes.

Rectifying data quality errors involves the steps of error detection, missing value imputation. It also involves using the feedback from these steps to design better data input mechanisms.

The major types of Data Quality errors are-

Missing Data- This is defined as when data is simply missing. It may be represented by a “. “or a blank space or by special notation like NA (not available) . In R , missing data is represented by NA. Missing data is the easiest to detect but it is tough to rectify since most of the time we deal with data collected in real time in the past time and it is difficult and expensive to replace it with actual data. Some methods of replacing missing data is by imputing or inferring what the missing values could be , by looking at measures of central tendency like median , or mean, or by checking correlation with other variables or data points with better data population or by looking at historic data for a particular sub-set. Accordingly missing values for a particular data variable can be divided into sub sets for imputation by various means (like for different Geographic Values, or Different Time Values)

Invalid Data (too high or too low numeric (and date-time) data, character data in invalid format).

Incorrect Data (due to input errors including invalid or obsolete business rules, human input, low quality OCR scans)

The major causes of Data Quality Errors are-

Human Error (due to input, typing )

Machine Error ( due to invalid input readable eg. like by low resolution scanning device)

Syntax Error ( due to invalid logic or assumptions)

Data Format Error (due to a format that is not readable by software reading in data)

Steps for Diagnosis-

Missing Value Detection (using functions related to is.NA) and Missing Value Imputation

Distribution Analysis (using functions like summary,describe, and visualizations like boxplot, histogram)

Outliers (Bonferroni) Detection and Outlier Capping ( Minimum- Maximum)

Correlation with other variables ( using correlation statistics)

Diagnosis of Data Quality


The following functions in R will help us evaluate the quality of data in our data object.

str– gives structure of object for a data frame including class, dimensions, variable names, variable types, first few observations of each variable)

names– gives variable names.

dim– dimensions of object.

length– gives length of data object.

nrow– gives number of rows of data object.

ncol – gives number of columns of data object.

class– gives data class of object. This can be list, matrix or data.frame or other classes.

We use the famous iris dataset and attach it or load it in our R session using the command

data(iris). We then try out each of the functions given above.

> data(iris)

> str(iris)

data.frame': 150 obs. of 5 variables:

$ Sepal.Length: num 5.1 4.9 4.7 4.6 5 5.4 4.6 5 4.4 4.9 ...

$ Sepal.Width : num 3.5 3 3.2 3.1 3.6 3.9 3.4 3.4 2.9 3.1 ...

$ Petal.Length: num 1.4 1.4 1.3 1.5 1.4 1.7 1.4 1.5 1.4 1.5 ...

$ Petal.Width : num 0.2 0.2 0.2 0.2 0.2 0.4 0.3 0.2 0.2 0.1 ...

$ Species : Factor w/ 3 levels "setosa","versicolor",..: 1 1 1 1 1 1 1 1 1 1 ...

> names(iris)

[1] "Sepal.Length" "Sepal.Width" "Petal.Length" "Petal.Width" "Species"

> dim(iris)

[1] 150 5

> length(iris)

[1] 5

> nrow(iris)

[1] 150

> ncol(iris)

[1] 5

> class(iris)

[1] "data.frame"

It is quite clear that the str function by itself is enough for the first step data quality as it contains all the other parameters.

We now and try and print out a part of the object to check what is stored there. By default we can print the entire object by just writing it’s name. However this may be inconvenient in some cases when there are a large number of rows.

Accordingly we use the head and tail functions to look at the beginning and last rows in a data object.

head – gives first few observations in a data object as specified by parameter in head (objectname, number of rows)

tail -gives last few observations in a data object as specified by parameter in tail (objectname, number of rows)

Here we take the first 7 rows and the last 3 rows of dataset iris. Note that the first column in the output below is the row.number.
> head(iris,7)

Sepal.Length Sepal.Width Petal.Length Petal.Width Species

1 5.1 3.5 1.4 0.2 setosa

2 4.9 3.0 1.4 0.2 setosa

3 4.7 3.2 1.3 0.2 setosa

4 4.6 3.1 1.5 0.2 setosa

5 5.0 3.6 1.4 0.2 setosa

6 5.4 3.9 1.7 0.4 setosa

7 4.6 3.4 1.4 0.3 setosa

> tail(iris,3)

Sepal.Length Sepal.Width Petal.Length Petal.Width Species

148 6.5 3.0 5.2 2.0 virginica

149 6.2 3.4 5.4 2.3 virginica

150 5.9 3.0 5.1 1.8 virginica

We can also pass negative numbers as parameters to head and tail. Here we are trying to take the first and last 7 rows ( or numbers of rows in object -143 rows). Since the object iris has 150 rows , -143 evaluates to 7 in head and tail functions.

> head(iris,-143)

Sepal.Length Sepal.Width Petal.Length Petal.Width Species

1 5.1 3.5 1.4 0.2 setosa

2 4.9 3.0 1.4 0.2 setosa

3 4.7 3.2 1.3 0.2 setosa

4 4.6 3.1 1.5 0.2 setosa

5 5.0 3.6 1.4 0.2 setosa

6 5.4 3.9 1.7 0.4 setosa

7 4.6 3.4 1.4 0.3 setosa

> tail(iris,-143)

Sepal.Length Sepal.Width Petal.Length Petal.Width Species

144 6.8 3.2 5.9 2.3 virginica

145 6.7 3.3 5.7 2.5 virginica

146 6.7 3.0 5.2 2.3 virginica

147 6.3 2.5 5.0 1.9 virginica

148 6.5 3.0 5.2 2.0 virginica

149 6.2 3.4 5.4 2.3 virginica

150 5.9 3.0 5.1 1.8 virginica

1.2 Strings

One of the most common errors in data analytics is mismatch in string variables . String variables also known as character variables are non-numeric text, and even a single misplacement in white space, or upper case, lower case can cause discrepancies in the data. One of the most common types of data for which this error attains criticality is address data and name data.

From the perspective of R, the data “virginica” is a different data (or factor-level) from “ virginica” and from “Virginica”.“1600 Penn Avenue” is a different address from “1600 Pennsylvania Avenue” and from “1600 PA”. This can lead to escalation of costs especially since users of business analytics try and create unique and accurate contact details ( names and addresses). This attains even more importance for running credit checks and financial data, since an inaccurate data mismatch can lead to a wrong credit score to a person, leading to liability of the credit provider.

For changing case we use the functions toupper and tolower

> a=c("ajay","vijay","ravi","rahul","bharat")

> toupper(a)

[1] "AJAY" "VIJAY" "RAVI" "RAHUL" "BHARAT"

> b=c("Jane","JILL","AMY","NaNCY")

> tolower(b)

[1] "jane" "jill" "amy" "nancy"

sub,gsub,grepl


grepl can be used to find a part of a string . For example, in cricket we denote a not out score of 250 runs by a star, .i.e. 250* but denote a score of 250 out as 250. This can create a problem if we are trying to read in data. It will either treat it as character level data, or if we coerce it to return numeric values, it will show the not out scores by missing values.

We want to find all instance of “*” in address field and see if they are not out. grepl returns a logical vector (match or not for each element of x). We will further expand on this example in our Case Study for Cricket Analytics

table2$HSNotOut=grepl("\\*",table2$HS)


We use sub and gsub to substitute parts of string. While the sub function replaces the first occurrence, the gsub function replaces all occurrences of the matching pattern with the parameter supplied.

Here we are trying to replace white space in a sentence. Notice the sub function seems to work better than gsub in this case.

> newstring=" Hello World We are Experts in Learning R"

> sub(" ","",newstring)

[1] "Hello World We are Experts in Learning R"

> gsub(" ","",newstring)

[1] "HelloWorldWeareExpertsinLearningR"

Let us try to convert currency data into numeric data.For the sake of learning we are using a small data object , a list called “money” with three different inputs.

> money=c("$10,000","20000","32,000")

> money

[1] "$10,000" "20000" "32,000"

We replace a comma (used mainly for thousands in currency data) using gsub as shown before.

> money2=gsub(",","",money)

> money2

[1] "$10000" "20000" "32000"

$ indicates the end of a line in regular expressions. \$ is a dollar sign. So we have to use \\$ as an input in the gsub expression.

> money3=gsub("\\$","",money2)

> money3

[1] "10000" "20000" "32000"

At this point we may be satisfied that we have got the format we wanted. However this is an error, as these are still strings- as we find out by running the mean function

> mean(money3)

[1] NA

Warning message:

In mean.default(money3) : argument is not numeric or logical: returning NA

We then use the as operator to convert one data type (character) into another ( numeric).The as operator is generally used in syntax as.outputdataobject.class. Accordingly we will use as.numeric for the conversion.


> money4=as.numeric(money3)

> money4

[1] 10000 20000 32000

> mean(money4)

[1] 20666.67


Please note , we used many intermediate steps to do the multiple steps of data manipulation and used the = sign to assign this to new objects. We can combine two steps into one by putting them within successive brackets. This is illustrated below, when we are trying to convert character data containing (% Percentages) into Numeric data.

> mean(as.numeric(gsub("%","",percentages)))

[1] 35

> percentages

[1] "%20" "%30" "%40" "50"

Note we have found the mean but the original object is not changed.


Do gsub only one variable at a time

Slight problem is suppose there is data like 1,504 – it will be converted to NA instead of 1504.The way to solve this is use the nice gsub function ONLY on that variable. Since the comma is also the most commonly used delimiter , you dont want to replace all the commas, just only the one in that variable.

dataset$Variable2=as.numeric(paste(gsub(“,”,”",dataset$Variable)))


Additional– The function setAs creates methods for the as function to use. This is an advanced usage.


Big Data : Building Big Brother’s Evil Empire

BackgroundThe Russell–Einstein Manifesto was issued in London on July 9, 1955 by Bertrand Russell in the midst of the Cold War. It highlighted the dangers posed by nuclear weapons and called for world leaders to seek peaceful resolutions to international conflict. The signatories included eleven pre-eminent intellectuals and scientists, including Albert Einstein, who signed it just days before his death on April 18, 1955.

It is time Data Scientists most of whom have tacitly accepted that open source and open societies are movements for good, come together and stop enabling Big Brothers in China, India and United States from accumulating lifetimes of information on the citizens of the Internet. Does the 21st Century need a better equipped and enabled United Nations to deal with climate change, weather weapons and cyber warfare. While the myth of Anglo Saxon unipolar world is dead, renegade elements from the military industrial complex from both the West and East threaten the peace with illegal and unethical spying on citizens and civilians.

As data scientists, we enable them , these Governments with the new cyber nukes to collect, sort, aggregate, visualize , huge amounts of text data. I bet the NSA and China use Hadoop and R for purposes that are both repulsive and illegal. Now you can join the gravy train, and earn big money working for one, or the other, or even both.

Or we can come up with a newer version of Russell- Einstein manifesto for Big Data and Internet. The military industrial complex of the East and West has screwed the real planet enough. Why screw the cyber -world of Internet by these weapons of mass collection? Using Python, R, SAS, JMP, or using regression, k means, map reduce/.  Data scientists should have a conscience before they fire their code.

Al

Big Brother is watching you- George Orwell

Big Data is watching you- George  Bush

How to help your government keep the world safe using statistics #rstats #python #sas

Big Data for Big Brother. Now playing. At a computer near you. How to help water the tree of liberty using statistics?

Use R


or

Use Python


LKF2-eVZHWtc-47347

WvfC-nxDTMqJ-97899

or use SAS software

SAS/CIA from the last paragraph of

Click to access ET_CD_Mumbai_Jul12.pdf

Screenshot from 2013-06-09 20:19:01


6 weeks Data Scientist Online Courses #rstats

Hosting a 6 weekend live online certification course on Business Analytics with R starting June 1 at Edureka.Check www.edureka.in/r-for-analytics for more details. Course has been decided to ensure more open data science than current expensive offerings that are tech rather than business oriented but more support and customization than a MOOC This is because many business customers don’t care if it is lapply or ddapply, or command line or GUI, as long  as they get good ROI on time and money spent in shifting to R from other analytics software.

Screenshot from 2013-05-28 07:16:41


Interview Pranay Agrawal Co-Founder Fractal Analytics

Here is an interview with Pranay Agrawal, Executive Vice President- Global Client Development, Fractal Analytics – one of India’s leading analytics services providers and one of the pioneers in analytics services delivery.

Ajay- Describe Fractal Analytics’ journey as a startup to a pioneer in the Predictive Analytics Services industry. What were some of the key turning points in the field of analytics that you have noticed during these times?

IMG_5387

Pranay- In 2000, Fractal Analytics started as a pure-play analytics services company in India with a focus on financial services. Five years later, we spread our operation to the United States and opened new verticals. Today, we have the widest global footprint among analytics providers and have experience handling data and deep understanding of consumer behavior in over 150 counties. We have matured from an analytics service organization to a productized analytics services firm, specializing in consumer goods, retail, financial services, insurance and technology verticals.
We are on the fore-front of a massive inflection point with Big Data Analytics at the center. We have witnessed the transformation of analytics within our clients from a cost center to the most critical division that drives competitive advantage.  Advances are quickly converging in computer science, artificial intelligence, machine learning and game theory, changing the way how analytics is consumed by B2B and B2C companies. Companies that use analytics well are poised to excel in innovation, customer engagement and business performance.

Ajay- What are analytical tools that you use at Fractal Analytics? Are there any trends in analytical software usage that you have observed?

Pranay- We are tools agnostic to serve our clients using whatever platforms they need to ensure they can quickly and effectively operationalize the results we deliver.  We use R, SAS, SPSS, SpotFire, Tableau, Xcelsius, Webfocus, Microstrategy and Qlikview. We are seeing an increase in adoption of open source platform such as R, and specialize tools for dashboard like Tableau/Qlikview, plus an entire spectrum of emerging tools to process manage and extract information from Big Data that support Hadoop and NoSQL data structures

Ajay- What are Fractal Analytics plans for Big Data Analytics?

Pranay- We see our clients being overwhelmed by the increasing complexity of the data. While they are all excited by the possibilities of Big Data, on-the-ground struggle continues to realize its full potential. The analytics paradigm is changing in the context of Big Data. Our solutions focus on how to make it super-simple for our clients combined with analytics sophistication possible with Big Data.
Let’s take our Customer Genomics solution for retailers as an example. Retailers are collecting information about Shopper behaviors through every transaction. Retailers want to transform their business to make it more customer-centric but do not know how to go about it. Our Customer Genomics solution uses advanced machine learning algorithm to label every shopper across more than 80 different dimensions. Retailers use these to identify which products it should deep-discount depending on what price-sensitive shoppers buy. They are transforming the way they plan their assortment, planogram and targeted promotions armed with this intelligence.

We are also building harmonization engines using Concordia to enable real-time update of Customer Genomics based on every direct, social, or shopping transaction. This will further bridge the gap between marketing actions and consumer behavior to drive loyalty, market share and profitability.

Ajay- What are some of the key things that differentiate Fractal Analytics from the rest of the industry? How are you different?

Pranay- We are one of the pioneer pure-play analytics firm with over a decade of experience consulting with Fortune 500 companies. What clients most appreciate about working with us includes:

  • Experience managing structured and unstructured Big Data (volume, variety) with a deep understanding of consumer behavior in more than 150 counties
  • Advanced analytics leveraging supervised machine-learning platforms
  • Proprietary products for example: Concordia for data harmonization, Customer Genomics for consumer insights and personalized marketing, Pincer for pricing optimization, Eavesdrop for social media listening,  Medley for assortment optimization in retail industry and Known Value Item for retail stores
  • Deep industry expertise enables us to leverage cross-industry knowledge to solve a wide range of marketing problems
  • Lowest attrition rates in the industry and very selective hiring process makes us a great place to work

Ajay- What are some of the initiatives that you have taken to ensure employee satisfaction and happiness?

Pranay- We believe happy employees create happy customers. We are building a great place to work by taking a personal interest in grooming people. Our people are highly engaged as evidenced by 33% new hire referrals and the highest Glassdoor ratings in our industry.
We recognize the accomplishments and contributions made through many programs such as:

  1. FractElite – where peers nominate and defend the best of us
  2. Recognition board – where anyone can write a visible thank you
  3. Value cards – where anyone can acknowledge great role model behavior in one or more values
  4. Townhall – a quarterly all hands where we announce anniversaries and FractElite awards, with an open forum to ask questions
  5. Employee engagement surveys – to measure and report out on satisfaction programs
  6. Open access to managers and leadership team – to ensure we understand and appreciate each person’s unique goals and ambitions, coach for high performance, and laud their success

Ajay- How happy are Fractal Analytics customers quantitatively?  What is your retention rate- and what plans do you have for 2013?

Pranay- As consultants, delivering value with great service is critical to our growth, which has nearly doubled in the last year. Most of our clients have been with us for over five years and we are typically considered a strategic partner.
We conduct client satisfaction surveys during and after each project to measure our performance and identify opportunities to serve our clients better. In 2013, we will continue partnering with our clients to define additional process improvements from applying best practice in engagement management to building more advanced analytics and automated services to put high-impact decisions into our clients’ hands faster.

About

Pranay Agrawal -Pranay co-founded Fractal Analytics in 2000 and heads client engagement worldwide. He has a MBA from India Institute of Management (IIM) Ahmedabad, Bachelors in Accounting from Bangalore University, and Certified Financial Risk Manager from GARP. He is is also available online on http://www.linkedin.com/in/pranayfractal

Fractal Analytics is a provider of predictive analytics and decision sciences to financial services, insurance, consumer goods, retail, technology, pharma and telecommunication industries. Fractal Analytics helps companies compete on analytics and in understanding, predicting and influencing consumer behavior. Over 20 fortune 500 financial services, consumer packaged goods, retail and insurance companies partner with Fractal to make better data driven decisions and institutionalize analytics inside their organizations.

Fractal sets up analytical centers of excellence for its clients to tackle tough big data challenges, improve decision management, help understand, predict & influence consumer behavior, increase marketing effectiveness, reduce risk and optimize business results.


Book Review- Predictive Analytics: The Power to Predict Who Will Click, Buy, Lie, or Die

I recently read a review copy of Dr Eric Siegel’s new book Predictive Analytics: The Power to Predict Who Will Click, Buy, Lie, or Die.

(Disclaimer-I have interviewed Eric here in September 2009, and we have been in touch over the years as his Predictive Analytics Conference became a blog partner and then a sponsor here at Decisionstats.com PAWCON also took off, becoming the biggest brand in independent analytics conferences)

So it was with a slight note of optimism that I opened this book, and it has so far exceeded my expectations. This is a very lucidly writtern, well explained book that can help people at all levels for analytics. There is a wealth of information here in a wide variety of business domains, and the beautifully designed book also has great tables, examples, and quotes, cartoons to make a very readable case for predictive analytics. Of course, Eric has some views, he loves ensemble modeling, conversion uplift models, privacy concerns, and his background in academics help explain even technical things very elaborately and in an interesting manner.

And at $14,6 it is quite a steal from Amazon. So buy a copy and read it. I would recommend it for helping build a case for predictive analytics , evangelizing to clients, and even to students in grad school programs. This is how analytics books should be , easy to read, and lucid to remember and practical to execute!