Hack for Change #hackforchange

As part of National Day of Hacking, I took part in the hackathon in New York. Here were some insights

A few teams had come prepared reading the challenge questions. These teams had an advantage on time

Creating something in time was a big challenge ( how do you make a product in a single day)

Hackathon consists of 1) organizer giving challenge questions 2) people coming to venue 3) making teams 4) working together as team 5) presenting results (usually one person per team)

The idea is the most important in how relevant and closely aligned to the questions in hackthon you were. Creativity rules

The next important thing was making a balanced team in which everyone gels well, and have skill sets that are complementary ( one front end, one back end, one data scientist in Python, one person who is good at presentation etc)

The next important thing was not getting intimidated by other teams and working on your team idea till last moment

The presentation should be given to a person who is best at expressing 1) what you did 2) how the solution is innovative 3) how it is relevant and useful to challenge

Lastly have fun hacking. People who have fun hacking generally tend to be better hackers.

Screenshot from 2016-06-10 06:40:04

Basics of Data Handling for R beginners #rstats

  • Assigning Objects

We can create new data objects and variables quite easily within R. We use the = or the → operator to denote assigning an object to it’s name. For the purpose of this article we will use = to assign objectnames and objects. This is very useful when we are doing data manipulation as we can reuse the manipulated data as inputs for other steps in our analysis.


Types of Data Objects in R

  • Lists

A list is simply a collection of data. We create a list using the c operator.

The following code creates a list named numlist from 6 input numeric data

numlist=c(1,2,3,4,5,78)


The following code creates a list named charlist from 6 input character data

charlist=c(“John”,”Peter”,”Simon”,”Paul”,”Francis”)


The following code creates a list named mixlistfrom both numeric and character data.

mixlist=c(1,2,3,4,”R language”,”Ajay”)


  • Matrices

Matrix is a two dimensional collection of data in rows and columns, unlike a list which is basically one dimensional. We can create a matrix using the matrix command while specifying the number of rows by nrow and number of columns by ncol paramter.

In the following code , we create an matrix named ajay and the data is input in 3 rows as specified, but it is entered into first column, then second column , so on.

ajay=matrix(c(1,2,3,4,5,6,12,18,24),nrow=3)

ajay

[,1] [,2] [,3]

[1,] 1 4 12

[2,] 2 5 18

[3,] 3 6 24


However please note the effect of using the byrow=T (TRUE) option. In the following code we create an matrix named ajay and the data is input in 3 rows as specified, but it is entered into first row, then second row , so on.


>ajay=matrix(c(1,2,3,4,5,6,12,18,24),nrow=3,byrow=T)

>ajay

[,1] [,2] [,3]

[1,] 1 2 3

[2,] 4 5 6

[3,] 12 18 24

  • Data Frames

A data frame is a list of variables of the same number of rows with unique row names. The column names are the names of the variables.


How to help your government keep the world safe using statistics #rstats #python #sas

Big Data for Big Brother. Now playing. At a computer near you. How to help water the tree of liberty using statistics?

Use R


or

Use Python


LKF2-eVZHWtc-47347

WvfC-nxDTMqJ-97899

or use SAS software

SAS/CIA from the last paragraph of

Click to access ET_CD_Mumbai_Jul12.pdf

Screenshot from 2013-06-09 20:19:01


Top 10 Regrets on Learning the SAS Language

  1. I didn’t learn the SAS Macro Language enough. SAS Macros are cool, and fast. Ditto for arrays. or ODS.
  2. Not keeping up with the changes in Version 9+. Especially the hash method.(Why name a technique after a recreational drug,  most unfair)
  3. Not studying more statistics theory.
  4. Flunking SAS Certification Twice.
  5. Not making enough money because customers need a solution not a p value.
  6. There is no Proc common sense. There is no Proc Clean the Data.
  7. No Macros to automate the model. Here is dirty data. There is clean model.  Wait till version 16.
  8. Not getting selected by SAS R & D.Not applying to SAS R & D.
  9. Google has better voice recognition for typing notes. No Voice Recognition in SAS langvuage to type syntax.
  10. Enhanced Editor and EG are both idiotic junk pushed by Marketing!

Inspired by true events at

http://www.sascommunity.org/wiki/Category:Bricolage

R 3.0 launched #rstats

The 3.0 Era for R starts today! Changes include  better Big Data support.

Read the NEWS here

  • install.packages() has a new argument quiet to reduce the amount of output shown.
  • New functions cite() and citeNatbib() have been added, to allow generation of in-text citations from "bibentry" objects. A cite() function may be added to bibstyle() environments.
  • merge() works in more cases where the data frames include matrices. (Wish of PR#14974.)
  • sample.int() has some support for n >= 2^31: see its help for the limitations.A different algorithm is used for (n, size, replace = FALSE, prob = NULL) for n > 1e7 and size <= n/2. This is much faster and uses less memory, but does give different results.
  • list.files() (aka dir()) gains a new optional argument no.. which allows to exclude "." and ".." from listings.
  • Profiling via Rprof() now optionally records information at the statement level, not just the function level.
  • available.packages() gains a "license/restricts_use" filter which retains only packages for which installation can proceed solely based on packages which are guaranteed not to restrict use.
  • File ‘share/licenses/licenses.db’ has some clarifications, especially as to which variants of ‘BSD’ and ‘MIT’ is intended and how to apply them to packages. The problematic licence ‘Artistic-1.0’ has been removed.
  • The breaks argument in hist.default() can now be a function that returns the breakpoints to be used (previously it could only return the suggested number of breakpoints).

LONG VECTORS

This section applies only to 64-bit platforms.

  • There is support for vectors longer than 2^31 – 1 elements. This applies to raw, logical, integer, double, complex and character vectors, as well as lists. (Elements of character vectors remain limited to 2^31 – 1 bytes.)
  • Most operations which can sensibly be done with long vectors work: others may return the error ‘long vectors not supported yet’. Most of these are because they explicitly work with integer indices (e.g. anyDuplicated() and match()) or because other limits (e.g. of character strings or matrix dimensions) would be exceeded or the operations would be extremely slow.
  • length() returns a double for long vectors, and lengths can be set to 2^31 or more by the replacement function with a double value.
  • Most aspects of indexing are available. Generally double-valued indices can be used to access elements beyond 2^31 – 1.
  • There is some support for matrices and arrays with each dimension less than 2^31 but total number of elements more than that. Only some aspects of matrix algebra work for such matrices, often taking a very long time. In other cases the underlying Fortran code has an unstated restriction (as was found for complex svd()).
  • dist() can produce dissimilarity objects for more than 65536 rows (but for example hclust() cannot process such objects).
  • serialize() to a raw vector is unlimited in size (except by resources).
  • The C-level function R_alloc can now allocate 2^35 or more bytes.
  • agrep() and grep() will return double vectors of indices for long vector inputs.
  • Many calls to .C() have been replaced by .Call() to allow long vectors to be supported (now or in the future). Regrettably several packages had copied the non-API .C() calls and so failed.
  • .C() and .Fortran() do not accept long vector inputs. This is a precaution as it is very unlikely that existing code will have been written to handle long vectors (and the R wrappers often assume that length(x) is an integer).
  • Most of the methods for sort() work for long vectors.
  • rank(), sort.list() and order() support long vectors (slowly except for radix sorting).
  • sample() can do uniform sampling from a long vector.

PERFORMANCE IMPROVEMENTS

  • More use has been made of R objects representing registered entry points, which is more efficient as the address is provided by the loader once only when the package is loaded.

    This has been done for packages base, methods, splines and tcltk: it was already in place for the other standard packages.

    Since these entry points are always accessed by the R entry points they do not need to be in the load table which can be substantially smaller and hence searched faster. This does mean that .C / .Fortran / .Call calls copied from earlier versions of R may no longer work – but they were never part of the API.

  • Many .Call() calls in package base have been migrated to .Internal() calls.
  • solve() makes fewer copies, especially when b is a vector rather than a matrix.
  • eigen() makes fewer copies if the input has dimnames.
  • Most of the linear algebra functions make fewer copies when the input(s) are not double (e.g. integer or logical).
  • A foreign function call (.C() etc) in a package without a PACKAGE argument will only look in the first DLL specified in the ‘NAMESPACE’ file of the package rather than searching all loaded DLLs. A few packages needed PACKAGE arguments added.
  • The @<- operator is now implemented as a primitive, which should reduce some copying of objects when used. Note that the operator object must now be in package base: do not try to import it explicitly from package methods.

SIGNIFICANT USER-VISIBLE CHANGES

  • Packages need to be (re-)installed under this version (3.0.0) of R.
  • There is a subtle change in behaviour for numeric index values 2^31 and larger. These never used to be legitimate and so were treated as NA, sometimes with a warning. They are now legal for long vectors so there is no longer a warning, and x[2^31] <- y will now extend the vector on a 64-bit platform and give an error on a 32-bit one.
  • It is now possible for 64-bit builds to allocate amounts of memory limited only by the OS. It may be wise to use OS facilities (e.g. ulimit in a bash shell, limit in csh), to set limits on overall memory consumption of an R process, particularly in a multi-user environment. A number of packages need a limit of at least 4GB of virtual memory to load.

    64-bit Windows builds of R are by default limited in memory usage to the amount of RAM installed: this limit can be changed by command-line option –max-mem-size or setting environment variable R_MAX_MEM_SIZE.


Interview Jeroen Ooms OpenCPU #rstats

Below an interview with Jeroen Ooms, a pioneer in R and web development. Jeroen contributes to R by developing packages and web applications for multiple projects.

jeroen

Ajay- What are you working on these days?
Jeroen- My research revolves around challenges and opportunities of using R in embedded applications and scalable systems. After developing numerous web applications, I started the OpenCPU project about 1.5 year ago, as a first attempt at a complete framework for proper integration of R in web services. As I work on this, I run into challenges that shape my research, and sometimes become projects in their own. For example, the RAppArmor package provides the security framework for OpenCPU, but can be used for other purposes as well. RAppArmor interfaces to some methods in the Linux kernel, related to setting security and resource limits. The github page contains the source code, installation instructions, video demo’s, and a draft of a paper for the journal of statistical software. Another example of a problem that appeared in OpenCPU is that applications that used to work were breaking unexpectedly later on due to changes in dependency packages on CRAN. This is actually a general problem that affects almost all R users, as it compromises reliability of CRAN packages and reproducibility of results. In a paper (forthcoming in The R Journal), this problem is discussed in more detail and directions for improvement are suggested. A preprint of the paper is available on arXiv: http://arxiv.org/abs/1303.2140.

I am also working on software not directly related to R. For example, in project Mobilize we teach high school students in Los Angeles the basics of collecting and analyzing data. They use mobile devices to upload surveys with questions, photos, gps, etc using the ohmage software. Within Mobilize and Ohmage, I am in charge of developing web applications that help students to visualize the data they collaboratively collected. One public demo with actual data collected by students about snacking behavior is available at: http://jeroenooms.github.com/snack. The application allows students to explore their data, by filtering, zooming, browsing, comparing etc. It helps students and teachers to access and learn from their data, without complicated tools or programming. This approach would easily generalize to other fields, like medical data or BI. The great thing about this application is that it is fully client side; the backend is simply a CSV file. So it is very easy to deploy and maintain.

Ajay-What’s your take on difference between OpenCPU and RevoDeployR ?
Jeroen- RevoDeployR and OpenCPU both provide a system for development of R web applications, but in a fairly different context. OpenCPU is open source and written completely in R, whereas RevoDeployR is proprietary and written in Java. I think Revolution focusses more on a complete solution in a corporate environment. It integrates with the Revolution Enterprise suite and their other big data products, and has built-in functionality for authentication, managing privileges, server administration, support for MS Windows, etc. OpenCPU on the other hand is much smaller and should be seen as just a computational backend, analogous to a database backend. It exposes a clean HTTP api to call R functions to be embedded in larger systems, but is not a complete end-product in itself.

OpenCPU is designed to make it easy for a statistician to expose statistical functionality that will used by web developers that do not need to understand or learn R. One interesting example is how we use OpenCPU inside OpenMHealth, a project that designs an architecture for mobile applications in the health domain. Part of the architecture are so called “Data Processing Units”, aka DPU’s. These are simple, modular I/O units that do various sorts of data processing, similar to unix tools, but then over HTTPS. For example, the mobility dpu is used to calculate distances between gps coordinates via a simple http call, which OpenCPU maps to the corresponding R function implementing the harversine formula.

Ajay- What are your views on Shiny by RStudio?
Jeroen- RStudio seems very promising. Like Revolution, they deliver a more full featured product than any of my projects. However, RStudio is completely open source, which is great because it allows anyone to leverage the software and make it part of their projects. I think this is one of the reasons why the product has gotten a lot of traction in the community, which has in turn provided RStudio with great feedback to further improve the product. It illustrates how open source can be a win-win situation. I am currently developing a package to run OpenCPU inside RStudio, which will make developing and running OpenCPU apps much easier.

Ajay- Are you still developing excellent RApache web apps (which IMHO could be used for visualization like business intelligence tools?)
Jeroen–   The OpenCPU framework was a result of those webapps (including ggplot2 for graphical exploratory analysis, lme4 for online random effects modeling, stockplot for stock predictions and irttool.com, an R web application for online IRT analysis). I started developing some of those apps a couple of years ago, and realized that I was repeating a large share of the infrastructure for each application. Based on those experiences I extracted a general purpose framework. Once the framework is done, I’ll go back to developing applications 🙂

Ajay- You have helped  build web apps, openCPU, RAppArmor, Ohmage , Snack , mobility apps .What’s your thesis topic on?
Jeroen- My thesis revolves around all of the technical and social challenges of moving statistical computing beyond the academic and private labs, into more public, accessible and social places. Currently statistics is still done to mostly manually by specialists using software to load data, perform some analysis, and produce results that end up in a report or presentation. There are great opportunities to leverage the open source analysis and visualization methods that R has to offer as part of open source stacks, services, systems and applications. However, several problems need to be addressed before this can actually be put in production. I hope my doctoral research will contribute to taking a step in that direction.

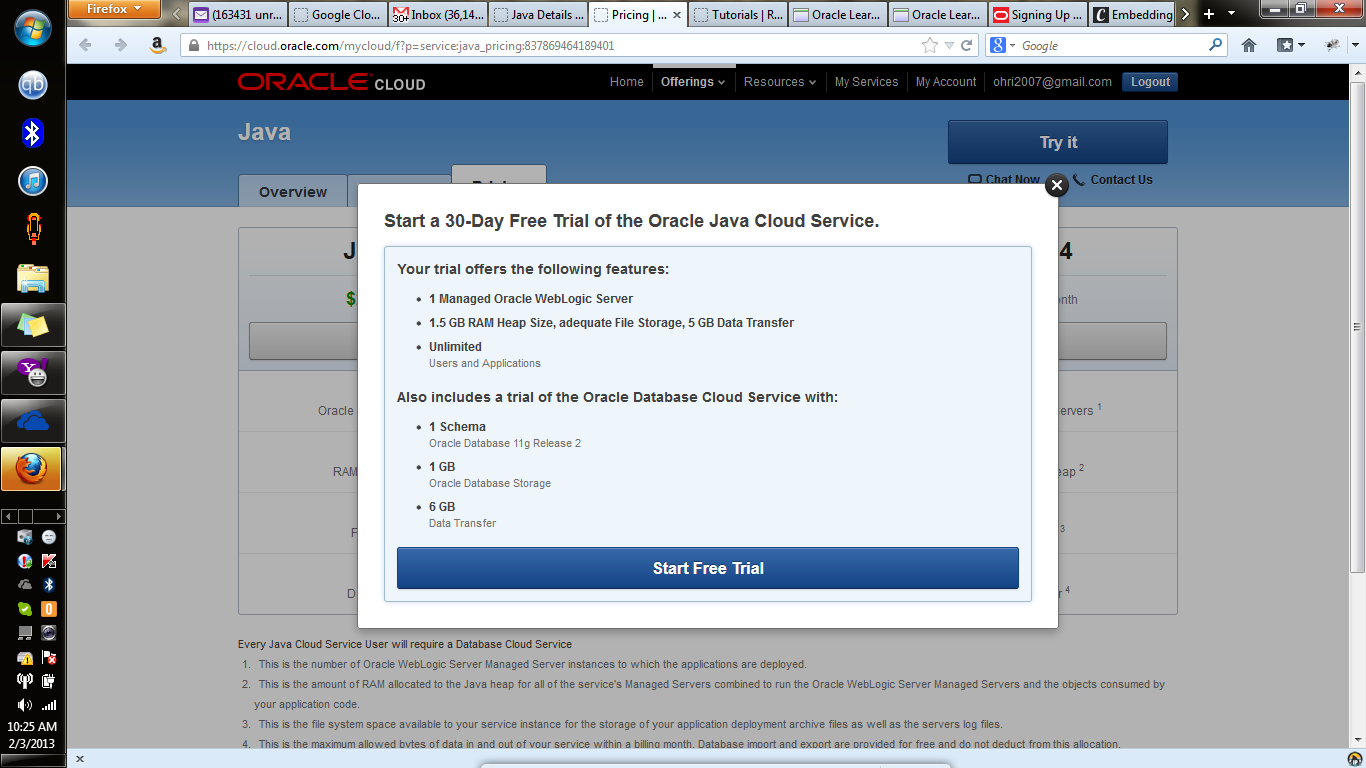
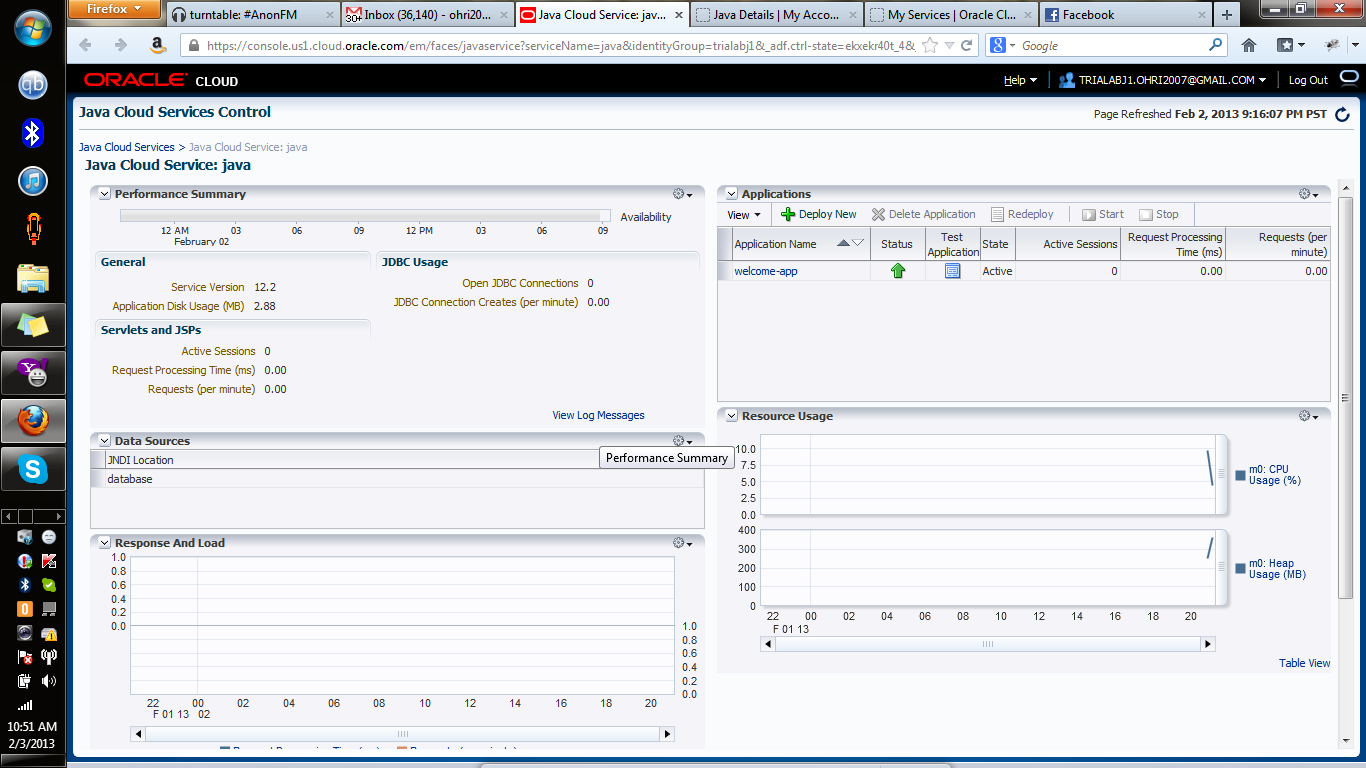
Ajay- R is RAM constrained but the cloud offers lots of RAM. Do you see R increasing in usage on the cloud? why or why not?
Jeroen-   Statistical computing can greatly benefit from the resources that the cloud has to offer. Software like OpenCPU, RStudio, Shiny and RevoDeployR all provide some approach of moving computation to centralized servers. This is only the beginning. Statisticians, researchers and analysts will continue to increasingly share and publish data, code and results on social cloud-based computing platforms. This will address some of the hardware challenges, but also contribute towards reproducible research and further socialize data analysis, i.e. improve learning, collaboration and integration.

That said, the cloud is not going to solve all problems. You mention the need for more memory, but that is only one direction to scale in. Some of the issues we need to address are more fundamental and require new algorithms, different paradigms, or a cultural change. There are many exciting efforts going on that are at least as relevant as big hardware. Gelman’s mc-stan implements a new MC method that makes Bayesian inference easier and faster while supporting more complex models. This is going to make advanced Bayesian methods more accessible to applied researchers, i.e. scale in terms of complexity and applicability. Also Javascript is rapidly becoming more interesting. Performance of Google’s javascript engine V8 outruns any other scripting language at this point, and the huge Javascript community provides countless excellent software libraries. For example D3 is a graphics library that is about to surpass R in terms of functionality, reliability and user base. The snack viz that I developed for Mobilize is based largely on D3. Finally, Julia is another young language for technical computing with lots of activity and very smart people behind it. These developments are just as important for the future of statistical computing as big data solutions.

About-
You can read more on Jeroen and his work at  http://jeroenooms.github.com/ and reach out to him here http://www.linkedin.com/in/datajeroen

R in Oracle Java Cloud and Existing R – Java Integration #rstats

So I finally got my test plan accepted for a 1 month trial to the Oracle Public Cloud at https://cloud.oracle.com/ .

oc1 I am testing this for my next book R for Cloud Computing ( I have already covered Windows Azure, Amazon AWS, and in the middle of testing Google Compute).

Some initial thoughts- this Java cloud seemed more suitable for web apps, than for data science ( but I have to spend much more time on this).

I really liked the help and documentation and tutorials, Oracle has invested a lot in it to make it friendly to enterprise users.

Hopefully the Oracle R Enterprise  ORE guys can talk to the Oracle Cloud department and get some common use case projects going.

oc3.7

In the meantime, I did a roundup on all R -Java projects.

They include- Continue reading “R in Oracle Java Cloud and Existing R – Java Integration #rstats”

%d bloggers like this: