I recently managed to get a copy of SAS University Edition. 
1) Here were some problems I had to resolve- The download size is 1.5 gb of a zipped file ( a virtual machine image). Since I have a internet broadband based in India it led to many failed attempts before I could get it. The unzipped file is almost 3.5 gb. You can get the download file here http://www.sas.com/en_us/software/university-edition/download-software.html.
Secondly the hardware needed is 64 bit, so I basically upgraded my Dell Computer. This was a useful upgrade for me anyway.
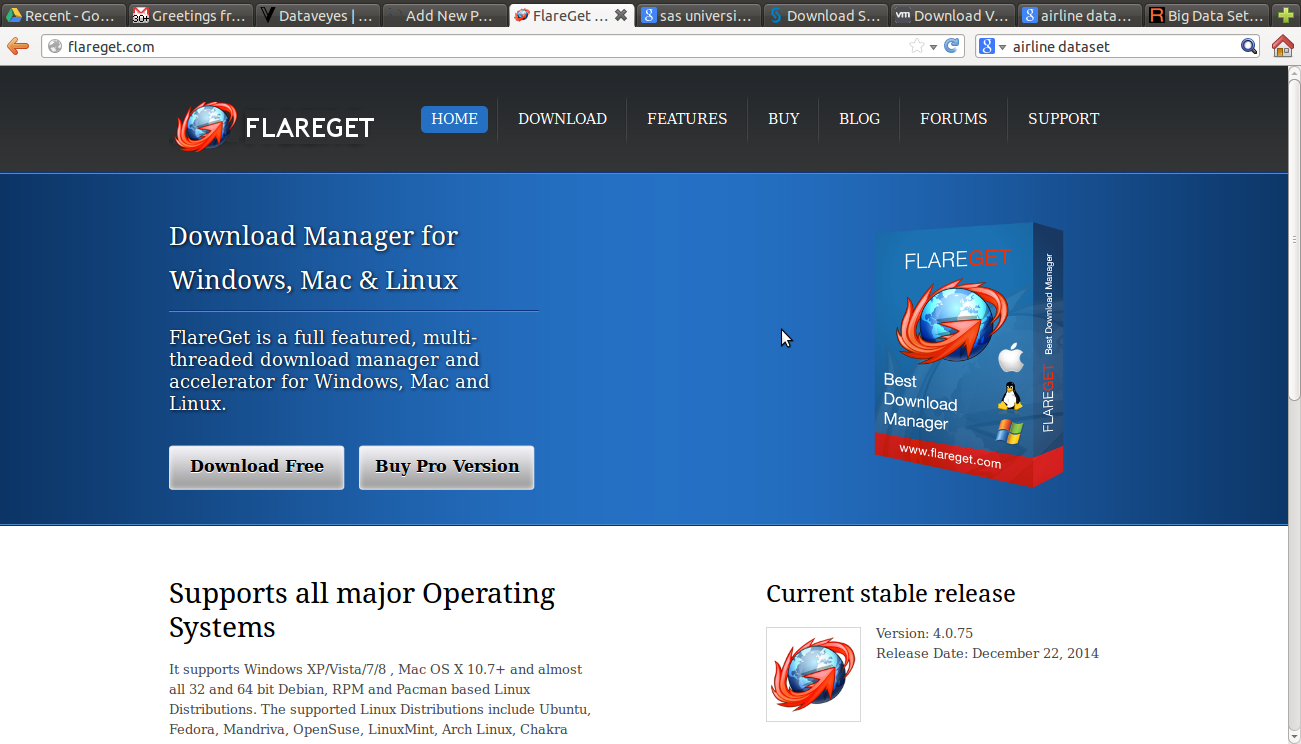
2) You can get an Internet Download Manager to resume downloading in case your Internet connection has issues downloading a 1.5 gb file in one go. For Linux you can see http://flareget.com/download/ 
and for Windows http://www.internetdownloadmanager.com/download.html
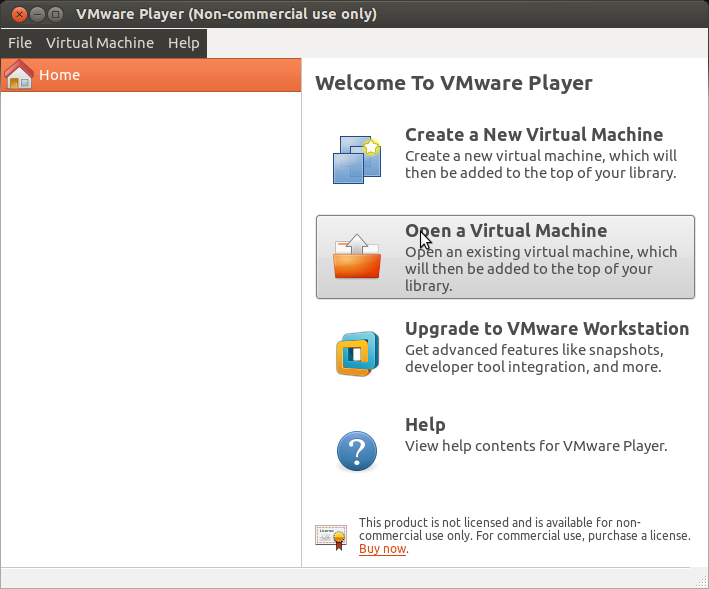
3) I chose VM Player for Linux because I am much more comfortable with VM Player ( Desktop free version). I got that from here ~200 MB https://my.vmware.com/web/vmware/free#desktop_end_user_computing/vmware_player/6_0

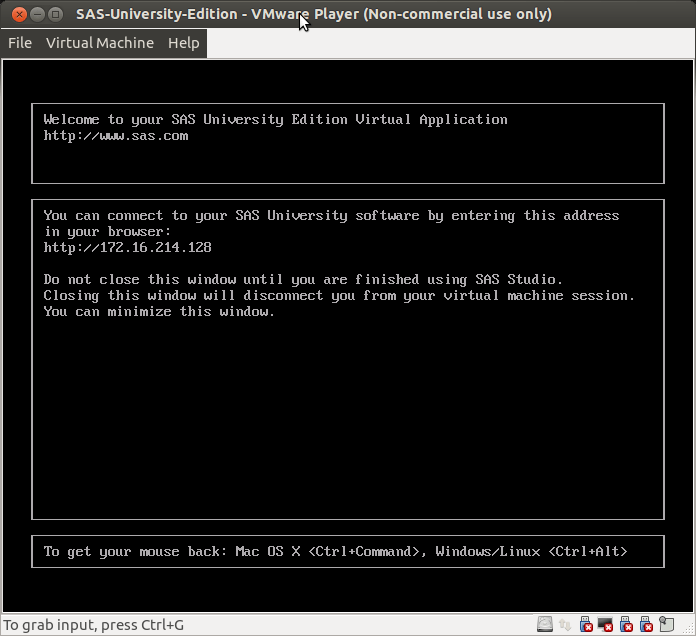
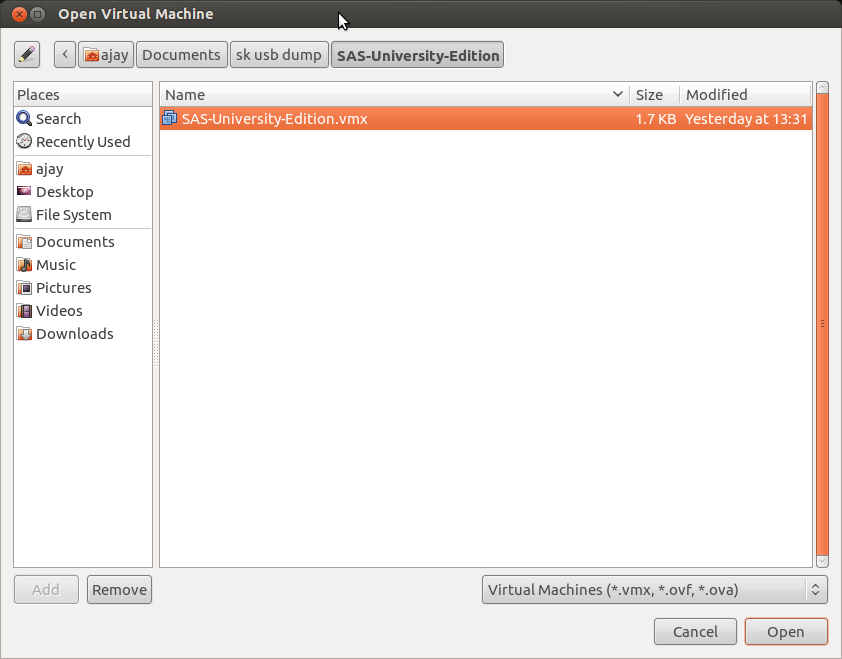
4) Finally I installed VM Player and Open an Existing Virtual Machine to boot up SAS University Edition 

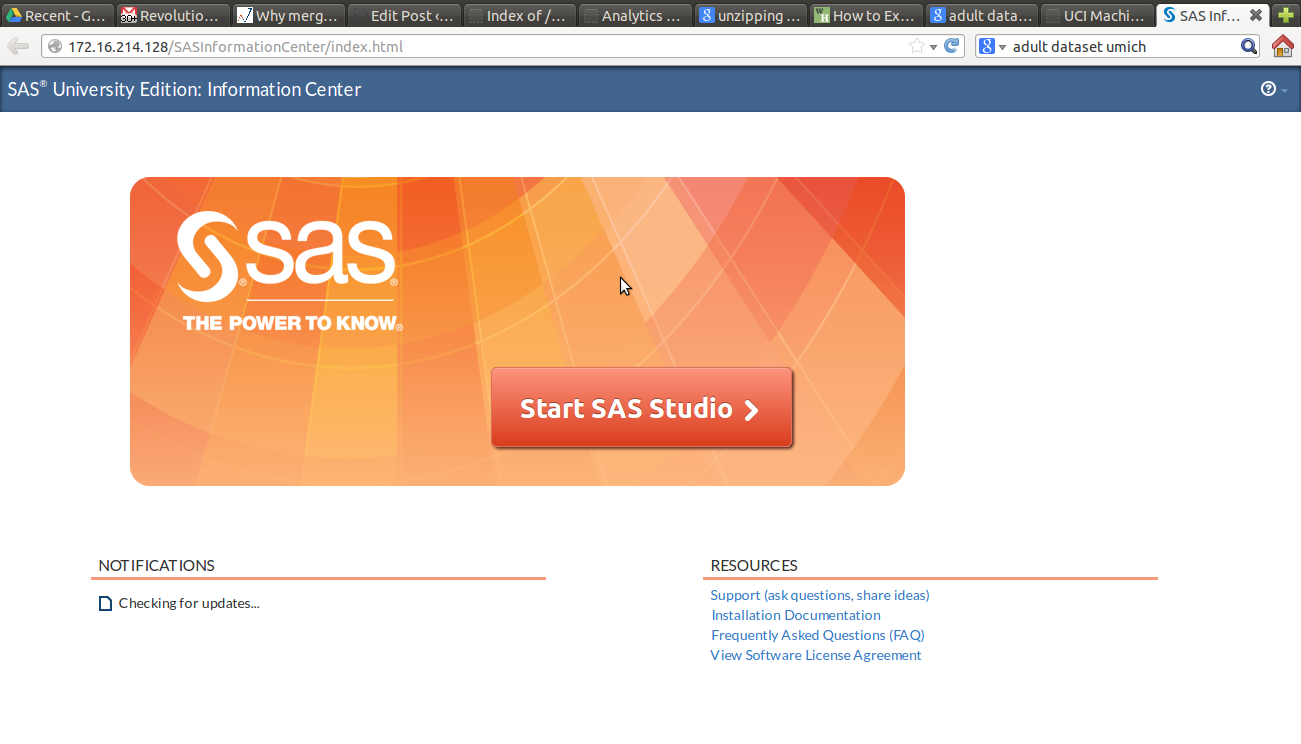
I was able to open the SAS Studio at the IP Address provided.

5)
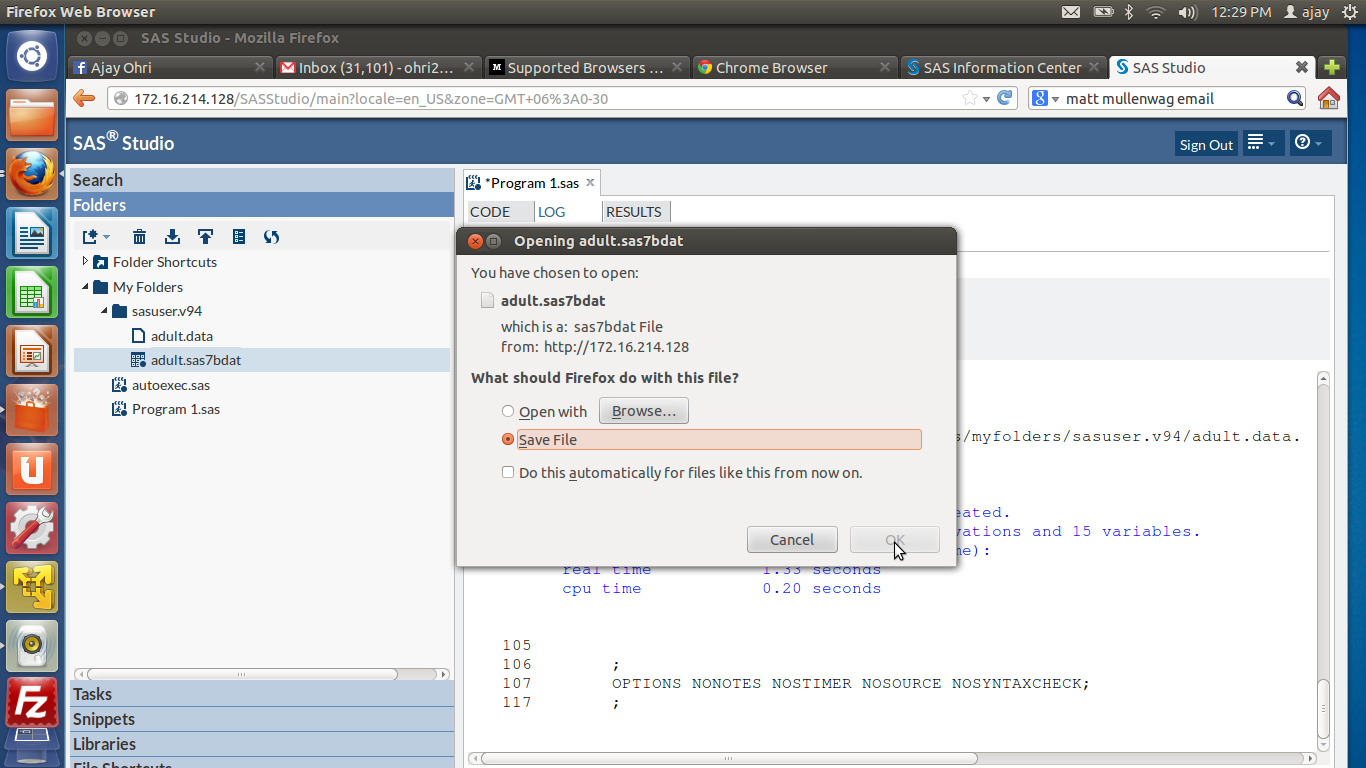
I downloaded a Dataset from this collection here
https://archive.ics.uci.edu/ml/datasets/Adult
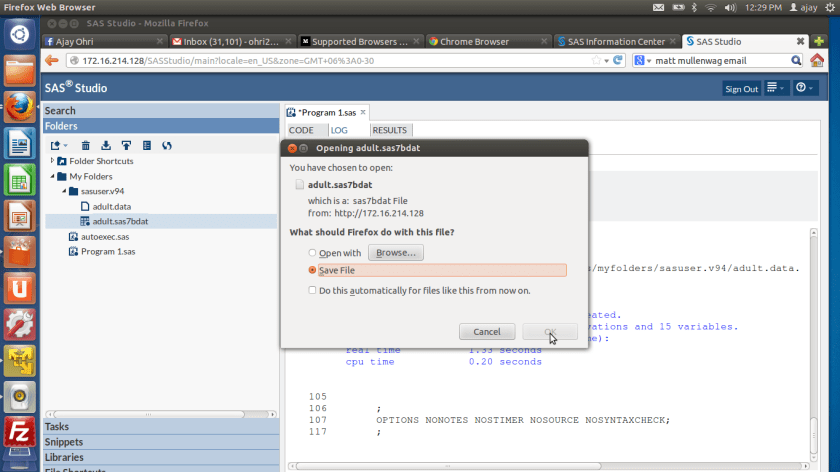
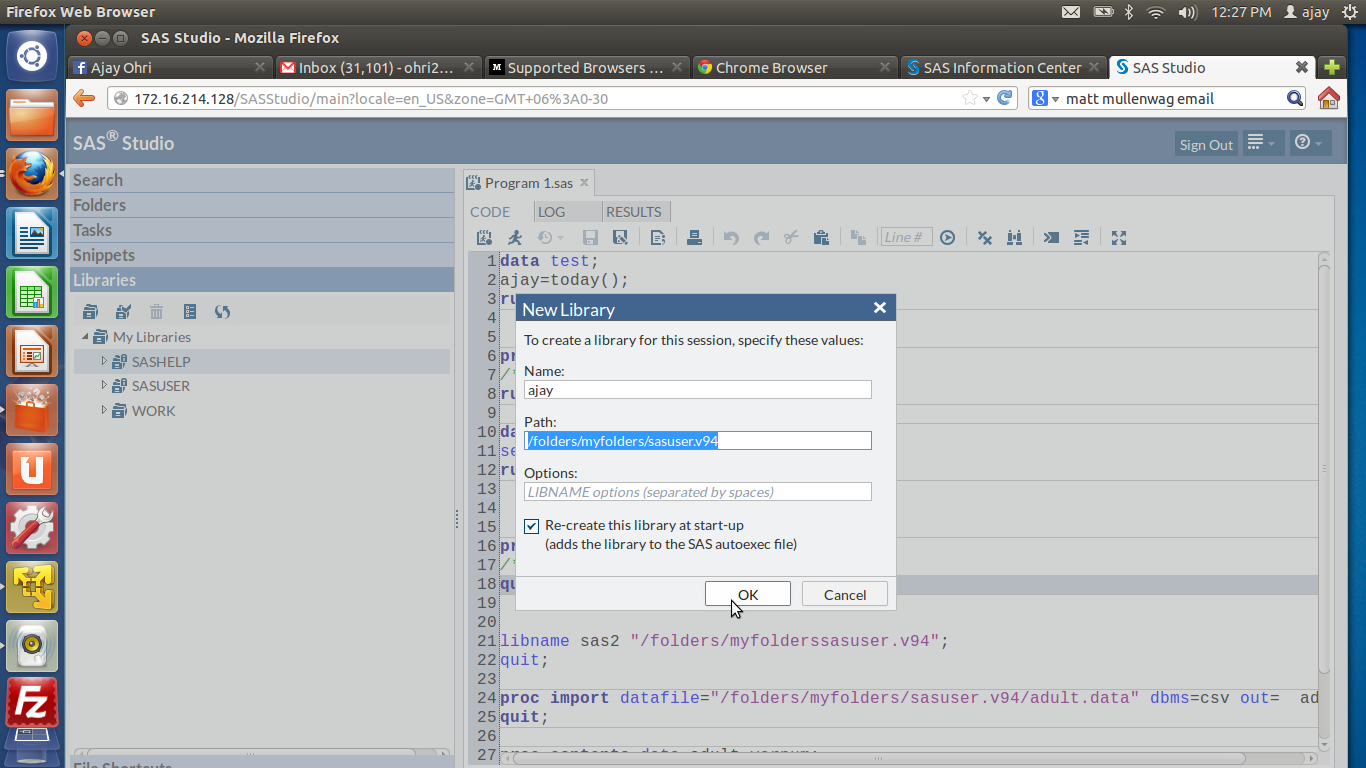
6) Then I uploaded it to within the SAS Studio System
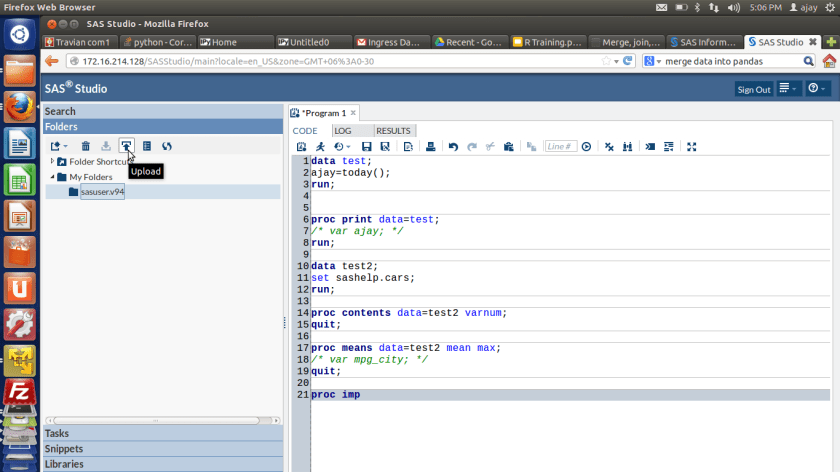
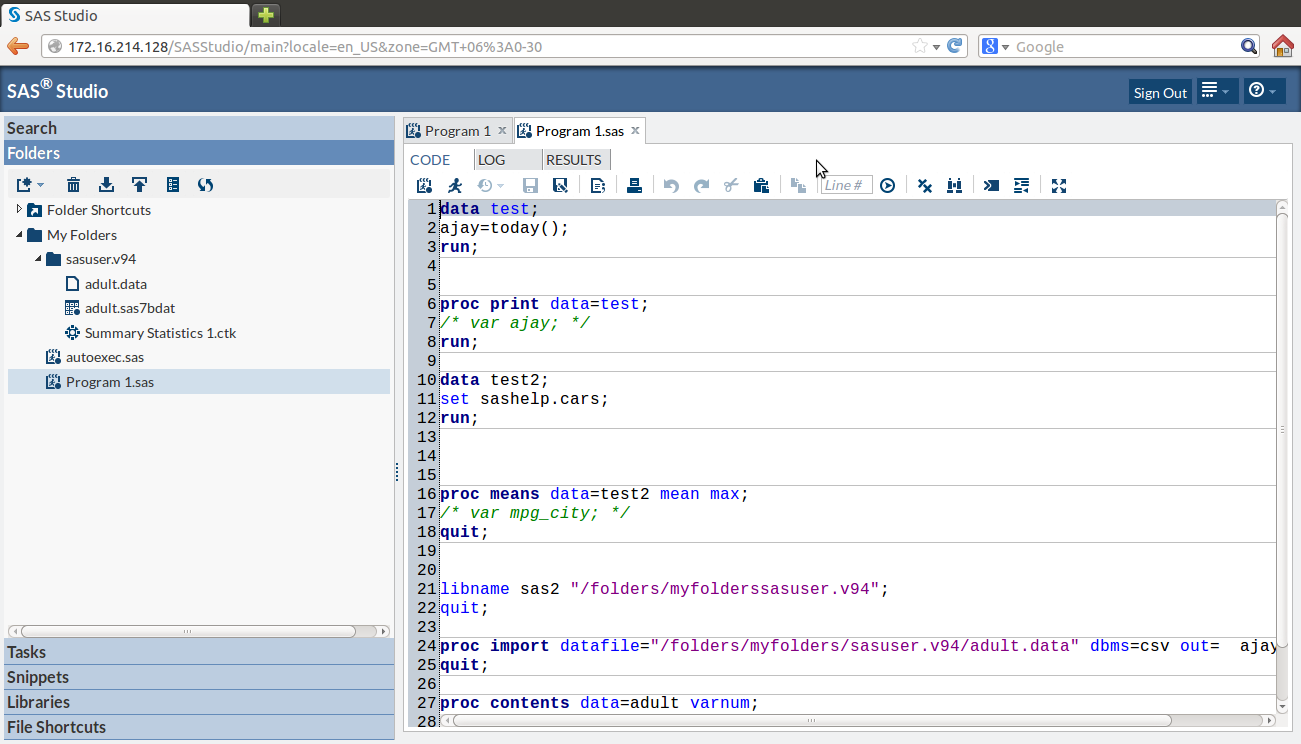
7) Lastly I was able to run some basic commands

I was really impressed by the enhancements made to the interface, the ability to search command help through a drop down, the color coded editor and of course the case insensitive SAS language (though I am not a fan of the semi colon I loved using Ctrl + / for easy commenting and uncommenting)
- For a SAS turned R turned SAS coder- here are some views
- SAS has different windows for coding, log and output. R generally has one
- SAS is case insensitive while R is case sensitive. This is a blessing especially for variable and dataset names.
- SAS deals with Datasets than can be considered the same as Rs Data Frame.
- R’s flexibility in data types is not really comparable to SAS as it is quite fast enough.
- SAS has a Macro Language for repeatable tasks
- SQL is embedded within SAS as Proc SQL and in R through sqldf package
- You have to pay for each upgrade in SAS ecosystem. I am not clear on the transparent pricing, which components does what and whether they have a cloud option for renting by the hour. How about one web page that lists product description and price.
- SAS University Edition is a OS agnostic tool, for that itself it is quite impressive compared to say Academic Edition of Revolution Analytics.
- R is object oriented and uses [] and $ notation for sub objects. SAS is divided into two main parts- data and proc steps, and uses the . notation and var system
- SAS language has a few basic procs but many many options.
- How good a SAS coder you are often depends on what you can do in data manipulation in SAS Data Step
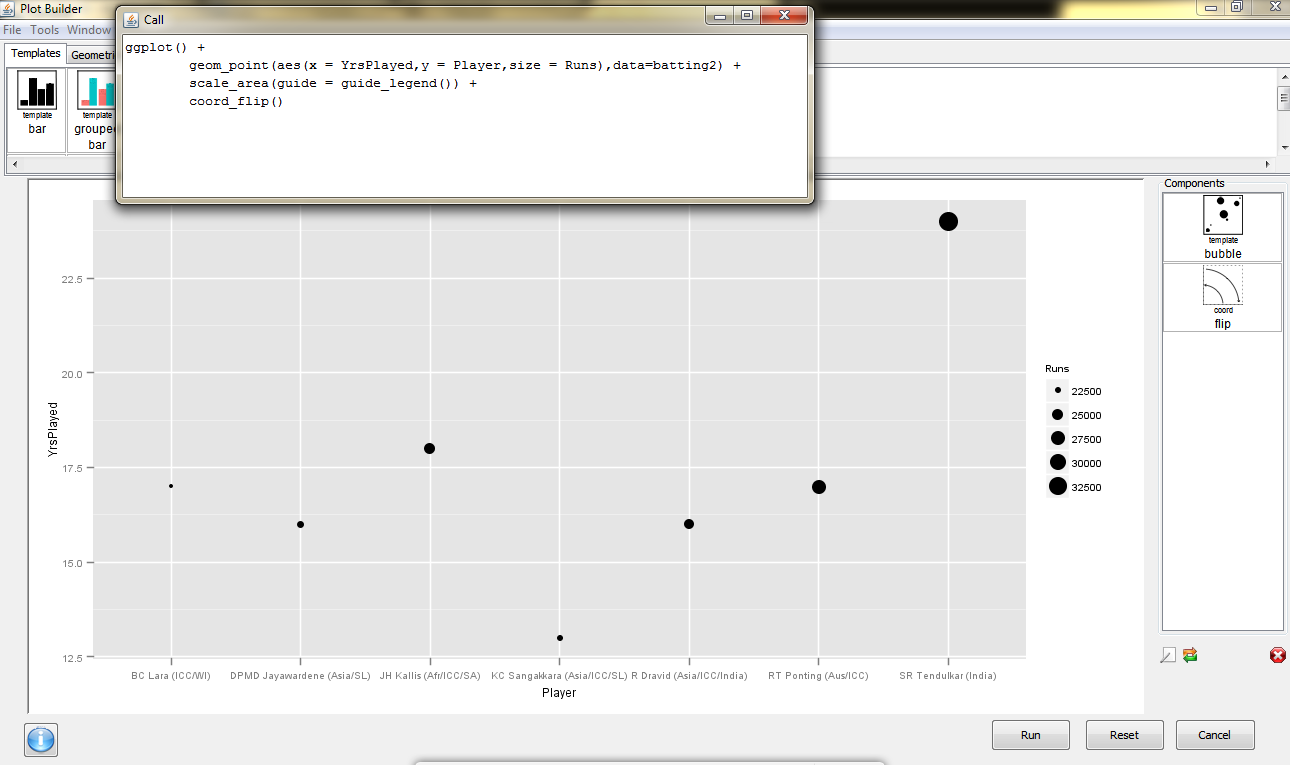
- Graphics is still better in R ggplot. But the SAS speed is thrilling.
- RAM is limited in the University Edition to 1 GB but I found that still quite fast. However I can upload only a 10 mb file to the SAS Studio for University Edition which I found reasonable for teaching purposes.


 NumPy is the fundamental package needed for scientific computing with Python. Besides its obvious scientific uses, NumPy can also be used as an efficient multi-dimensional container of generic data. Arbitrary data-types can be defined. This allows NumPy to seamlessly and speedily integrate with a wide variety of databases. Repositories for NumPy binaries:
  SciPy is open-source software for mathematics, science, and engineering. It is also the name of a very popular conference on scientific programming with Python. The SciPy library depends on NumPy, which provides convenient and fast N-dimensional array manipulation. The SciPy library is built to work with NumPy arrays, and provides many user-friendly and efficient numerical routines such as routines for numerical integration and optimization.
 2D plotting library for Python that produces high quality figures that can be used in various hardcopy and interactive environments. matplolib is compatiable with python scripts and the python and ipython shells.
 High quality open source python shell that includes tools for high level and interactive parallel computing.
 SymPy is a Python library for symbolic mathematics. It aims to become a full-featured computer algebra system (CAS) while keeping the code as simple as possible in order to be comprehensible and easily extensible. SymPy is written entirely in Python and does not require any external libraries.
 Cython is a language based on Pyrex that makes writing C extensions for Python as easy as writing them in Python itself. Cython supports calling C functions and declaring C types on variables and class attributes, allowing the compiler to generate very efficient C code from Cython code.
 pandas is an open source, BSD-licensed library providing high-performance, easy-to-use data structures and data analysis tools for the Python programming language.
 Free high-quality and peer-reviewed volunteer produced collection of algorithms for image processing.
 Module designed for scientific pythons that provides accesible solutions to machine learning problems.
 Statsmodels is a Python package that provides a complement to scipy for statistical computations including descriptive statistics and estimation of statistical models.
 Interactive development environment for Python that features advanced editing, interactive testing, debugging and introspection capabilities, as well as a numerical computing environment made possible through the support of Ipython, NumPy, SciPy, and matplotlib.
 Open source mathematics sofware system that combines existing open-source packages into a Python-based interface.
 Free scientific and engineering development software used for numerical computations, and analysis and visualization of data using the Python programmimg language.