Step 1
Upload Dataset
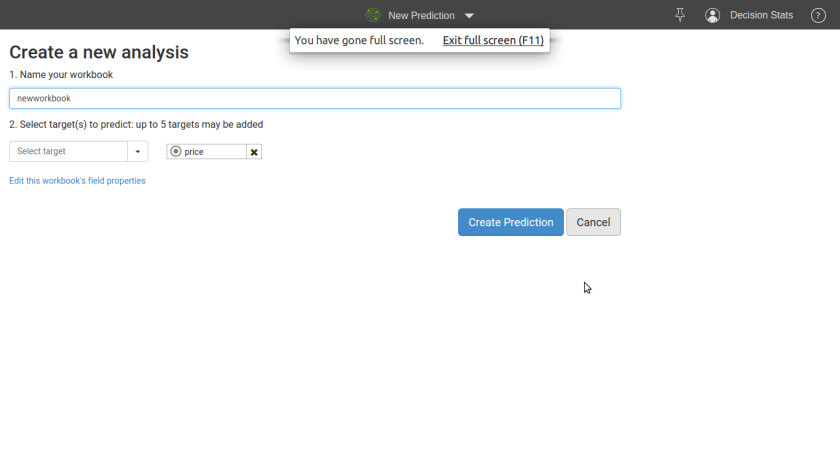
Step 2
Click Prediction
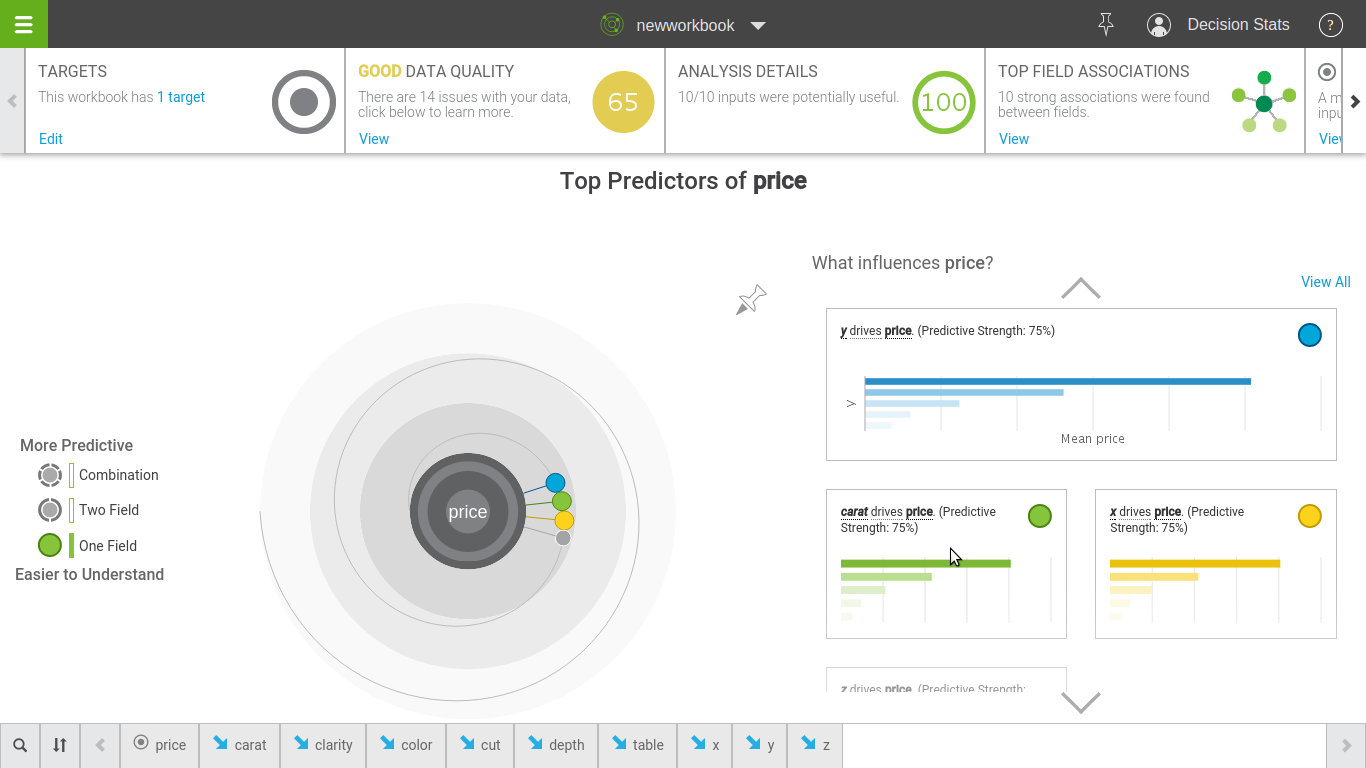
Step 3
Be blown away

Step 1
Upload Dataset
Step 2
Click Prediction
Step 3
Be blown away
BigML has created a marketplace for selling Datasets and Models. This is a first (?) as the closest market for Predictive Analytics till now was Rapid Miner’s marketplace for extensions (at http://rapidupdate.de:8180/UpdateServer/faces/index.xhtml)
From http://blog.bigml.com/2012/10/25/worlds-first-predictive-marketplace/
SELL YOUR DATA
You can make your Dataset public. Mind you: the Datasets we are talking about are BigML’s fancy histograms. This means that other BigML users can look at your Dataset details and create new models based on this Dataset. But they can not see individual records or columns or use it beyond the statistical summaries of the Dataset. Your Source will remain private, so there is no possibility of anyone accessing the raw data.
SELL YOUR MODEL
Now, once you have created a great model, you can share it with the rest of the world. For free or at any price you set.Predictions are paid for in BigML Prediction Credits. The minimum price is ‘Free’ and the maximum price indicated is 100 credits.
White Box Models
Clicking on the white open lock will open up your model to the rest of the world. Anyone can now buy your model, explore it, use it to make predictions

Black Box Models
If you choose the black box setting (the black open lock icon), other BigML users will NOT be able to view or clone your model, but they will be able to use it to make predictions.

——
DOWNLOAD YOUR MODEL
BigML.com have added downloads to our models. Simply choose the format you want and you can copy/paste the code or text. There is a range of formats that they offer currently: JSON PML, PMML, Python, Ruby, Objective-C, Java, the rules of the decision tree in plain text and a Summary overview of your model. Around the corner are MS Excel downloads and R (of course!).
PUBLICIZE YOUR MODEL
There’s also an ’embed’ function, so now you can embed the little poster of your model in your blog post or website, so it is easy to share it in your own environment.
————————————————————————————————————————–
It is nice to see Models and Data getting the APPY treatment and hopefully, it will encourage other vendors Iike Google Prediction API etc to further spend thought and effort to reward data mining individuals directly without going through corporate intermediaries while ensuring intellectual property safeguards .
An R package market for enterprises? for Python libraries? JMP addins? A market for SAS Macros- who knows what the future shall hold. But overall, this is a very positive step by the BigML.com team. The App marketplace has helped revolutionize mobile and desktop computing and hopefully it will do the same for Business Analytics.
Ajay- What are some of the privacy guidelines that you keep in mind- given the fact that you collect individual information but also have government agencies as potential users.
Prior to his election as ACM president, Chesnais was vice president from July 2008 – June 2010 as well as secretary/treasurer from July 2006 – June 2008. He also served as president of ACM SIGGRAPH from July 2002 – June 2005 and as SIG Governing Board Chair from July 2000 – June 2002.
As a French citizen now residing in Canada, he has more than 20 years of management experience in the software industry. He joined the local SIGGRAPH Chapter in Paris some 20 years ago as a volunteer and has continued his involvement with ACM in a variety of leadership capacities since then.
TrendSpottr is a real-time viral search and predictive analytics service that identifies the most timely and trending information for any topic or keyword. Our core technology analyzes real-time data streams and spots emerging trends at their earliest acceleration point — hours or days before they have become “popular” and reached mainstream awareness.
TrendSpottr serves as a predictive early warning system for news and media organizations, brands, government agencies and Fortune 500 companies and helps them to identify emerging news, events and issues that have high viral potential and market impact. TrendSpottr has partnered with HootSuite, DataSift and other leading social and big data companies.
Friday, July 13th is your final opportunity to take advantage of the super early bird pricing for Predictive Analytics World Boston, Sept 30 – Oct 4.
INFO: www.pawcon.com/boston
AGENDA AT A GLANCE: www.pawcon.com/boston/2012/agenda_overview.php
Register now and realize savings of up to $600 over onsite registration:
www.pawcon.com/boston/register.php
– – – – – – – – – – – – – – –
All ANALYTICS EVENTS:
PAW Government: Sept 17-18, 2012 – www.pawgov.com
PAW Boston: Sept 30-Oct 4, 2012 – http://www.pawcon.com/boston
Text Analytics World Boston: Oct 3-4, 2012 – www.tawcon.com/boston
PAW Düsseldorf: Nov 6-7, 2012 – predictiveanalyticsworld.de
PAW London: Nov 27-28, 2012 – www.pawcon.com/london
PAW Videos: Available on-demand – www.pawcon.com/video
Here is an interview with Jason Kuo who works with SAP Analytics as Group Solutions Marketing Manager. Jason answers questions on SAP Analytics and it’s increasing involvement with R statistical language.
Ajay- What made you choose R as the language to tie important parts of your technology platform like HANA and SAP Predictive Analysis. Did you consider other languages like Julia or Python.
Jason- It’s the most popular. Over 50% of the statisticians and data analysts use R. With 3,500+ algorithms its arguably the most comprehensive statistical analysis language. That said,we are not closing the door on others.
Ajay- When did you first start getting interested in R as an analytics platform?
Jason- SAP has been tracking R for 5+ years. With R’s explosive growth over the last year or two, it made sense for us to dramatically increase our investment in R.
Ajay- Can we expect SAP to give back to the R community like Google and Revolution Analytics does- by sponsoring Package development or sponsoring user meets and conferences?
Will we see SAP’s R HANA package in this year’s R conference User 2012 in Nashville
Jason- Yes. We plan to provide a specific driver for HANA tables for input of the data to native R. This planned for end of 2012. We’ll then review our event strategy. SAP has been a sponsor of Predictive Analytics World for several years and was indeed a founding sponsor. We may be attending the year’s R conference in Nashville.
Ajay- What has been some of the initial customer feedback to your analytics expansion and offerings.
Jason- We have completed two very successful Pilots of the R Integration for HANA with two of SAP’s largest customers.
About-
Jason has over 15 years of BI and Data Warehousing industry experience. Having worked at Oracle, Business Objects, and now SAP, Jason has been involved in numerous technical marketing roles involving performance management dashboards, information management, text analysis, predictive analytics, and now big data. He has a bachelor’s of science in operations research from the University of Michigan.
A nice workshop on using R for Predictive Modeling by Max Kuhn Director, Nonclinical Statistics, Pfizer is on at PAW Toronto.
Intended Audience: Practitioners who wish to learn how to execute on predictive analytics by way of the R language; anyone who wants “to turn ideas into software, quickly and faithfully.”
Knowledge Level: Either hands-on experience with predictive modeling (without R) or hands-on familiarity with any programming language (other than R) is sufficient background and preparation to participate in this workshop.

This one-day session provides a hands-on introduction to R, the well-known open-source platform for data analysis. Real examples are employed in order to methodically expose attendees to best practices driving R and its rich set of predictive modeling packages, providing hands-on experience and know-how. R is compared to other data analysis platforms, and common pitfalls in using R are addressed.
The instructor, a leading R developer and the creator of CARET, a core R package that streamlines the process for creating predictive models, will guide attendees on hands-on execution with R, covering:
Hardware: Bring Your Own Laptop
Each workshop participant is required to bring their own laptop running Windows or OS X. The software used during this training program, R, is free and readily available for download.
Attendees receive an electronic copy of the course materials and related R code at the conclusion of the workshop.
Max Kuhn is a Director of Nonclinical Statistics at Pfizer Global R&D in Connecticut. He has been applying models in the pharmaceutical industries for over 15 years.
He is a leading R developer and the author of several R packages including the CARET package that provides a simple and consistent interface to over 100 predictive models available in R.
Mr. Kuhn has taught courses on modeling within Pfizer and externally, including a class for the India Ministry of Information Technology.
Source-
http://www.predictiveanalyticsworld.com/toronto/2012/r_for_predictive_modeling.php
This is a continuation of the previous post on using Google Analytics .
Now that we have downloaded and plotted the data- we try and fit time series to the website data to forecast future traffic.
Some observations-
1) Google Analytics has 0 predictive analytics, it is just descriptive analytics and data visualization models (including the recent social analytics). However you can very well add in basic TS function using R to the GA API.
Why do people look at Website Analytics? To know today’s traffic and derive insights for the Future
2) Web Data clearly follows a 7 day peak and trough for weekly effects (weekdays and weekends), this is also true for hourly data …and this can be used for smoothing historic web data for future forecast.
3) On an advanced level, any hugely popular viral posts can be called a level shift (not drift) and accoringly dampened.
Test and Control!
Similarly using ARIMAX, we can factor in quantity and tag of posts as X regressor variables.
and now the code-( dont laugh at the simplicity please, I am just tinkering and playing with data here!)
You need to copy and paste the code at the bottom of this post http://www.decisionstats.com/using-google-analytics-with-r/ if you want to download your GA data down first.
Note I am using lubridate ,forecast and timeSeries packages in this section.
#Plotting the Traffic plot(ga.data$data[,2],type="l")
library(timeSeries)
library(forecast)
#Using package lubridate to convert character dates into time
library(lubridate)
ga.data$data[,1]=ymd(ga.data$data[,1])
ls()
dataset1=ga.data$data
names(dataset1) <- make.names(names(dataset1))
str(dataset1)
head(dataset1)
dataset2 <- ts(dataset1$ga.visitors,start=0,frequency = frequency(dataset1$ga.visitors), names=dataset1$ga.date)
str(dataset2)
head(dataset2)
ts.test=dataset2[1:200]
ts.control=dataset2[201:275]

 #Note I am splitting the data into test and control here

fitets=ets(ts.test)
plot(fitets)
testets=ets(ts.control,model=fitets)
accuracy(testets)
plot(testets)
spectrum(ts.test,method='ar')
decompose(ts.test)

library("TTR")
bb=SMA(dataset2,n=7)#We are doing a simple moving average for every 7 days. Note this can be 24 hrs for hourly data, or 30 days for daily data for month #

to month comparison or 12 months for annual
#We notice that Web Analytics needs sommethening for every 7 thday as there is some relation to traffic on weekedays /weekends /same time last week
head(dataset2,40)
head(bb,40)

par(mfrow=c(2,1))
plot(bb,type="l",main="Using Seven Day Moving Average for Web Visitors")
plot(dataset2,main="Original Data")
Created by Pretty R at inside-R.org
Though I still wonder why the R query, gA R code /package could not be on the cloud (why it needs to be downloaded)– cloud computing Gs?
Also how about adding some MORE predictive analytics to Google Analytics, chaps!
To be continued-
auto.arima() and forecasts!!!
cross validations!!!
and adapting the idiosyncratic periods and cycles of web analytics to time series !!


