Geeks for Privacy: Play Color Cipher and Visual Cryptography

Maybe the guys in Anonymous or Wikileaks can now use visual cryptography while using Snapchat to fool the NSA or CIA

Personally I think a browser with inbuilt backdoors to Tor Relays and data transfer by Bit Torrrents could be worthy a project too.

Quit the bullshit, Google- you are as evil as The Russian Communist Empire

I was just reading up on my weekly to-read list and came across this interesting method. It is called Play Color Cipher-

Each Character ( Capital, Small letters, Numbers (0-9), Symbols on the keyboard ) in the plain text is substituted with a color block from the available 18 Decillions of colors in the world [11][12][13] and at the receiving end the cipher text block (in color) is decrypted in to plain text block. It overcomes the problems like “Meet in the middle attack, Birthday attack and Brute force attacks [1]”.
It also reduces the size of the plain text when it is encrypted in to cipher text by 4 times, with out any loss of content. Cipher text occupies very less buffer space; hence transmitting through channel is very fast. With this the transportation cost through channel comes down.

ColorCipherBlocks

Reference-

http://www.ijcaonline.org/journal/number28/pxc387832.pdf

Visual Cryptography is indeed an interesting topic-

Visual cryptography, an emerging cryptography technology, uses the characteristics of human vision to decrypt encrypted
images. It needs neither cryptography knowledge nor complex computation. For security concerns, it also ensures that hackers
cannot perceive any clues about a secret image from individual cover images. Since Naor and Shamir proposed the basic
model of visual cryptography, researchers have published many related studies.

Visual_crypto_animation_demo

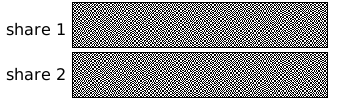
Visual cryptography (VC) schemes hide the secret image into two or more images which are called
shares. The secret image can be recovered simply by stacking the shares together without any complex
computation involved. The shares are very safe because separately they reveal nothing about the secret image.

Visual Cryptography provides one of the secure ways to transfer images on the Internet. The advantage
of visual cryptography is that it exploits human eyes to decrypt secret images .

ESPECIALLY SEE |THIS AND THIS

http://cacr.uwaterloo.ca/~dstinson/VCS-flag.html

and

http://cacr.uwaterloo.ca/~dstinson/VCS-pi.html

Even more fun—– visual cryptography using a series of bar codes – leaving the man in middle guessing how many sub images are there and which if at all is the real message


vispixel

References-

Color Visual Cryptography Scheme Using Meaningful Shares

http://csis.bits-pilani.ac.in/faculty/murali/netsec-10/seminar/refs/muralikrishna4.pdf

Visual cryptography for color images

http://csis.bits-pilani.ac.in/faculty/murali/netsec-10/seminar/refs/muralikrishna3.pdf

Other Resources

  1. http://users.telenet.be/d.rijmenants/en/visualcrypto.htm
  2. Visual Crypto – One-time Image Create two secure images from one by Robert Hansen
  3. Visual Crypto Java Applet at the University of Regensburg
  4. Visual Cryptography Kit Software to create image layers
  5. On-line Visual Crypto Applet by Leemon Baird
  6. Extended Visual Cryptography (pdf) by Mizuho Nakajima and Yasushi Yamaguchi
  7. Visual Cryptography Paper by Moni Noar and Adi Shamir
  8. Visual Crypto Talk (pdf) by Frederik Vercauteren ESAT Leuven
  9. http://cacr.uwaterloo.ca/~dstinson/visual.html
  10. t the University of Salerno web page on visual cryptogrpahy.
  11. Visual Crypto Page by Doug Stinson
  12. Simple implementation of the visual cryptography scheme based on Moni Naor and Adi Shamir, Visual Cryptography, EUROCRYPT 1994, pp1–12. This technique allows visual information like pictures to be encrypted so that decryption can be done visually.The code outputs two files. Try printing them on two separate transparencies and putting them one on top of the other to see the hidden message. http://algorito.com/algorithm/visual-cryptography

Visual Cryptography 

Ajay- I think a combination of sharing and color ciphers would prove more helpful to secure Internet Communication than existing algorithms. It also levels the playing field from computationally rich players to creative coders.

Google Visualization Tools Can Help You Build a Personal Dashboard

The Google Visualization API is a great way for people to make dashboards with slick graphics based  on data without getting into the fine print of the scripting language  itself.  It utilizes the same tools as Google itself does, and makes visualizing data using API calls to the Visualization API. Thus a real-time customizable dashboard that is publishable to the internet can be created within minutes, and more importantly insights can be much more easily drawn from graphs than from looking at rows of tables and numbers.

  1. There are 41 gadgets (including made by both Google and third-party developers ) available in the Gadget  Gallery ( https://developers.google.com/chart/interactive/docs/gadgetgallery)
  2. There are 12 kinds of charts available in the Chart Gallery (https://developers.google.com/chart/interactive/docs/gallery) .
  3. However there 26 additional charts in the charts page at https://developers.google.com/chart/interactive/docs/more_charts )

Building and embedding charts is simplified to a few steps

  • Load the AJAX API
  • Load the Visualization API and the appropriate package (like piechart or barchart from the kinds of chart)
  • Set a callback to run when the Google Visualization API is loaded
    • Within the Callback – It creates and populates a data table, instantiates the particular chart type chosen, passes in the data and draws it.
    • Create the data table with appropriately named columns and data rows.
    • Set chart options with Title, Width and Height
  • Instantiate and draw the chart, passing in some options including the name and id
  • Finally write the HTML/ Div that will hold the chart

You can simply copy and paste the code directly from https://developers.google.com/chart/interactive/docs/quick_start without getting into any details, and tweak them according to your data, chart preference and voila your web dashboard is ready!
That is the beauty of working with API- you can create and display genius ideas without messing with the scripting languages and code (too much). If you like to dive deeper into the API, you can look at the various objects at https://developers.google.com/chart/interactive/docs/reference

First launched in Mar 2008, Google Visualization API has indeed come a long way in making dashboards easier to build for people wanting to utilize advanced data visualization . It came about directly as a result of Google’s 2007 acquisition of GapMinder (of Hans Rosling fame).
As invariably and inevitably computing shifts to the cloud, visualization APIs will be very useful. Tableau Software has been a pioneer in selling data visualizing to the lucrative business intelligence and business dashboards community (you can see the Tableau Software API at http://onlinehelp.tableausoftware.com/v7.0/server/en-us/embed_api.htm ), and Google Visualization can do the same and capture business dashboard and visualization market , if there is more focus on integrating it from Google in it’s multiple and often confusing API offerings.
However as of now, this is quite simply the easiest way to create a web dashboard for your personal needs. Google guarantees 3 years of backward compatibility with this API and it is completely free.

Interview Jason Kuo SAP Analytics #Rstats

Here is an interview with Jason Kuo who works with SAP Analytics as Group Solutions Marketing Manager. Jason answers questions on SAP Analytics and it’s increasing involvement with R statistical language.

Ajay- What made you choose R as the language to tie important parts of your technology platform like HANA and SAP Predictive Analysis. Did you consider other languages like Julia or Python.

Jason- It’s the most popular. Over 50% of the statisticians and data analysts use R. With 3,500+ algorithms its arguably the most comprehensive statistical analysis language. That said,we are not closing the door on others.

Ajay- When did you first start getting interested in R as an analytics platform?

Jason- SAP has been tracking R for 5+ years. With R’s explosive growth over the last year or two, it made sense for us to dramatically increase our investment in R.

Ajay- Can we expect SAP to give back to the R community like Google and Revolution Analytics does- by sponsoring Package development or sponsoring user meets and conferences?

Will we see SAP’s R HANA package in this year’s R conference User 2012 in Nashville

Jason- Yes. We plan to provide a specific driver for HANA tables for input of the data to native R. This planned for end of 2012. We’ll then review our event strategy. SAP has been a sponsor of Predictive Analytics World for several years and was indeed a founding sponsor. We may be attending the year’s R conference in Nashville.

Ajay- What has been some of the initial customer feedback to your analytics expansion and offerings. 

Jason- We have completed two very successful Pilots of the R Integration for HANA with two of SAP’s largest customers.

About-

Jason has over 15 years of BI and Data Warehousing industry experience. Having worked at Oracle, Business Objects, and now SAP, Jason has been involved in numerous technical marketing roles involving performance management dashboards, information management, text analysis, predictive analytics, and now big data. He has a bachelor’s of science in operations research from the University of Michigan.


Book Review- Machine Learning for Hackers

This is review of the fashionably named book Machine Learning for Hackers by Drew Conway and John Myles White (O’Reilly ). The book is about hacking code in R.


The preface introduces the reader to the authors conception of what machine learning and hacking is all about. If the name of the book was machine learning for business analytsts or data miners, I am sure the content would have been unchanged though the popularity (and ambiguity) of the word hacker can often substitute for its usefulness. Indeed the many wise and learned Professors of statistics departments through out the civilized world would be mildly surprised and bemused by their day to day activities as hacking or teaching hackers. The book follows a case study and example based approach and uses the GGPLOT2 package within R programming almost to the point of ignoring any other native graphics system based in R. It can be quite useful for the aspiring reader who wishes to understand and join the booming market for skilled talent in statistical computing.

Chapter 1 has a very useful set of functions for data cleansing and formatting. It walks you through the basics of formatting based on dates and conditions, missing value and outlier treatment and using ggplot package in R for graphical analysis. The case study used is an Infochimps dataset with 60,000 recordings of UFO sightings. The case study is lucid, and done at a extremely helpful pace illustrating the powerful and flexible nature of R functions that can be used for data cleansing.The chapter mentions text editors and IDEs but fails to list them in a tabular format, while listing several other tables like Packages used in the book. It also jumps straight from installation instructions to functions in R without getting into the various kinds of data types within R or specifying where these can be referenced from. It thus assumes a higher level of basic programming understanding for the reader than the average R book.

Chapter 2 discusses data exploration, and has a very clear set of diagrams that explain the various data summary operations that are performed routinely. This is an innovative approach and will help students or newcomers to the field of data analysis. It introduces the reader to type determination functions, as well different kinds of encoding. The introduction to creating functions is quite elegant and simple , and numerical summary methods are explained adequately. While the chapter explains data exploration with the help of various histogram options in ggplot2 , it fails to create a more generic framework for data exploration or rules to assist the reader in visual data exploration in non standard data situations. While the examples are very helpful for a reader , there needs to be slightly more depth to step out of the example and into a framework for visual data exploration (or references for the same). A couple of case studies however elaborately explained cannot do justice to the vast field of data exploration and especially visual data exploration.

Chapter 3 discussed binary classification for the specific purpose for spam filtering using a dataset from SpamAssassin. It introduces the reader to the naïve Bayes classifier and the principles of text mining suing the tm package in R. Some of the example codes could have been better commented for easier readability in the book. Overall it is quite a easy tutorial for creating a naïve Bayes classifier even for beginners.

Chapter 4 discusses the issues in importance ranking and creating recommendation systems specifically in the case of ordering email messages into important and not important. It introduces the useful grepl, gsub, strsplit, strptime ,difftime and strtrim functions for parsing data. The chapter further introduces the reader to the concept of log (and affine) transformations in a lucid and clear way that can help even beginners learn this powerful transformation concept. Again the coding within this chapter is sparsely commented which can cause difficulties to people not used to learn reams of code. ( it may have been part of the code attached with the book, but I am reading an electronic book and I did not find an easy way to go back and forth between the code and the book). The readability of the chapters would be further enhanced by the use of flow charts explaining the path and process followed than overtly verbose textual descriptions running into multiple pages. The chapters are quite clearly written, but a helpful visual summary can help in both revising the concepts and elucidate the approach taken further.A suggestion for the authors could be to compile the list of useful functions they introduce in this book as a sort of reference card (or Ref Card) for R Hackers or atleast have a chapter wise summary of functions, datasets and packages used.

Chapter 5 discusses linear regression , and it is a surprising and not very good explanation of regression theory in the introduction to regression. However the chapter makes up in practical example what it oversimplifies in theory. The chapter on regression is not the finest chapter written in this otherwise excellent book. Part of this is because of relative lack of organization- correlation is explained after linear regression is explained. Once again the lack of a function summary and a process flow diagram hinders readability and a separate section on regression metrics that help make a regression result good or not so good could be a welcome addition. Functions introduced include lm.

Chapter 6 showcases Generalized Additive Model (GAM) and Polynomial Regression, including an introduction to singularity and of over-fitting. Functions included in this chapter are transform, and poly while the package glmnet is also used here. The chapter also introduces the reader formally to the concept of cross validation (though examples of cross validation had been introduced in earlier chapters) and regularization. Logistic regression is also introduced at the end in this chapter.

Chapter 7 is about optimization. It describes error metric in a very easy to understand way. It creates a grid by using nested loops for various values of intercept and slope of a regression equation and computing the sum of square of errors. It then describes the optim function in detail including how it works and it’s various parameters. It introduces the curve function. The chapter then describes ridge regression including definition and hyperparameter lamda. The use of optim function to optimize the error in regression is useful learning for the aspiring hacker. Lastly it describes a case study of breaking codes using the simplistic Caesar cipher, a lexical database and the Metropolis method. Functions introduced in this chapter include .Machine$double.eps .

Chapter 8 deals with Principal Component Analysis and unsupervised learning. It uses the ymd function from lubridate package to convert string to date objects, and the cast function from reshape package to further manipulate the structure of data. Using the princomp functions enables PCA in R.The case study creates a stock market index and compares the results with the Dow Jones index.

Chapter 9 deals with Multidimensional Scaling as well as clustering US senators on the basis of similarity in voting records on legislation .It showcases matrix multiplication using %*% and also the dist function to compute distance matrix.

Chapter 10 has the subject of K Nearest Neighbors for recommendation systems. Packages used include class ,reshape and and functions used include cor, function and log. It also demonstrates creating a custom kNN function for calculating Euclidean distance between center of centroids and data. The case study used is the R package recommendation contest on Kaggle. Overall a simplistic introduction to creating a recommendation system using K nearest neighbors, without getting into any of the prepackaged packages within R that deal with association analysis , clustering or recommendation systems.

Chapter 11 introduces the reader to social network analysis (and elements of graph theory) using the example of Erdos Number as an interesting example of social networks of mathematicians. The example of Social Graph API by Google for hacking are quite new and intriguing (though a bit obsolete by changes, and should be rectified in either the errata or next edition) . However there exists packages within R that should be atleast referenced or used within this chapter (like TwitteR package that use the Twitter API and ROauth package for other social networks). Packages used within this chapter include Rcurl, RJSONIO, and igraph packages of R and functions used include rbind and ifelse. It also introduces the reader to the advanced software Gephi. The last example is to build a recommendation engine for whom to follow in Twitter using R.

Chapter 12 is about model comparison and introduces the concept of Support Vector Machines. It uses the package e1071 and shows the svm function. It also introduces the concept of tuning hyper parameters within default algorithms . A small problem in understanding the concepts is the misalignment of diagram pages with the relevant code. It lastly concludes with using mean square error as a method for comparing models built with different algorithms.


Overall the book is a welcome addition in the library of books based on R programming language, and the refreshing nature of the flow of material and the practicality of it’s case studies make this a recommended addition to both academic and corporate business analysts trying to derive insights by hacking lots of heterogeneous data.

Have a look for yourself at-
http://shop.oreilly.com/product/0636920018483.do

Interview Eberhard Miethke and Dr. Mamdouh Refaat, Angoss Software

Here is an interview with Eberhard Miethke and Dr. Mamdouh Refaat, of Angoss Software. Angoss is a global leader in delivering business intelligence software and predictive analytics solutions that help businesses capitalize on their data by uncovering new opportunities to increase sales and profitability and to reduce risk.

Ajay-  Describe your personal journey in software. How can we guide young students to pursue more useful software development than just gaming applications.

 Mamdouh- I started using computers long time ago when they were programmed using punched cards! First in Fortran, then C, later C++, and then the rest. Computers and software were viewed as technical/engineering tools, and that’s why we can still see the heavy technical orientation of command languages such as Unix shells and even in the windows Command shell. However, with the introduction of database systems and Microsoft office apps, it was clear that business will be the primary user and field of application for software. My personal trip in software started with scientific applications, then business and database systems, and finally statistical software – which you can think of it as returning to the more scientific orientation. However, with the wide acceptance of businesses of the application of statistical methods in different fields such as marketing and risk management, it is a fast growing field that in need of a lot of innovation.

Ajay – Angoss makes multiple data mining and analytics products. could you please introduce us to your product portfolio and what specific data analytics need they serve.

a- Attached please find our main product flyers for KnowledgeSTUDIO and KnowledgeSEEKER. We have a 3rd product called “strategy builder” which is an add-on to the decision tree modules. This is also described in the flyer.

(see- Angoss Knowledge Studio Product Guide April2011  and http://www.scribd.com/doc/63176430/Angoss-Knowledge-Seeker-Product-Guide-April2011  )

Ajay-  The trend in analytics is for big data and cloud computing- with hadoop enabling processing of massive data sets on scalable infrastructure. What are your plans for cloud computing, tablet based as well as mobile based computing.

a- This is an area where the plan is still being figured out in all organizations. The current explosion of data collected from mobile phones, text messages, and social websites will need radically new applications that can utilize the data from these sources. Current applications are based on the relational database paradigm designed in the 70’s through the 90’s of the 20th century.

But data sources are generating data in volumes and formats that are challenging this paradigm and will need a set of new tools and possibly programming languages to fit these needs. The cloud computing, tablet based and mobile computing (which are the same thing in my opinion, just different sizes of the device) are also two technologies that have not been explored in analytics yet.

The approach taken so far by most companies, including Angoss, is to rely on new xml-based standards to represent data structures for the particular models. In this case, it is the PMML (predictive modelling mark-up language) standard, in order to allow the interoperability between analytics applications. Standardizing on the representation of models is viewed as the first step in order to allow the implementation of these models to emerging platforms, being that the cloud or mobile, or social networking websites.

The second challenge cited above is the rapidly increasing size of the data to be analyzed. Angoss has already identified this challenge early on and is currently offering in-database analytics drivers for several database engines: Netezza, Teradata and SQL Server.

These drivers allow our analytics products to translate their routines into efficient SQL-based scripts that run in the database engine to exploit its performance as well as the powerful hardware on which it runs. Thus, instead of copying the data to a staging format for analytics, these drivers allow the data to be analyzed “in-place” within the database without moving it.

Thus offering performance, security and integrity. The performance is improved because of the use of the well tuned database engines running on powerful hardware.

Extra security is achieved by not copying the data to other platforms, which could be less secure. And finally, the integrity of the results are vastly improved by making sure that the results are always obtained by analyzing the up-to-date data residing in the database rather than an older copy of the data which could be obsolete by the time the analysis is concluded.

Ajay- What are the principal competing products to your offerings, and what makes your products special or differentiated in value to them (for each customer segment).

a- There are two major players in today’s market that we usually encounter as competitors, they are: SAS and IBM.

SAS offers a data mining workbench in the form of SAS Enterprise Miner, which is closely tied to SAS data mining methodology known as SEMMA.

On the other hand, IBM has recently acquired SPSS, which offered its Clementine data mining software. IBM has now rebranded Clementine as IBM SPSS Modeller.

In comparison to these products, our KnowledgeSTUDIO and KnowledgeSEEKER offer three main advantages: ease of use; affordability; and ease of integration into existing BI environments.

Angoss products were designed to look-and-feel-like popular Microsoft office applications. This makes the learning curve indeed very steep. Typically, an intermediate level analyst needs only 2-3 days of training to become proficient in the use of the software with all its advanced features.

Another important feature of Angoss software products is their integration with SAS/base product, and SQL-based database engines. All predictive models generated by Angoss can be automatically translated to SAS and SQL scripts. This allows the generation of scoring code for these common platforms. While the software interface simplifies all the tasks to allow business users to take advantage of the value added by predictive models, the software includes advanced options to allow experienced statisticians to fine-tune their models by adjusting all model parameters as needed.

In addition, Angoss offers a unique product called StrategyBuilder, which allows the analyst to add key performance indicators (KPI’s) to predictive models. KPI’s such as profitability, market share, and loyalty are usually required to be calculated in conjunction with any sales and marketing campaign. Therefore, StrategyBuilder was designed to integrate such KPI’s with the results of a predictive model in order to render the appropriate treatment for each customer segment. These results are all integrated into a deployment strategy that can also be translated into an execution code in SQL or SAS.

The above competitive features offered by the software products of Angoss is behind its success in serving over 4000 users from over 500 clients worldwide.

Ajay -Describe a major case study where using Angoss software helped save a big amount of revenue/costs by innovative data mining.

a-Rogers Telecommunications Inc. is one of the largest Canadian telecommunications providers, serving over 8.5 million customers and a revenue of 11.1 Billion Canadian Dollars (2009). In 2008, Rogers engaged Angoss in order to help with the problem of ballooning accounts receivable for a period of 18 months.

The problem was approached by improving the efficiency of the call centre serving the collections process by a set of predictive models. The first set of models were designed to find accounts likely to default ahead of time in order to take preventative measures. A second set of models were designed to optimize the call centre resources to focus on delinquent accounts likely to pay back most of the outstanding balance. Accounts that were identified as not likely to pack quickly were good candidates for “Early-out” treatment, by forwarding them directly to collection agencies. Angoss hosted Rogers’ data and provided on a regular interval the lists of accounts for each treatment to be deployed by the call centre dialler. As a result of this Rogers estimated an improvement of 10% of the collected sums.

Biography-

Mamdouh has been active in consulting, research, and training in various areas of information technology and software development for the last 20 years. He has worked on numerous projects with major organizations in North America and Europe in the areas of data mining, business analytics, business analysis, and engineering analysis. He has held several consulting positions for solution providers including Predict AG in Basel, Switzerland, and as ANGOSS Corp. Mamdouh is the Director of Professional services for EMEA region of ANGOSS Software. Mamdouh received his PhD in engineering from the University of Toronto and his MBA from the University of Leeds, UK.

Mamdouh is the author of:

"Credit Risk Scorecards: Development and Implmentation using SAS"
 "Data Preparation for Data Mining Using SAS",
 (The Morgan Kaufmann Series in Data Management Systems) (Paperback)
 and co-author of
 "Data Mining: Know it all",Morgan Kaufmann


Eberhard Miethke  works as a senior sales executive for Angoss


About Angoss-

Angoss is a global leader in delivering business intelligence software and predictive analytics to businesses looking to improve performance across sales, marketing and risk. With a suite of desktop, client-server and in-database software products and Software-as-a-Service solutions, Angoss delivers powerful approaches to turn information into actionable business decisions and competitive advantage.

Angoss software products and solutions are user-friendly and agile, making predictive analytics accessible and easy to use.

England rule India- again

If you type the words “business intelligence expert” in Google. you may get the top ranked result as http://goo.gl/pCqUh or Peter James Thomas, a profound name as it can be as it spans three of the most important saints in the church.

The current post for this is very non business -intelligence topic called Wager. http://peterjamesthomas.com/2011/07/20/wager/

It details how Peter, a virtual friend whom I have never met, and who looks suspiciously like Hugh Grant with the hair, and Ajay Ohri (myself) waged a wager on which cricket team would emerge victorious in the ongoing test series . It was a 4 match series, and India needed to win atleast the series or avoid losing it by a difference of 2, to retain their world cricket ranking (in Tests) as number 1.

Sadly at the end of the third test, the Indian cricket team have lost the series, the world number 1 ranking, and some serious respect by 3-0.

What is a Test Match? It is a game of cricket played over 5 days.
Why was Ajay so confident India would win. Because India won the one day world championship this April 2011. The one day series is a one day match of cricket.

There lies the problem. From an analytic point of view, I had been lulled into thinking that past performance was an indicator of future performance, indeed the basis of most analytical assumptions. Quite critically, I managed to overlook the following cricketing points-

1) Cricket performance is different from credit performance. It is the people and their fitness.

India’s strike bowler Zaheer Khan was out due to injury, we did not have any adequate replacement for him. India’s best opener Virender Sehwag was out due to shoulder injury in the first two tests.

Moral – Statistics can be misleading if you do not apply recent knowledge couple with domain expertise (in this case cricket)

2) What goes up must come down. Indeed if a team has performed its best two months back, it is a good sign that cyclicality will ensure performance will go down.

Moral- Do not depend on regression or time series with ignoring cyclical trends.

3) India’s cricket team is aging. England ‘s cricket team is youthful.

I should have gotten this one right. One of the big and understated reasons that the Indian economy is booming -is because we have the youngest population in the world with a median age of 28.

or as http://en.wikipedia.org/wiki/Demographics_of_India

India has more than 50% of its population below the age of 25 and more than 65% hovers below the age of 35. It is expected that, in 2020, the average age of an Indian will be 29 years, compared to 37 for China and 48 for Japan; and, by 2030, India’s dependency ratio should be just over 0.4

India’s population is 1.21 billion people, so potentially a much larger pool of athletes , once we put away our laptops that is.

http://en.wikipedia.org/wiki/Demographics_of_UK


the total population of the United Kingdom was 58,789,194 (I dont have numbers for average age)


Paradoxically India have the oldest cricket team in the world . This calls for detailed investigation and some old timers should give way to new comers after this drubbing.

Moral- Demographics matters. It is the people who vary more than any variable.

4) The Indian cricket team has played much less Test cricket and much more 20:20 and one day matches. 20:20 is a format in which only twenty overs are bowled per side. In Test Matches 90 overs are bowled every day for 5 days.

Stamina is critical in sports.

Moral- Context is important in extrapolating forecasts.

Everything said and done- the English cricket team played hard and fair and deserve to be number ones. I would love to say more on the Indian cricket team, but I now intend to watch Manchester United play soccer.


Analytics 2011 Conference

From http://www.sas.com/events/analytics/us/

The Analytics 2011 Conference Series combines the power of SAS’s M2010 Data Mining Conference and F2010 Business Forecasting Conference into one conference covering the latest trends and techniques in the field of analytics. Analytics 2011 Conference Series brings the brightest minds in the field of analytics together with hundreds of analytics practitioners. Join us as these leading conferences change names and locations. At Analytics 2011, you’ll learn through a series of case studies, technical presentations and hands-on training. If you are in the field of analytics, this is one conference you can’t afford to miss.

Conference Details

October 24-25, 2011
Grande Lakes Resort
Orlando, FL

Analytics 2011 topic areas include: