Geeks for Privacy: Play Color Cipher and Visual Cryptography

Maybe the guys in Anonymous or Wikileaks can now use visual cryptography while using Snapchat to fool the NSA or CIA

Personally I think a browser with inbuilt backdoors to Tor Relays and data transfer by Bit Torrrents could be worthy a project too.

Quit the bullshit, Google- you are as evil as The Russian Communist Empire

I was just reading up on my weekly to-read list and came across this interesting method. It is called Play Color Cipher-

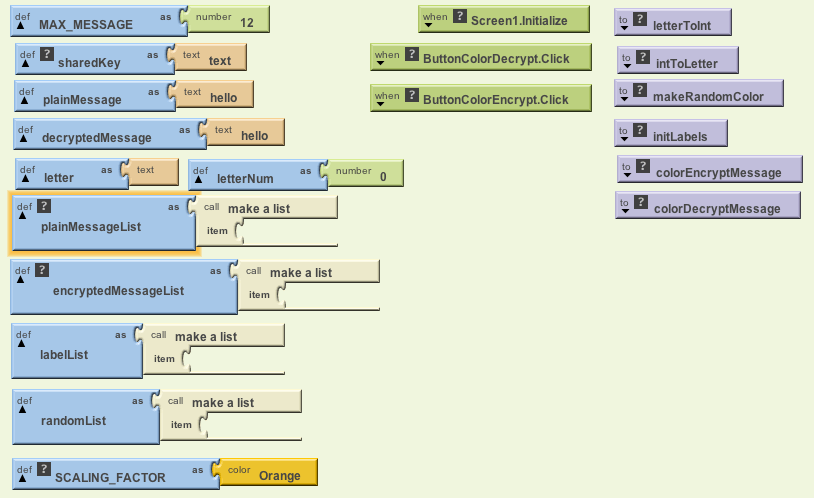
Each Character ( Capital, Small letters, Numbers (0-9), Symbols on the keyboard ) in the plain text is substituted with a color block from the available 18 Decillions of colors in the world [11][12][13] and at the receiving end the cipher text block (in color) is decrypted in to plain text block. It overcomes the problems like “Meet in the middle attack, Birthday attack and Brute force attacks [1]”.
It also reduces the size of the plain text when it is encrypted in to cipher text by 4 times, with out any loss of content. Cipher text occupies very less buffer space; hence transmitting through channel is very fast. With this the transportation cost through channel comes down.

ColorCipherBlocks

Reference-

http://www.ijcaonline.org/journal/number28/pxc387832.pdf

Visual Cryptography is indeed an interesting topic-

Visual cryptography, an emerging cryptography technology, uses the characteristics of human vision to decrypt encrypted
images. It needs neither cryptography knowledge nor complex computation. For security concerns, it also ensures that hackers
cannot perceive any clues about a secret image from individual cover images. Since Naor and Shamir proposed the basic
model of visual cryptography, researchers have published many related studies.

Visual_crypto_animation_demo

Visual cryptography (VC) schemes hide the secret image into two or more images which are called
shares. The secret image can be recovered simply by stacking the shares together without any complex
computation involved. The shares are very safe because separately they reveal nothing about the secret image.

Visual Cryptography provides one of the secure ways to transfer images on the Internet. The advantage
of visual cryptography is that it exploits human eyes to decrypt secret images .

ESPECIALLY SEE |THIS AND THIS

http://cacr.uwaterloo.ca/~dstinson/VCS-flag.html

and

http://cacr.uwaterloo.ca/~dstinson/VCS-pi.html

Even more fun—– visual cryptography using a series of bar codes – leaving the man in middle guessing how many sub images are there and which if at all is the real message


vispixel

References-

Color Visual Cryptography Scheme Using Meaningful Shares

http://csis.bits-pilani.ac.in/faculty/murali/netsec-10/seminar/refs/muralikrishna4.pdf

Visual cryptography for color images

http://csis.bits-pilani.ac.in/faculty/murali/netsec-10/seminar/refs/muralikrishna3.pdf

Other Resources

  1. http://users.telenet.be/d.rijmenants/en/visualcrypto.htm
  2. Visual Crypto – One-time Image Create two secure images from one by Robert Hansen
  3. Visual Crypto Java Applet at the University of Regensburg
  4. Visual Cryptography Kit Software to create image layers
  5. On-line Visual Crypto Applet by Leemon Baird
  6. Extended Visual Cryptography (pdf) by Mizuho Nakajima and Yasushi Yamaguchi
  7. Visual Cryptography Paper by Moni Noar and Adi Shamir
  8. Visual Crypto Talk (pdf) by Frederik Vercauteren ESAT Leuven
  9. http://cacr.uwaterloo.ca/~dstinson/visual.html
  10. t the University of Salerno web page on visual cryptogrpahy.
  11. Visual Crypto Page by Doug Stinson
  12. Simple implementation of the visual cryptography scheme based on Moni Naor and Adi Shamir, Visual Cryptography, EUROCRYPT 1994, pp1–12. This technique allows visual information like pictures to be encrypted so that decryption can be done visually.The code outputs two files. Try printing them on two separate transparencies and putting them one on top of the other to see the hidden message. http://algorito.com/algorithm/visual-cryptography

Visual Cryptography 

Ajay- I think a combination of sharing and color ciphers would prove more helpful to secure Internet Communication than existing algorithms. It also levels the playing field from computationally rich players to creative coders.

Scribd Analytics

I really liked Scribd Analytics feature (and that we have racked up 3200 reads in 11 months for Poets and Hackers). I think Google Docs /Drive should really incorporate more Scribd like document sharing features including social (now that Slideshare is off the market for a relatively cheap $119m) and turn on analytics by default

I really liked the heatmap on the document feature in the second screenshot.

Anyways nice to see someone out there cares for Poets &….


Analytics 2012 Conference

from http://www.sas.com/events/analytics/us/index.html

Analytics 2012 Conference

SAS and more than 1,000 analytics experts gather at

Caesars Palace
Caesars Palace

Analytics 2012 Conference Details

Pre-Conference Workshops – Oct 7
Conference – Oct 8-9
Post-Conference Training – Oct 10-12
Caesars Palace, Las Vegas

Keynote Speakers

The following are confirmed keynote speakers for Analytics 2012. Jim Goodnight Since he co-founded SAS in 1976, Jim Goodnight has served as the company’s Chief Executive Officer.

William Hakes Dr. William Hakes is the CEO and co-founder of Link Analytics, an analytical technology company focused on mobile, energy and government verticals.

Tim Rey Tim Rey  has written over 100 internal papers, published 21 external papers, and delivered numerous keynote presentations and technical talks at various quantitative methods forums. Recently he has co-chaired both forecasting and data mining conferences. He is currently in the process of co-writing a book, Applied Data Mining for Forecasting.

http://www.sas.com/events/analytics/us/train.html

Pre-Conference

Plan to come to Analytics 2012 a day early and participate in one of the pre-conference workshops or take a SAS Certification exam. Prices for all of the preconference workshops, except for SAS Sentiment Analysis Studio: Introduction to Building Models and the Business Analytics Consulting Workshops, are included in the conference package pricing. You will be prompted to select your pre-conference training options when you register.

Sunday Morning Workshop

SAS Sentiment Analysis Studio: Introduction to Building Models

This course provides an introduction to SAS Sentiment Analysis Studio. It is designed for system designers, developers, analytical consultants and managers who want to understand techniques and approaches for identifying sentiment in textual documents.
View outline
Sunday, Oct. 7, 8:30a.m.-12p.m. – $250

Sunday Afternoon Workshops

Business Analytics Consulting Workshops

This workshop is designed for the analyst, statistician, or executive who wants to discuss best-practice approaches to solving specific business problems, in the context of analytics. The two-hour workshop will be customized to discuss your specific analytical needs and will be designed as a one-on-one session for you, including up to five individuals within your company sharing your analytical goal. This workshop is specifically geared for an expert tasked with solving a critical business problem who needs consultation for developing the analytical approach required. The workshop can be customized to meet your needs, from a deep-dive into modeling methods to a strategic plan for analytic initiatives. In addition to the two hours at the conference location, this workshop includes some advanced consulting time over the phone, making it a valuable investment at a bargain price.
View outline
Sunday, Oct. 7; 1-3 p.m. or 3:30-5:30 p.m. – $200

Demand-Driven Forecasting: Sensing Demand Signals, Shaping and Predicting Demand

This half-day lecture teaches students how to integrate demand-driven forecasting into the consensus forecasting process and how to make the current demand forecasting process more demand-driven.
View outline
Sunday, Oct. 7; 1-5 p.m.

Forecast Value Added Analysis

Forecast Value Added (FVA) is the change in a forecasting performance metric (such as MAPE or bias) that can be attributed to a particular step or participant in the forecasting process. FVA analysis is used to identify those process activities that are failing to make the forecast any better (or might even be making it worse). This course provides step-by-step guidelines for conducting FVA analysis – to identify and eliminate the waste, inefficiency, and worst practices from your forecasting process. The result can be better forecasts, with fewer resources and less management time spent on forecasting.
View outline
Sunday, Oct. 7; 1-5 p.m.

SAS Enterprise Content Categorization: An Introduction

This course gives an introduction to methods of unstructured data analysis, document classification and document content identification. The course also uses examples as the basis for constructing parse expressions and resulting entities.
View outline
Sunday, Oct. 7; 1-5 p.m.

Introduction to Data Mining and SAS Enterprise Miner

This course serves as an introduction to data mining and SAS Enterprise Miner for Desktop software. It is designed for data analysts and qualitative experts as well as those with less of a technical background who want a general understanding of data mining.
View outline
Sunday, Oct. 7, 1-5 p.m.

Modeling Trend, Cycles, and Seasonality in Time Series Data Using PROC UCM

This half-day lecture teaches students how to model, interpret, and predict time series data using UCMs. The UCM procedure analyzes and forecasts equally spaced univariate time series data using the unobserved components models (UCM). This course is designed for business analysts who want to analyze time series data to uncover patterns such as trend, seasonal effects, and cycles using the latest techniques.
View outline
Sunday, Oct. 7, 1-5 p.m.

SAS Rapid Predictive Modeler

This seminar will provide a brief introduction to the use of SAS Enterprise Guide for graphical and data analysis. However, the focus will be on using SAS Enterprise Guide and SAS Enterprise Miner along with the Rapid Predictive Modeling component to build predictive models. Predictive modeling will be introduced using the SEMMA process developed with the introduction of SAS Enterprise Miner. Several examples will be used to illustrate the use of the Rapid Predictive Modeling component, and interpretations of the model results will be provided.
View outline
Sunday, Oct. 7, 1-5 p.m

Analytics 2012 Conference

A nice conference from the grand old institution of Analytics,  SAS  Institute’s annual analytic pow-wow.

I especially like some of the trainings- and wonder if they could be stored as e-learning modules for students/academics to review

in SAS’s extensive and generous Online Education Program.

Sunday Morning Workshop

SAS Sentiment Analysis Studio: Introduction to Building Models

This course provides an introduction to SAS Sentiment Analysis Studio. It is designed for system designers, developers, analytical consultants and managers who want to understand techniques and approaches for identifying sentiment in textual documents.
View outline
Sunday, Oct. 7, 8:30a.m.-12p.m. – $250

Sunday Afternoon Workshops

Business Analytics Consulting Workshops

This workshop is designed for the analyst, statistician, or executive who wants to discuss best-practice approaches to solving specific business problems, in the context of analytics. The two-hour workshop will be customized to discuss your specific analytical needs and will be designed as a one-on-one session for you, including up to five individuals within your company sharing your analytical goal. This workshop is specifically geared for an expert tasked with solving a critical business problem who needs consultation for developing the analytical approach required. The workshop can be customized to meet your needs, from a deep-dive into modeling methods to a strategic plan for analytic initiatives. In addition to the two hours at the conference location, this workshop includes some advanced consulting time over the phone, making it a valuable investment at a bargain price.
View outline
Sunday, Oct. 7; 1-3 p.m. or 3:30-5:30 p.m. – $200

Demand-Driven Forecasting: Sensing Demand Signals, Shaping and Predicting Demand

This half-day lecture teaches students how to integrate demand-driven forecasting into the consensus forecasting process and how to make the current demand forecasting process more demand-driven.
View outline
Sunday, Oct. 7; 1-5 p.m.

Forecast Value Added Analysis

Forecast Value Added (FVA) is the change in a forecasting performance metric (such as MAPE or bias) that can be attributed to a particular step or participant in the forecasting process. FVA analysis is used to identify those process activities that are failing to make the forecast any better (or might even be making it worse). This course provides step-by-step guidelines for conducting FVA analysis – to identify and eliminate the waste, inefficiency, and worst practices from your forecasting process. The result can be better forecasts, with fewer resources and less management time spent on forecasting.
View outline
Sunday, Oct. 7; 1-5 p.m.

SAS Enterprise Content Categorization: An Introduction

This course gives an introduction to methods of unstructured data analysis, document classification and document content identification. The course also uses examples as the basis for constructing parse expressions and resulting entities.
View outline
Sunday, Oct. 7; 1-5 p.m.


You can see more on this yourself at –

http://www.sas.com/events/analytics/us/


Happy $100 Billion to Mark Zuckerberg Productions !

Heres to an expected $100 billion market valuation to the latest Silicon Valley Legend, Facebook- A Mark Zuckerberg Production.

Some milestones that made FB what it is-

1) Beating up MySpace, Ibibo, Google Orkut combined

2) Smart timely acquisitions from Friend feed , to Instagram

3) Superb infrastructure for 900 million accounts, fast interface rollouts, and a policy of never deleting data. Some of this involved creating new technology like Cassandra. There have been no anti-trust complaints against FB’s behavior particularly as it simply stuck to being the cleanest interface offering a social network

4) Much envied and copied features like Newsfeed, App development on the FB platform, Social Gaming as revenue streams

5) Replacing Google as the hot techie employer, just like Google did to Microsoft.

6) An uncanny focus, including walking away from a billion dollars from Yahoo,resisting Google, Apple’s Ping, imposing design changes unilaterally, implementing data sharing only with flexible partners  and strategic investors (like Bing)

FB has made more money for more people than any other company in the past ten years. Here’s wishing it an even more interesting next ten years! With 900 million users if they could integrate a PayPal like system, or create an alternative to Adsense for content creators, they could create an all new internet economy – one which is more open than the Google dominated internet ; 0


How to use Bit Torrents

I really liked the software Qbittorent available from http://www.qbittorrent.org/ I think bit torrents should be the default way of sharing huge content especially software downloads. For protecting intellectual property there should be much better codes and software keys than presently available.

The qBittorrent project aims to provide a Free Software alternative to µtorrent. Additionally, qBittorrent runs and provides the same features on all major platforms (Linux, Mac OS X, Windows, OS/2, FreeBSD).

qBittorrent is based on Qt4 toolkit and libtorrent-rasterbar.

qBittorrent v2 Features

  • Polished µTorrent-like User Interface
  • Well-integrated and extensible Search Engine
    • Simultaneous search in most famous BitTorrent search sites
    • Per-category-specific search requests (e.g. Books, Music, Movies)
  • All Bittorrent extensions
    • DHT, Peer Exchange, Full encryption, Magnet/BitComet URIs, …
  • Remote control through a Web user interface
    • Nearly identical to the regular UI, all in Ajax
  • Advanced control over trackers, peers and torrents
    • Torrents queueing and prioritizing
    • Torrent content selection and prioritizing
  • UPnP / NAT-PMP port forwarding support
  • Available in ~25 languages (Unicode support)
  • Torrent creation tool
  • Advanced RSS support with download filters (inc. regex)
  • Bandwidth scheduler
  • IP Filtering (eMule and PeerGuardian compatible)
  • IPv6 compliant
  • Sequential downloading (aka “Download in order”)
  • Available on most platforms: Linux, Mac OS X, Windows, OS/2, FreeBSD
So if you are new to Bit Torrents- here is a brief tutorial
Some terminology from

Tracker

tracker is a server that keeps track of which seeds and peers are in the swarm.

Seed

Seed is used to refer to a peer who has 100% of the data. When a leech obtains 100% of the data, that peer automatically becomes a Seed.

Peer

peer is one instance of a BitTorrent client running on a computer on the Internet to which other clients connect and transfer data.

Leech

leech is a term with two meanings. Primarily leech (or leeches) refer to a peer (or peers) who has a negative effect on the swarm by having a very poor share ratio (downloading much more than they upload, creating a ratio less than 1.0)
1) Download and install the software from  http://www.qbittorrent.org/
2) If you want to search for new files, you can use the nice search features in here
3) If you want to CREATE new bit torrents- go to Tools -Torrent Creator
4) For sharing content- just seed the torrent you just created. What is seeding – hey did you read the terminology in the beginning?
5) Additionally –
From

Trackers: Below are some popular public trackers. They are servers which help peers to communicate.

Here are some good trackers you can use:


http://open.tracker.thepiratebay.org/announce
http://www.torrent-downloads.to:2710/announce
http://denis.stalker.h3q.com:6969/announce
udp://denis.stalker.h3q.com:6969/announce
http://www.sumotracker.com/announce

and

Super-seeding

When a file is new, much time can be wasted because the seeding client might send the same file piece to many different peers, while other pieces have not yet been downloaded at all. Some clients, like ABCVuzeBitTornado, TorrentStorm, and µTorrent have a “super-seed” mode, where they try to only send out pieces that have never been sent out before, theoretically making the initial propagation of the file much faster. However the super-seeding becomes less effective and may even reduce performance compared to the normal “rarest first” model in cases where some peers have poor or limited connectivity. This mode is generally used only for a new torrent, or one which must be re-seeded because no other seeds are available.
Note- you use this tutorial and any or all steps at your own risk. I am not legally responsible for any mishaps you get into. Please be responsible while being an efficient bit tor renter. That means respecting individual property rights.

Interview Michal Kosinski , Concerto Web Based App using #Rstats

Here is an interview with Michal Kosinski , leader of the team that has created Concerto – a web based application using R. What is Concerto? As per http://www.psychometrics.cam.ac.uk/page/300/concerto-testing-platform.htm

Concerto is a web based, adaptive testing platform for creating and running rich, dynamic tests. It combines the flexibility of HTML presentation with the computing power of the R language, and the safety and performance of the MySQL database. It’s totally free for commercial and academic use, and it’s open source

Ajay-  Describe your career in science from high school to this point. What are the various stats platforms you have trained on- and what do you think about their comparative advantages and disadvantages?  

Michal- I started with maths, but quickly realized that I prefer social sciences – thus after one year, I switched to a psychology major and obtained my MSc in Social Psychology with a specialization in Consumer Behaviour. At that time I was mostly using SPSS – as it was the only statistical package that was taught to students in my department. Also, it was not too bad for small samples and the rather basic analyses I was performing at that time.


My more recent research performed during my Mphil course in Psychometrics at Cambridge University followed by my current PhD project in social networks and research work at Microsoft Research, requires significantly more powerful tools. Initially, I tried to squeeze as much as possible from SPSS/PASW by mastering the syntax language. SPSS was all I knew, though I reached its limits pretty quickly and was forced to switch to R. It was a pretty dreary experience at the start, switching from an unwieldy but familiar environment into an unwelcoming command line interface, but I’ve quickly realized how empowering and convenient this tool was.


I believe that a course in R should be obligatory for all students that are likely to come close to any data analysis in their careers. It is really empowering – once you got the basics you have the potential to use virtually any method there is, and automate most tasks related to analysing and processing data. It is also free and open-source – so you can use it wherever you work. Finally, it enables you to quickly and seamlessly migrate to other powerful environments such as Matlab, C, or Python.

Ajay- What was the motivation behind building Concerto?

Michal- We deal with a lot of online projects at the Psychometrics Centre – one of them attracted more than 7 million unique participants. We needed a powerful tool that would allow researchers and practitioners to conveniently build and deliver online tests.

Also, our relationships with the website designers and software engineers that worked on developing our tests were rather difficult. We had trouble successfully explaining our needs, each little change was implemented with a delay and at significant cost. Not to mention the difficulties with embedding some more advanced methods (such as adaptive testing) in our tests.

So we created a tool allowing us, psychometricians, to easily develop psychometric tests from scratch an publish them online. And all this without having to hire software developers.

Ajay -Why did you choose R as the background for Concerto? What other languages and platforms did you consider. Apart from Concerto, how else do you utilize R in your center, department and University?

Michal- R was a natural choice as it is open-source, free, and nicely integrates with a server environment. Also, we believe that it is becoming a universal statistical and data processing language in science. We put increasing emphasis on teaching R to our students and we hope that it will replace SPSS/PASW as a default statistical tool for social scientists.

Ajay -What all can Concerto do besides a computer adaptive test?

Michal- We did not plan it initially, but Concerto turned out to be extremely flexible. In a nutshell, it is a web interface to R engine with a built-in MySQL database and easy-to-use developer panel. It can be installed on both Windows and Unix systems and used over the network or locally.

Effectively, it can be used to build any kind of web application that requires a powerful and quickly deployable statistical engine. For instance, I envision an easy to use website (that could look a bit like SPSS) allowing students to analyse their data using a web browser alone (learning the underlying R code simultaneously). Also, the authors of R libraries (or anyone else) could use Concerto to build user-friendly web interfaces to their methods.

Finally, Concerto can be conveniently used to build simple non-adaptive tests and questionnaires. It might seem to be slightly less intuitive at first than popular questionnaire services (such us my favourite Survey Monkey), but has virtually unlimited flexibility when it comes to item format, test flow, feedback options, etc. Also, it’s free.

Ajay- How do you see the cloud computing paradigm growing? Do you think browser based computation is here to stay?

Michal – I believe that cloud infrastructure is the future. Dynamically sharing computational and network resources between online service providers has a great competitive advantage over traditional strategies to deal with network infrastructure. I am sure the security concerns will be resolved soon, finishing the transformation of the network infrastructure as we know it. On the other hand, however, I do not see a reason why client-side (or browser) processing of the information should cease to exist – I rather think that the border between the cloud and personal or local computer will continually dissolve.

About

Michal Kosinski is Director of Operations for The Psychometrics Centre and Leader of the e-Psychometrics Unit. He is also a research advisor to the Online Services and Advertising group at the Microsoft Research Cambridge, and a visiting lecturer at the Department of Mathematics in the University of Namur, Belgium. You can read more about him at http://www.michalkosinski.com/

You can read more about Concerto at http://code.google.com/p/concerto-platform/ and http://www.psychometrics.cam.ac.uk/page/300/concerto-testing-platform.htm