Interview Alain Chesnais Chief Scientist Trendspottr.com

Here is a brief interview with Alain Chesnais ,Chief Scientist  Trendspottr.com. It is a big honor to interview such a legend in computer science, and I am grateful to both him and Mark Zohar for taking time to write these down.
alain_chesnais2.jpg

Ajay-  Describe your career from your student days to being the President of ACM (Association of Computing Machinery http://www.acm.org/ ). How can we increase  the interest of students in STEM education, particularly in view of the shortage of data scientists.
 
Alain- I’m trying to sum up a career of over 35 years. This may be a bit long winded…
I started my career in CS when I was in high school in the early 70’s. I was accepted in the National Science Foundation’s Science Honors Program in 9th grade and the first course I took was a Fortran programming course at Columbia University. This was on an IBM 360 using punch cards.
The next year my high school got a donation from DEC of a PDP-8E mini computer. I ended up spending a lot of time in the machine room all through high school at a time when access to computers wasn’t all that common. I went to college in Paris and ended up at l’Ecole Normale Supérieure de Cachan in the newly created Computer Science department.
My first job after finishing my graduate studies was as a research assistant at the Centre National de la Recherche Scientifique where I focused my efforts on modelling the behaviour of distributed database systems in the presence of locking. When François Mitterand was elected president of France in 1981, he invited Nicholas Negroponte and Seymour Papert to come to France to set up the Centre Mondial Informatique. I was hired as a researcher there and continued on to become director of software development until it was closed down in 1986. I then started up my own company focusing on distributed computer graphics. We sold the company to Abvent in the early 90’s.
After that, I was hired by Thomson Digital Image to lead their rendering team. We were acquired by Wavefront Technologies in 1993 then by SGI in 1995 and merged with Alias Research. In the merged company: Alias|wavefront, I was director of engineering on the Maya project. Our team received an Oscar in 2003 for the creation of the Maya software system.
Since then I’ve worked at various companies, most recently focusing on social media and Big Data issues associated with it. Mark Zohar and I worked together at SceneCaster in 2007 where we developed a Facebook app that allowed users to create their own 3D scenes and share them with friends via Facebook without requiring a proprietary plugin. In December 2007 it was the most popular app in its category on Facebook.
Recently Mark approached me with a concept related to mining the content of public tweets to determine what was trending in real time. Using math similar to what I had developed during my graduate studies to model the performance of distributed databases in the presence of locking, we built up a real time analytics engine that ranks the content of tweets as they stream in. The math is designed to scale linearly in complexity with the volume of data that we analyze. That is the basis for what we have created for TrendSpottr.
In parallel to my professional career, I have been a very active volunteer at ACM. I started out as a member of the Paris ACM SIGGRAPH chapter in 1985 and volunteered to help do our mailings (snail mail at the time). After taking on more responsibilities with the chapter, I was elected chair of the chapter in 1991. I was first appointed to the SIGGRAPH Local Groups Steering Committee, then became ACM Director for Chapters. Later I was successively elected SIGGRAPH Vice Chair, ACM SIG Governing Board (SGB) Vice Chair for Operations, SGB Chair, ACM SIGGRAPH President, ACM Secretary/Treasurer, ACM Vice President, and finally, in 2010, I was elected ACM President. My term as ACM President has just ended on July 1st. Vint Cerf is our new President. I continue to serve on the ACM Executive Committee in my role as immediate Past President.
(Note- About ACM
ACM, the Association for Computing Machinery www.acm.org, is the world’s largest educational and scientific computing society, uniting computing educators, researchers and professionals to inspire dialogue, share resources and address the field’s challenges. )
Ajay- What sets Trendspotter apart from other startups out there in terms of vision in trying to achieve a more coherent experience on the web.
 
Alain- The Basic difference with other approaches that we are aware of is that we have developed an incremental solution that calculates the results on the fly as the data streams in. Our evaluators are based on solid mathematical foundations that have proven their usefulness over time. One way to describe what we do is to think of it as signal processing where the tweets are the signal and our evaluators are like triggers that tell you what elements of the signal have the characteristics that we are filtering for (velocity and acceleration). One key result of using this approach is that our unit cost per tweet analyzed does not go up with increased volume. Using more traditional data analysis approaches involving an implicit sort would imply a complexity of N*log(N), where N is the volume of tweets being analyzed. That would imply that the cost per tweet analyzed would go up with the volume of tweets. Our approach was designed to avoid that, so that we can maintain a cap on our unit costs of analysis, no matter what volume of data we analyze.
Ajay- What do you think is the future of big data visualization going to look like? What are some of the technologies that you are currently bullish on?
Alain- I see several trends that would have deep impact on Big Data visualization. I firmly believe that with large amounts of data, visualization is key tool for understanding both the structure and the relationships that exist between data elements. Let’s focus on some of the key things that are pushing in this direction:
  • the volume of data that is available is growing at a rate we have never seen before. Cisco has measured an 8 fold increase in the volume of IP traffic over the last 5 years and predicts that we will reach the zettabyte of data over IP in 2016
  • more of the data is becoming publicly available. This isn’t only on social networks such as Facebook and twitter, but joins a more general trend involving open research initiatives and open government programs
  • the desired time to get meaningful results is going down dramatically. In the past 5 years we have seen the half life of data on Facebook, defined as the amount of time that half of the public reactions to any given post (likes, shares., comments) take place, go from about 12 hours to under 3 hours currently
  • our access to the net is always on via mobile device. You are always connected.
  • the CPU and GPU capabilities of mobile devices is huge (an iPhone has 10 times the compute power of a Cray-1 and more graphics capabilities than early SGI workstations)
Put all of these observations together and you quickly come up with a massive opportunity to analyze data visually on the go as it happens no matter where you are. We can’t afford to have to wait for results. When something of interest occurs we need to be aware of it immediately.
Ajay- What are some of the applications we could use Trendspottr. Could we predict events like Arab Spring, or even the next viral thing.
 
Alain- TrendSpottr won’t predict what will happen next. What it *will* do is alert you immediately when it happens. You can think of it like a smoke detector. It doesn’t tell that a fire will take place, but it will save your life when a fire does break out.
Typical uses for TrendSpottr are
  • thought leadership by tracking content that your readership is interested in via TrendSpottr you can be seen as a thought leader on the subject by being one of the first to share trending content on a given subject. I personally do this on my Facebook page (http://www.facebook.com/alain.chesnais) and have seen my klout score go up dramatically as a result
  • brand marketing to be able to know when something is trending about your brand and take advantage of it as it happens.
  • competitive analysis to see what is being said about two competing elements. For instance, searching TrendSpottr for “Obama OR Romney” gives you a very good understanding about how social networks are reacting to each politician. You can also do searches like “$aapl OR $msft OR $goog” to get a sense of what is the current buzz for certain hi tech stocks.
  • understanding your impact in real time to be able to see which of the content that you are posting is trending the most on social media so that you can highlight it on your main page. So if all of your content is hosted on common domain name (ourbrand.com), searching for ourbrand.com will show you the most active of your site’s content. That can easily be set up by putting a TrendSpottr widget on your front page

Ajay- What are some of the privacy guidelines that you keep in  mind- given the fact that you collect individual information but also have government agencies as potential users.

 
Alain- We take privacy very seriously and anonymize all of the data that we collect. We don’t keep explicit records of the data we collected through the various incoming streams and only store the aggregate results of our analysis.
About
Alain Chesnais is immediate Past President of ACM, elected for the two-year term beginning July 1, 2010.Chesnais studied at l’Ecole Normale Supérieure de l’Enseignement Technique and l’Université de Paris where he earned a Maîtrise de Mathematiques, a Maitrise de Structure Mathématique de l’Informatique, and a Diplôme d’Etudes Approfondies in Compuer Science. He was a high school student at the United Nations International School in New York, where, along with preparing his International Baccalaureate with a focus on Math, Physics and Chemistry, he also studied Mandarin Chinese.Chesnais recently founded Visual Transitions, which specializes in helping companies move to HTML 5, the newest standard for structuring and presenting content on the World Wide Web. He was the CTO of SceneCaster.com from June 2007 until April 2010, and was Vice President of Product Development at Tucows Inc. from July 2005 – May 2007. He also served as director of engineering at Alias|Wavefront on the team that received an Oscar from the Academy of Motion Picture Arts and Sciences for developing the Maya 3D software package.

Prior to his election as ACM president, Chesnais was vice president from July 2008 – June 2010 as well as secretary/treasurer from July 2006 – June 2008. He also served as president of ACM SIGGRAPH from July 2002 – June 2005 and as SIG Governing Board Chair from July 2000 – June 2002.

As a French citizen now residing in Canada, he has more than 20 years of management experience in the software industry. He joined the local SIGGRAPH Chapter in Paris some 20 years ago as a volunteer and has continued his involvement with ACM in a variety of leadership capacities since then.

About Trendspottr.com

TrendSpottr is a real-time viral search and predictive analytics service that identifies the most timely and trending information for any topic or keyword. Our core technology analyzes real-time data streams and spots emerging trends at their earliest acceleration point — hours or days before they have become “popular” and reached mainstream awareness.

TrendSpottr serves as a predictive early warning system for news and media organizations, brands, government agencies and Fortune 500 companies and helps them to identify emerging news, events and issues that have high viral potential and market impact. TrendSpottr has partnered with HootSuite, DataSift and other leading social and big data companies.

How to learn Hacking Part 2

Now that you have read the basics here at http://www.decisionstats.com/how-to-learn-to-be-a-hacker-easily/ (please do read this before reading the below)


Here is a list of tutorials that you should study (in order of ease)

1) LEARN BASICS – enough to get you a job maybe if that’s all you wanted.

http://www.offensive-security.com/metasploit-unleashed/Main_Page

2) READ SOME MORE-

Lena’s Reverse Engineering Tutorial-“Use Google.com  for finding the Tutorial

Lena’s Reverse Engineering tutorial. It includes 36 parts of individual cracking techniques and will teach you the basics of protection bypassing

01. Olly + assembler + patching a basic reverseme
02. Keyfiling the reverseme + assembler
03. Basic nag removal + header problems
04. Basic + aesthetic patching
05. Comparing on changes in cond jumps, animate over/in, breakpoints
06. “The plain stupid patching method”, searching for textstrings
07. Intermediate level patching, Kanal in PEiD
08. Debugging with W32Dasm, RVA, VA and offset, using LordPE as a hexeditor
09. Explaining the Visual Basic concept, introduction to SmartCheck and configuration
10. Continued reversing techniques in VB, use of decompilers and a basic anti-anti-trick
11. Intermediate patching using Olly’s “pane window”
12. Guiding a program by multiple patching.
13. The use of API’s in software, avoiding doublechecking tricks
14. More difficult schemes and an introduction to inline patching
15. How to study behaviour in the code, continued inlining using a pointer
16. Reversing using resources
17. Insights and practice in basic (self)keygenning
18. Diversion code, encryption/decryption, selfmodifying code and polymorphism
19. Debugger detected and anti-anti-techniques
20. Packers and protectors : an introduction
21. Imports rebuilding
22. API Redirection
23. Stolen bytes
24. Patching at runtime using loaders from lena151 original
25. Continued patching at runtime & unpacking armadillo standard protection
26. Machine specific loaders, unpacking & debugging armadillo
27. tElock + advanced patching
28. Bypassing & killing server checks
29. Killing & inlining a more difficult server check
30. SFX, Run Trace & more advanced string searching
31. Delphi in Olly & DeDe
32. Author tricks, HIEW & approaches in inline patching
33. The FPU, integrity checks & loader versus patcher
34. Reversing techniques in packed software & a S&R loader for ASProtect
35. Inlining inside polymorphic code
36. Keygenning

If you want more free training – hang around this website

http://www.owasp.org/index.php/Cheat_Sheets

OWASP Cheat Sheet Series

Draft OWASP Cheat Sheets

3) SPEND SOME MONEY on TRAINING

http://www.corelan-training.com/index.php/training/corelan-live/

Course overview

Module 1 – The x86 environment

  • System Architecture
  • Windows Memory Management
  • Registers
  • Introduction to Assembly
  • The stack

Module 2 – The exploit developer environment

  • Setting up the exploit developer lab
  • Using debuggers and debugger plugins to gather primitives

Module 3 – Saved Return Pointer Overwrite

  • Functions
  • Saved return pointer overwrites
  • Stack cookies

Module 4 – Abusing Structured Exception Handlers

  • Abusing exception handler overwrites
  • Bypassing Safeseh

Module 5 – Pointer smashing

  • Function pointers
  • Data/object pointers
  • vtable/virtual functions

Module 6 – Off-by-one and integer overflows

  • Off-by-one
  • Integer overflows

Module 7 – Limited buffers

  • Limited buffers, shellcode splitting

Module 8 – Reliability++ & reusability++

  • Finding and avoiding bad characters
  • Creative ways to deal with character set limitations

Module 9 – Fun with Unicode

  • Exploiting Unicode based overflows
  • Writing venetian alignment code
  • Creating and Using venetian shellcode

Module 10 – Heap Spraying Fundamentals

  • Heap Management and behaviour
  • Heap Spraying for Internet Explorer 6 and 7

Module 11 – Egg Hunters

  • Using and tweaking Egg hunters
  • Custom egghunters
  • Using Omelet egghunters
  • Egghunters in a WoW64 environment

Module 12 – Shellcoding

  • Building custom shellcode from scratch
  • Understanding existing shellcode
  • Writing portable shellcode
  • Bypassing Antivirus

Module 13 – Metasploit Exploit Modules

  • Writing exploits for the Metasploit Framework
  • Porting exploits to the Metasploit Framework

Module 14 – ASLR

  • Bypassing ASLR

Module 15 – W^X

  • Bypassing NX/DEP
  • Return Oriented Programming / Code Reuse (ROP) )

Module 16 – Advanced Heap Spraying

  • Heap Feng Shui & heaplib
  • Precise heap spraying in modern browsers (IE8 & IE9, Firefox 13)

Module 17 – Use After Free

  • Exploiting Use-After-Free conditions

Module 18 – Windows 8

  • Windows 8 Memory Protections and Bypass
TRAINING SCHEDULES AT

ALSO GET CERTIFIED http://www.offensive-security.com/information-security-training/penetration-testing-with-backtrack/ ($950 cost)

the syllabus is here at

http://www.offensive-security.com/documentation/penetration-testing-with-backtrack.pdf

4) HANG AROUND OTHER HACKERS

At http://attrition.org/attrition/

or The Noir  Hat Conferences-

http://blackhat.com/html/bh-us-12/training/bh-us-12-training_complete.html

or read this website

http://software-security.sans.org/developer-how-to/

5) GET A DEGREE

Yes it is possible


See http://web.jhu.edu/jhuisi/

The Johns Hopkins University Information Security Institute (JHUISI) is the University’s focal point for research and education in information security, assurance and privacy.

Scholarship Information


The Information Security Institute is now accepting applications for the Department of Defense’s Information Assurance Scholarship Program (IASP).  This scholarship includes full tuition, a living stipend, books and health insurance. In return each student recipient must work for a DoD agency at a competitive salary for six months for every semester funded. The scholarship is open to American citizens only.

http://web.jhu.edu/jhuisi/mssi/index.html

MASTER OF SCIENCE IN SECURITY INFORMATICS PROGRAM

The flagship educational experience offered by Johns Hopkins University in the area of information security and assurance is represented by the Master of Science in Security Informatics degree.  Over thirty courses are available in support of this unique and innovative graduate program.

———————————————————–

Disclaimer- I havent done any of these things- This is just a curated list from Quora  so I am open to feedback.

You use this at your own risk of conscience ,local legal jurisdictions and your own legal liability.


Global Warfare on Google Plus

Global Warfare is one of the latest games on Google Plus. There are lots of similarities between this game and Evony at http://evony.com

Global Warfare is made by Kabam https://www.kabam.com/games/global-warfare which is making a total of 3 games for Google Plus (out of 18) and it has Google Ventures as a strategic investor as well (and a member on the board). Google is clearly wanting to bet on online gaming with its earlier strategic investment in Zynga as well. It also acquired http://www.labpixies.com/  (which makes the game Sudoko Puzzles and Flood It but it has more games in reserve as can be seen at https://market.android.com/search?q=labpixies, so clearly G+ is being selective on Games directory at https://plus.google.com/games/directory)

With these gaming companies and others like http://www.digitalchocolate.com/about/ and http://www.rovio.com/index.php?page=company and http://www.popcap.com/ – well they are all there on G+

is gaming the ace in hand in G+ plans for Facebook- time will tell.

Evony of course was a very good game, as it was also very similar (allegedly) to Civilization, and though its advertising campaign of semi clad characters draws flak, it got the worlds attention and recall. While Evony was situated in medieval world,  Global Warfare is a modern warfare equivalent.

Features in Global Warfare-

  • Alliances,
  • multiple player online gaming,
  • social sharing and rewards,
  • in game purchases,
  •  persistent world

Some drawbacks-

  • Slight clutter in gaming space (and lack of nice fonts!)
  • Lack of help forums (or easy availability)
  • Lack of in game search for searching or navigating alliances
Overall- a nice addition to the G+ family of games


Review of Google Plus

After resisting for two weeks I have decided to write a Google Plus review. This includes both the changed designed parameters, the invite growth features and all of the main sub-items and activities you can do in the G+  Stream, Share, Hang Out, Pictures, Circles.

Since I have 2500 people in my circles and I am in 91 circles

To keep it simple – I have noted the following 6 main sub-points.

1) Content Dissemination-


  • Sharing Blog Articles
  • Micro-Blogging
  • Sharing Pictures

2) Online Professional Networking  and 3) Online Personal Socializing

4) Spam Control / Malware /Phishing/Porn Protection

5) Time Cost versus Networking Benefit

————————————————————————————————————————————————————–

1) Content Dissemination-

  • Sharing Blog Articles


Sharing is as simple as Facebook but the design makes it simpler.

Note G+ uses lower number of colors, bigger fonts, slightly bigger icons to reduce the appearance of clutter.

Contrast this

with this-


Interesting to see that G+ has four types of media to share- besides writing the status/micro-blog (unfettered by 140 characters). Note these show icons only with hover text to tell you what the icon stands for.

Photo,Video,URL,Location (which seems to be Twitter like in every share)

Facebook has 5 types of Sharing and note the slightly different order as well the fact that both icon and text make it slightly more cluttered- Status (which is redundant clearly ),Photo,Link,Video,Question

G+ thus lacks polls /questions features. It is much easier to share content on Facebook automatically as of now- but for G+ you need to share the URL privately though. There exist G+ meme-s already thanks to re-sharing in G+ plus which seems to be inspired by Tumblr (?).

In addition Google has made your Google Profile the number one SERP for searching your name, so there seem clear tied in benefits of SEO with content disseminated here.

G+ has sharing in circles whereas Facebook has only Everyone, Friends, Friends of Friends ,Customize.  This makes G+ interface slightly better in tweaking the spread of content to targeted audience esp by Bloggers.

  • For sharing Photos– G+ goes in for a whole new separate tab (one out of four) whereas Facebook treats photo sharing less prominently.
  • Google has lesser white space between photos, (The Facebook way used to be just snap photo by iPhone and send by email to auto-post), and the privacy in sharing photos is much better in G+ as the dropdowns in Facebook are not as granular and neither as nifty in icon design.
  •  
  • Also I like the hover and photo grows bigger feature and the auto import from Picassa (but I would like to auto-import into G+ from Flickr just as I can do in Facebook)
  • Google Plus also has a much more detailed version for sharing videos than photos as compared to Facebook  -upload Photo options  versus
  • G+ has much more focus on auto-sharing from mobiles


2) Online Professional Networking  and 3) Online Personal Socializing Organizing Contacts in Google Plus and seperate privacy controls make it easier to customize sharing without getting too complex. You can make as many circles and drag and drop very easily instead of manually clicking a dropdown box. Effectively speaking Facebook has just 4 kinds of circles and it does not distinguish between various types of friends which is great from philosophical point of view but not so goodn enforcing separateness between professional and personal networks. Note Facebook privacy settings are overwhelming despite the groovy data viz

4) Spam Control / Malware /Phishing/Porn Protection 

Spam Control in Facebook versus in Google Plus- note the different options in Google Plus (including the ability to NOT reshare). I am not aware of more enhanced protection than the ones available for Gmail already. Spam is what really killed off a lot many social networks and the ability to control or reduce spam will be a critical design choice

5) Time Cost versus Networking Benefit

Linkedin has the lowest cost in time spent and networking done. If G+ adds a resume section for jobs, recruiters, and adds in Zynga games, the benefit from G+ will expand. As of now G+ is a minimal social network with minimalism as design ethos.

(Zynga would do well to partner with G+)


Google Storage for Developers goes into Enterprise Mode

Schematic representation of the SSL handshake ...
Image via Wikipedia

To help unify and uniform, collobrative work and data management and business models across the enterprise in secure SSL cloud environments- Google Storage has been rolling out some changes (read below)-this also gives you more options on the day Amazon goes ahem down (cough cough) because they didn’t think someone in their data environment could be sympathetic to free data.

——————————————————————————————————————————————————————–

https://groups.google.com/group/gs-announce

And now to the actual update.

We’re making some changes to Google Storage for Developers to make team-based development easier. As part of this work, we are introducing the concept of a project. In preparation for this feature, we will be creating projects for every user and migrating their buckets to it.

What does this mean for you?

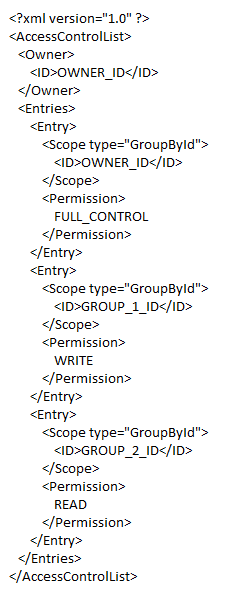
Everything will continue to work as it always has. However, you will notice that if you perform a get-acl operation on any of your buckets, you will see extra ACL entries. These entries correspond to project groups. Each group has only one member – the person who owned the buckets before the bucket migration;  no additional rights have been granted to any of your buckets or objects. You should preserve these new ACL grants if you modify bucket ACLs.

An example entry for a modified ACL would look like this:

We’ll be rolling out these changes over the next few days,

http://blog.cloudberrylab.com/2011/04/cloudberry-explorer-for-google-storage.html

Detailed Note on GS-

https://code.google.com/apis/storage/

Google Storage for Developers is a RESTful service for storing and accessing your data on Google’s infrastructure. The service combines the performance and scalability of Google’s cloud with advanced security and sharing capabilities. Highlights include:

Fast, scalable, highly available object store

  • All data replicated to multiple U.S. data centers
  • Read-your-writes data consistency
  • Objects of hundreds of gigabytes in size per request with range-get support
  • Domain-scoped bucket namespace

Easy, flexible authentication and sharing

  • Key-based authentication
  • Authenticated downloads from a web browser
  • Individual- and group-level access controls

In addition, Google Storage for Developers offers a web-based interface for managing your storage and GSUtil, an open source command line tool and library. The service is also compatible with many existing cloud storage tools and libraries. With pay-as-you-go pricing, it’s easy to get started and scale as your needs grow.

Google Storage for Developers is currently only available to a limited number of developers. Please sign up to join the waiting list.

Why search optimization can make you like Rebecca Black

Felicia Day, actress and web content producer.
Image via Wikipedia

A highly optimized blog post or web content can get you a lot of attention just like Rebecca Black’s video (provided it passes through the new quality metrics \change*/ in the Search Engine)

But if the underlying content is weak, or based on a shoddy understanding of the content-it can drive lots of horrid comments as well as ensuring that bad word of mouth is spread about the content or you/despite your hard work.

An example of this is copy and paste journalism especially in technology circles, where even a bigger Page Ranked website /blog can get away with scraping or stealing content from a lower page ranked website (or many websites)  after adding a cursory “expert comment”. This is also true when someone who is basically a corporate communication specialist (or PR -public relations) person is given a techinical text and encourage to write about it without completely understanding it.

A mild technical defect in the search engine algorithm is that it does not seem to pay attention to when the content was published, so the copying website or blog actually can get by as fresher content even if it is practically has 90% of the same words). The second flaw is over punishment or manual punishment of excessive linking – this can encourage search optimization minded people to hoard links or discourage trackbacks.

A free internet is one which promotes free sharing of content and does not encourage stealing or un-authorized scraping or content copying. Unfortunately current search engine optimization can encourage scraping and content copying without paying too much attention to origin of the words.

In addition the analytical rigor by which search algorithms search your inboxes (as in search all emails for a keyword) or media rich sites (like Youtube) are quite on a different level of quality altogether. The chances of garbage results are much more while searching for media content and/or emails.

Using Views in R and comparing functions across multiple packages

Some RDF hacking relating to updating probabil...
Image via Wikipedia

R has almost 2923 available packages

This makes the task of searching among these packages and comparing functions for the same analytical task across different packages a bit tedious and prone to manual searching (of reading multiple Pdfs of help /vignette of packages) or sending an email to the R help list.

However using R Views is a slightly better way of managing all your analytical requirements for software rather than the large number of packages (see Graphics view below).

CRAN Task Views allow you to browse packages by topic and provide tools to automatically install all packages for special areas of interest. Currently, 28 views are available. http://cran.r-project.org/web/views/

Bayesian Bayesian Inference
ChemPhys Chemometrics and Computational Physics
ClinicalTrials Clinical Trial Design, Monitoring, and Analysis
Cluster Cluster Analysis & Finite Mixture Models
Distributions Probability Distributions
Econometrics Computational Econometrics
Environmetrics Analysis of Ecological and Environmental Data
ExperimentalDesign Design of Experiments (DoE) & Analysis of Experimental Data
Finance Empirical Finance
Genetics Statistical Genetics
Graphics Graphic Displays & Dynamic Graphics & Graphic Devices & Visualization
gR gRaphical Models in R
HighPerformanceComputing High-Performance and Parallel Computing with R
MachineLearning Machine Learning & Statistical Learning
MedicalImaging Medical Image Analysis
Multivariate Multivariate Statistics
NaturalLanguageProcessing Natural Language Processing
OfficialStatistics Official Statistics & Survey Methodology
Optimization Optimization and Mathematical Programming
Pharmacokinetics Analysis of Pharmacokinetic Data
Phylogenetics Phylogenetics, Especially Comparative Methods
Psychometrics Psychometric Models and Methods
ReproducibleResearch Reproducible Research
Robust Robust Statistical Methods
SocialSciences Statistics for the Social Sciences
Spatial Analysis of Spatial Data
Survival Survival Analysis
TimeSeries Time Series Analysis

To automatically install these views, the ctv package needs to be installed, e.g., via

install.packages("ctv")
library("ctv")
Created by Pretty R at inside-R.org


and then the views can be installed via install.views or update.views (which first assesses which of the packages are already installed and up-to-date), e.g.,

install.views("Econometrics")
 update.views("Econometrics")
 Created by Pretty R at inside-R.org

CRAN Task View: Graphic Displays & Dynamic Graphics & Graphic Devices & Visualization

Maintainer: Nicholas Lewin-Koh
Contact: nikko at hailmail.net
Version: 2009-10-28

R is rich with facilities for creating and developing interesting graphics. Base R contains functionality for many plot types including coplots, mosaic plots, biplots, and the list goes on. There are devices such as postscript, png, jpeg and pdf for outputting graphics as well as device drivers for all platforms running R. lattice and grid are supplied with R’s recommended packages and are included in every binary distribution. lattice is an R implementation of William Cleveland’s trellis graphics, while grid defines a much more flexible graphics environment than the base R graphics.

R’s base graphics are implemented in the same way as in the S3 system developed by Becker, Chambers, and Wilks. There is a static device, which is treated as a static canvas and objects are drawn on the device through R plotting commands. The device has a set of global parameters such as margins and layouts which can be manipulated by the user using par() commands. The R graphics engine does not maintain a user visible graphics list, and there is no system of double buffering, so objects cannot be easily edited without redrawing a whole plot. This situation may change in R 2.7.x, where developers are working on double buffering for R devices. Even so, the base R graphics can produce many plots with extremely fine graphics in many specialized instances.

One can quickly run into trouble with R’s base graphic system if one wants to design complex layouts where scaling is maintained properly on resizing, nested graphs are desired or more interactivity is needed. grid was designed by Paul Murrell to overcome some of these limitations and as a result packages like latticeggplot2vcd or hexbin (on Bioconductor ) use grid for the underlying primitives. When using plots designed with grid one needs to keep in mind that grid is based on a system of viewports and graphic objects. To add objects one needs to use grid commands, e.g., grid.polygon() rather than polygon(). Also grid maintains a stack of viewports from the device and one needs to make sure the desired viewport is at the top of the stack. There is a great deal of explanatory documentation included with grid as vignettes.

The graphics packages in R can be organized roughly into the following topics, which range from the more user oriented at the top to the more developer oriented at the bottom. The categories are not mutually exclusive but are for the convenience of presentation:

  • Plotting : Enhancements for specialized plots can be found in plotrix, for polar plotting, vcd for categorical data, hexbin (on Bioconductor ) for hexagon binning, gclus for ordering plots and gplots for some plotting enhancements. Some specialized graphs, like Chernoff faces are implemented in aplpack, which also has a nice implementation of Tukey’s bag plot. For 3D plots latticescatterplot3d and misc3d provide a selection of plots for different kinds of 3D plotting. scatterplot3d is based on R’s base graphics system, while misc3d is based on rgl. The package onion for visualizing quaternions and octonions is well suited to display 3D graphics based on derived meshes.
  • Graphic Applications : This area is not much different from the plotting section except that these packages have tools that may not for display, but can aid in creating effective displays. Also included are packages with more esoteric plotting methods. For specific subject areas, like maps, or clustering the excellent task views contributed by other dedicated useRs is an excellent place to start.
    • Effect ordering : The gclus package focuses on the ordering of graphs to accentuate cluster structure or natural ordering in the data. While not for graphics directly cba and seriation have functions for creating 1 dimensional orderings from higher dimensional criteria. For ordering an array of displays, biclust can be useful.
    • Large Data Sets : Large data sets can present very different challenges from moderate and small datasets. Aside from overplotting, rendering 1,000,000 points can tax even modern GPU’s. For univariate datalvplot produces letter value boxplots which alleviate some of the problems that standard boxplots exhibit for large data sets. For bivariate data ash can produce a bivariate smoothed histogram very quickly, and hexbin, on Bioconductor , can bin bivariate data onto a hexagonal lattice, the advantage being that the irregular lines and orientation of hexagons do not create linear artifacts. For multivariate data, hexbin can be used to create a scatterplot matrix, combined with lattice. An alternative is to use scagnostics to produce a scaterplot matrix of “data about the data”, and look for interesting combinations of variables.
    • Trees and Graphs ape and ade4 have functions for plotting phylogenetic trees, which can be used for plotting dendrograms from clustering procedures. While these packages produce decent graphics, they do not use sophisticated algorithms for node placement, so may not be useful for very large trees. igraph has the Tilford-Rheingold algorithm implementead and is useful for plotting larger trees. diagram as facilities for flow diagrams and simple graphs. For more sophisticated graphs Rgraphviz and igraph have functions for plotting and layout, especially useful for representing large networks.
  • Graphics Systems lattice is built on top of the grid graphics system and is an R implementation of William Cleveland’s trellis system for S-PLUS. lattice allows for building many types of plots with sophisticated layouts based on conditioning. ggplot2 is an R implementation of the system described in “A Grammar of Graphics” by Leland Wilkinson. Like latticeggplot (also built on top of grid) assists in trellis-like graphics, but allows for much more. Since it is built on the idea of a semantics for graphics there is much more emphasis on reshaping data, transformation, and assembling the elements of a plot.
  • Devices : Whereas grid is built on top of the R graphics engine, many in the R community have found the R graphics engine somewhat inflexible and have written separate device drivers that either emphasize interactivity or plotting in various graphics formats. R base supplies devices for PostScript, PDF, JPEG and other formats. Devices on CRAN include cairoDevice which is a device based libcairo, which can actually render to many device types. The cairo device is desgned to work with RGTK2, which is an interface to the Gimp Tool Kit, similar to pyGTK2. GDD provides device drivers for several bitmap formats, including GIF and BMP. RSvgDevice is an SVG device driver and interfaces well with with vector drawing programs, or R web development packages, such as Rpad. When SVG devices are for web display developers should be aware that internet explorer does not support SVG, but has their own standard. Trust Microsoft. rgl provides a device driver based on OpenGL, and is good for 3D and interactive development. Lastly, the Augsburg group supplies a set of packages that includes a Java-based device, JavaGD.
  • Colors : The package colorspace provides a set of functions for transforming between color spaces and mixcolor() for mixing colors within a color space. Based on the HCL colors provided in colorspacevcdprovides a set of functions for choosing color palettes suitable for coding categorical variables ( rainbow_hcl()) and numerical information ( sequential_hcl()diverge_hcl()). Similar types of palettes are provided in RColorBrewer and dichromat is focused on palettes for color-impaired viewers.
  • Interactive Graphics : There are several efforts to implement interactive graphics systems that interface well with R. In an interactive system the user can interactively query the graphics on the screen with the mouse, or a moveable brush to zoom, pan and query on the device as well as link with other views of the data. rggobi embeds the GGobi interactive graphics system within R, so that one can display a data frame or several in GGobi directly from R. The package has functions to support longitudinal data, and graphs using GGobi’s edge set functionality. The RoSuDA repository maintained and developed by the University of Augsburg group has two packages, iplots and iwidgets as well as their Java development environment including a Java device, JavaGD. Their interactive graphics tools contain functions for alpha blending, which produces darker shading around areas with more data. This is exceptionally useful for parallel coordinate plots where many lines can quickly obscure patterns. playwith has facilities for building interactive versions of R graphics using the cairoDevice and RGtk2. Lastly, the rgl package has mechanisms for interactive manipulation of plots, especially 3D rotations and surfaces.
  • Development : For development of specialized graphics packages in R, grid should probably be the first consideration for any new plot type. rgl has better tools for 3D graphics, since the device is interactive, though it can be slow. An alternative is to use Java and the Java device in the RoSuDA packages, though Java has its own drawbacks. For porting plotting code to grid, using the package gridBase presents a nice intermediate step to embed base graphics in grid graphics and vice versa.