KDNuggets Survey on R

CRISP-DM
Image via Wikipedia

From http://www.kdnuggets.com/2011/03/new-poll-r-in-analytics-data-mining-work.html?k11n07

A new poll/survey on actual usage of R in Data Mining

R has been steadily growing in popularity among data miners and analytic professionals.

In KDnuggets 2010 Data Mining / Analytic Tools Poll, R was used by 30% of respondents.
In 2010 Rexer Analytics Data Miner SurveyR was the most popular tool, used by 43% of the data miners.

Another aspect of tool usefulness is how much does it help with the entire data mining process from data preparation and cleaning, modeling, evaluation, visualization and presentation (excluding deployment).

New KDnuggets Poll is asking:
What part of your analytics / data mining work in the past 12 months was done in R?

http://www.kdnuggets.com/2011/03/new-poll-r-in-analytics-data-mining-work.html?k11n07


HIGHLIGHTS from REXER Survey :R gives best satisfaction

Simple graph showing hierarchical clustering. ...
Image via Wikipedia

A Summary report from Rexer Analytics Annual Survey


HIGHLIGHTS from the 4th Annual Data Miner Survey (2010):


•   FIELDS & GOALS: Data miners work in a diverse set of fields.  CRM / Marketing has been the #1 field in each of the past four years.  Fittingly, “improving the understanding of customers”, “retaining customers” and other CRM goals are also the goals identified by the most data miners surveyed.


•   ALGORITHMS: Decision trees, regression, and cluster analysis continue to form a triad of core algorithms for most data miners.  However, a wide variety of algorithms are being used.  This year, for the first time, the survey asked about Ensemble Models, and 22% of data miners report using them.
A third of data miners currently use text mining and another third plan to in the future.


•   MODELS: About one-third of data miners typically build final models with 10 or fewer variables, while about 28% generally construct models with more than 45 variables.


•   TOOLS: After a steady rise across the past few years, the open source data mining software R overtook other tools to become the tool used by more data miners (43%) than any other.  STATISTICA, which has also been climbing in the rankings, is selected as the primary data mining tool by the most data miners (18%).  Data miners report using an average of 4.6 software tools overall.  STATISTICA, IBM SPSS Modeler, and R received the strongest satisfaction ratings in both 2010 and 2009.


•   TECHNOLOGY: Data Mining most often occurs on a desktop or laptop computer, and frequently the data is stored locally.  Model scoring typically happens using the same software used to develop models.  STATISTICA users are more likely than other tool users to deploy models using PMML.


•   CHALLENGES: As in previous years, dirty data, explaining data mining to others, and difficult access to data are the top challenges data miners face.  This year data miners also shared best practices for overcoming these challenges.  The best practices are available online.


•   FUTURE: Data miners are optimistic about continued growth in the number of projects they will be conducting, and growth in data mining adoption is the number one “future trend” identified.  There is room to improve:  only 13% of data miners rate their company’s analytic capabilities as “excellent” and only 8% rate their data quality as “very strong”.


Please contact us if you have any questions about the attached report or this annual research program.  The 5th Annual Data Miner Survey will be launching next month.  We will email you an invitation to participate.


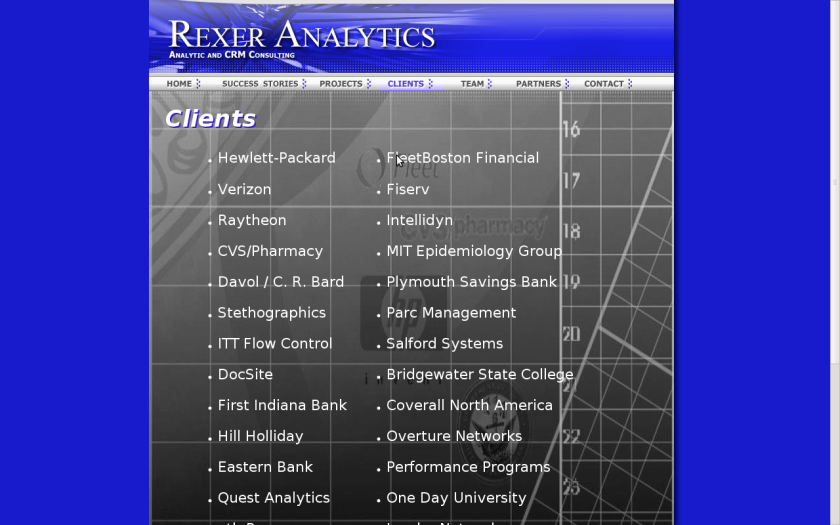
Information about Rexer Analytics is available at www.RexerAnalytics.com. Rexer Analytics continues their impressive journey see http://www.rexeranalytics.com/Clients.html

|My only thought- since most data miners are using multiple tools including free tools as well as paid software, Perhaps a pie chart of market share by revenue and volume would be handy.

Also some ideas on comparing diverse data mining projects by data size, or complexity.


PAW Videos

A message from Predictive Analytics World on  newly available videos. It has many free videos as well so you can check them out.

Predictive Analytics World March 2011 in San Francisco

Access PAW DC Session Videos Now

Predictive Analytics World is pleased to announce on-demand access to the videos of PAW Washington DC, October 2010, including over 30 sessions and keynotes that you may view at your convenience. Access this leading predictive analytics content online now:

View the PAW DC session videos online

Register by January 18th and receive $150 off the full 2-day conference program videos (enter code PAW150 at checkout)

Trial videos – view the following for no charge:

Select individual conference sessions, or recognize savings by registering for access to one or two full days of sessions. These on-demand videos deliver PAW DC right to your desk, covering hot topics and advanced methods such as:

Social data 

Text mining

Search marketing

Risk management

Survey analysis

Consumer privacy

Sales force optimization

Response & cross-sell

Recommender systems

Featuring experts such as:
Usama Fayyad, Ph.D.
CEO, Open Insights Former Chief Data Officer, Yahoo!

Andrew Pole
Sr Mgr, Media/DB Mktng
Target
View Keynote for Free

John F. Elder, Ph.D.
CEO and Founder
Elder Research

Bruno Aziza
Director, Worldwide Strategy Lead, BI
Microsoft

Eric Siegel, Ph.D.
Conference Chair
Predictive Analytics World

PAW DC videos feature over 25 speakers with case studies from leading enterprises such as: CIBC, CEB, Forrester, Macy’s, MetLife, Microsoft, Miles Kimball, Monster.com, Oracle, Paychex, SunTrust, Target, UPMC, Xerox, Yahoo!, YMCA, and more.

How video access works:

View Slides on the Left See & Hear Speaker in the Right Window

Sign up by January 18 for immediate video access and $150 discount


San Francisco
March 14-15, 2011
Washington DC
October, 2011
London
November, 2011
Contact Us

Produced by:


Session Gallery: Day 1 of 2

Viewing (17) Sessions of (31)


keynote.jpg
Add to Cart
Keynote: Five Ways Predictive Analytics Cuts Enterprise Risk  

Eric Siegel, Ph.D., Program Chair, Predictive Analytics World

All business is an exercise in risk management. All organizations would benefit from measuring, tracking and computing risk as a core process, much like insurance companies do.

Predictive analytics does the trick, one customer at a time. This technology is a data-driven means to compute the risk each customer will defect, not respond to an expensive mailer, consume a retention discount even if she were not going to leave in the first place, not be targeted for a telephone solicitation that would have landed a sale, commit fraud, or become a “loss customer” such as a bad debtor or an insurance policy-holder with high claims.

In this keynote session, Dr. Eric Siegel reveals:

– Five ways predictive analytics evolves your enterprise to reduce risk

– Hidden sources of risk across operational functions

– What every business should learn from insurance companies

– How advancements have reversed the very meaning of fraud

– Why “man + machine” teams are greater than the sum of their parts for enterprise decision support

Length – 00:45:57 | Email to a Colleague

Price: $195


sponsor.jpg
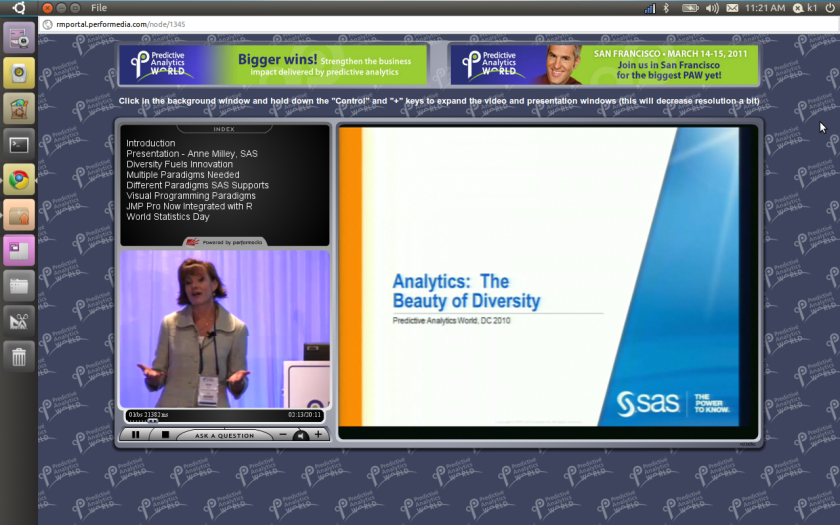
Play video of session: Platinum Sponsor Presentation, Analytics: The Beauty of Diversity
Platinum Sponsor Presentation: Analytics – The Beauty of Diversity 

Anne H. Milley, Senior Director of Analytic Strategy, Worldwide Product Marketing, SAS

Analytics contributes to, and draws from, multiple disciplines. The unifying theme of “making the world a better place” is bred from diversity. For instance, the same methods used in econometrics might be used in market research, psychometrics and other disciplines. In a similar way, diverse paradigms are needed to best solve problems, reveal opportunities and make better decisions. This is why we evolve capabilities to formulate and solve a wide range of problems through multiple integrated languages and interfaces. Extending that, we have provided integration with other languages so that users can draw on the disciplines and paradigms needed to best practice their craft.

Length – 20:11 | Email to a Colleague

Free viewing enabled – no charge


gold sponsor.jpg
Play video of session: Gold Sponsor Presentation Predictive Analytics Accelerate Insight for Financial Services
Gold Sponsor Presentation: Predictive Analytics Accelerate Insight for Financial Services 

Finbarr Deely, Director of Business Development,ParAccel

Financial services organizations face immense hurdles in maintaining profitability and building competitive advantage. Financial services organizations must perform “what-if” scenario analysis, identify risks, and detect fraud patterns. The advanced analytic complexity required often makes such analysis slow and painful, if not impossible. This presentation outlines the analytic challenges facing these organizations and provides a clear path to providing the accelerated insight needed to perform in today’s complex business environment to reduce risk, stop fraud and increase profits. * The value of predictive analytics in Accelerating Insight * Financial Services Analytic Case Studies * Brief Overview of ParAccel Analytic Database

Length – 09:06 | Email to a Colleague

Free viewing enabled – no charge


isson1.jpg
Add to Cart
TOPIC: BUSINESS VALUE
Case Study: Monster.com
Creating Global Competitive Power with Predictive Analytics 

Jean Paul Isson, Vice President, Globab BI & Predictive Analytics, Monster Worldwide

Using Predictive analytics to gain a deeper understanding of customer behaviours, increase marketing ROI and drive growth

– Creating global competitive power with business intelligence: Making the right decisions – at the right time

– Avoiding common change management challenges in sales, marketing, customer service, and products

– Developing a BI vision – and implementing it: successful business intelligence implementation models

– Using predictive analytics as a business driver to stay on top of the competition

– Following the Monster Worldwide global BI evolution: How Monster used BI to go from good to great

Length – 51:17 | Email to a Colleague

Price: $195


abbot.jpg
Add to Cart
TOPIC: SURVEY ANALYSIS
Case Study: YMCA
Turning Member Satisfaction Surveys into an Actionable Narrative 

Dean Abbott, President, Abbott Analytics

Employees are a key constituency at the Y and previous analysis has shown that their attitudes have a direct bearing on Member Satisfaction. This session will describe a successful approach for the analysis of YMCA employee surveys. Decision trees are built and examined in depth to identify key questions in describing key employee satisfaction metrics, including several interesting groupings of employee attitudes. Our approach will be contrasted with other factor analysis and regression-based approaches to survey analysis that we used initially. The predictive models described are currently in use and resulted in both greater understanding of employee attitudes, and a revised “short-form” survey with fewer key questions identified by the decision trees as the most important predictors.

Length – 50:19 | Email to a Colleague

Price: $195


rexer.jpg
Add to Cart
TOPIC: INDUSTRY TRENDS
2010 Data Minter Survey Results: Highlights
 

Karl Rexer, Ph.D., Rexer Analytics

Do you want to know the views, actions, and opinions of the data mining community? Each year, Rexer Analytics conducts a global survey of data miners to find out. This year at PAW we unveil the results of our 4th Annual Data Miner Survey. This session will present the research highlights, such as:

– Analytic goals & key challenges

– Impact of the economy

– Regional differences

– Text mining trends

Length – 15:20 | Email to a Colleague

Price: $195


elder.jpg
Add to Cart
Multiple Case Studies: U.S. DoD, U.S. DHS, SSA
Text Mining: Lessons Learned 

John F. Elder, Chief Scientist, Elder Research, Inc.

Text Mining is the “Wild West” of data mining and predictive analytics – the potential for gain is huge, the capability claims are often tall tales, and the “land rush” for leadership is very much a race.

In solving unstructured (text) analysis challenges, we found that principles from inductive modeling – learning relationships from labeled cases – has great power to enhance text mining. Dr. Elder highlights key technical breakthroughs discovered while working on projects for leading government agencies, including: Text Mining is the “Wild West” of data mining and predictive analytics – the potential for gain is huge, the capability claims are often tall tales, and the “land rush” for leadership is very much a race.

– Prioritizing searches for the Dept. of Homeland Security

– Quick decisions for Social Security Admin. disability

– Document discovery for the Dept. of Defense

– Disease discovery for the Dept. of Homeland Security

– Risk profiling for the Dept. of Defense

Length – 48:58 | Email to a Colleague

Price: $195


target.jpg
Play video of session: Keynote: How Target Gets the Most out of Its Guest Data to Improve Marketing ROI
Keynote: How Target Gets the Most out of Its Guest Data to Improve Marketing ROI 

Andrew Pole, Senior Manager, Media and Database Marketing, Target

In this session, you’ll learn how Target leverages its own internal guest data to optimize its direct marketing – with the ultimate goal of enhancing our guests’ shopping experience and driving in-store and online performance. You will hear about what guest data is available at Target, how and where we collect it, and how it is used to improve the performance and relevance of direct marketing vehicles. Furthermore, we will discuss Target’s development and usage of guest segmentation, response modeling, and optimization as means to suppress poor performers from mailings, determine relevant product categories and services for online targeted content, and optimally assign receipt marketing offers to our guests when offer quantities are limited.

Length – 47:49 | Email to a Colleague

Free viewing enabled – no charge


analytics.jpg
Play video of session: Platinum Sponsor Presentation: Driving Analytics Into Decision Making
Platinum Sponsor Presentation: Driving Analytics Into Decision Making  

Jason Verlen, Director, SPSS Product Strategy & Management, IBM Software Group

Organizations looking to dramatically improve their business outcomes are turning to decision management, a convergence of technology and business processes that is used to streamline and predict the outcome of daily decision-making. IBM SPSS Decision Management technology provides the critical link between analytical insight and recommended actions. In this session you’ll learn how Decision Management software integrates analytics with business rules and business applications for front-line systems such as call center applications, insurance claim processing, and websites. See how you can improve every customer interaction, minimize operational risk, reduce fraud and optimize results.

Length – 17:29 | Email to a Colleague

Free viewing enabled – no charge


macy.jpg
Add to Cart
TOPIC: DATA INFRASTRUCTURE AND INTEGRATION
Case Study: Macy’s
The world is not flat (even though modeling software has to think it is) 

Paul Coleman, Director of Marketing Statistics, Macy’s Inc.

Software for statistical modeling generally use flat files, where each record represents a unique case with all its variables. In contrast most large databases are relational, where data are distributed among various normalized tables for efficient storage. Variable creation and model scoring engines are necessary to bridge data mining and storage needs. Development datasets taken from a sampled history require snapshot management. Scoring datasets are taken from the present timeframe and the entire available universe. Organizations, with significant data, must decide when to store or calculate necessary data and understand the consequences for their modeling program.

Length – 34:54 | Email to a Colleague

Price: $195


gwaltney.jpg
Add to Cart
TOPIC: CUSTOMER VALUE
Case Study: SunTrust
When One Model Will Not Solve the Problem – Using Multiple Models to Create One Solution 

Dudley Gwaltney, Group Vice President, Analytical Modeling, SunTrust Bank

In 2007, SunTrust Bank developed a series of models to identify clients likely to have large changes in deposit balances. The models include three basic binary and two linear regression models.

Based on the models, 15% of SunTrust clients were targeted as those most likely to have large balance changes. These clients accounted for 65% of the absolute balance change and 60% of the large balance change clients. The targeted clients are grouped into a portfolio and assigned to individual SunTrust Retail Branch. Since 2008, the portfolio generated a 2.6% increase in balances over control.

Using the SunTrust example, this presentation will focus on:

– Identifying situations requiring multiple models

– Determining what types of models are needed

– Combining the individual component models into one output

Length – 48:22 | Email to a Colleague

Price: $195


paychex1.jpg
Add to Cart
TOPIC: RESPONSE & CROSS-SELL
Case Study: Paychex
Staying One Step Ahead of the Competition – Development of a Predictive 401(k) Marketing and Sales Campaign 

Jason Fox, Information Systems and Portfolio Manager,Paychex

In-depth case study of Paychex, Inc. utilizing predictive modeling to turn the tides on competitive pressures within their own client base. Paychex, a leading provider of payroll and human resource solutions, will guide you through the development of a Predictive 401(k) Marketing and Sales model. Through the use of sophisticated data mining techniques and regression analysis the model derives the probability a client will add retirement services products with Paychex or with a competitor. Session will include roadblocks that could have ended development and ROI analysis. Speaker: Frank Fiorille, Director of Enterprise Risk Management, Paychex Speaker: Jason Fox, Risk Management Analyst, Paychex

Length – 26:29 | Email to a Colleague

Price: $195


ling.jpg
Add to Cart
TOPIC: SEGMENTATION
Practitioner: Canadian Imperial Bank of Commerce
Segmentation Do’s and Don’ts 

Daymond Ling, Senior Director, Modelling & Analytics,Canadian Imperial Bank of Commerce

The concept of Segmentation is well accepted in business and has withstood the test of time. Even with the advent of new artificial intelligence and machine learning methods, this old war horse still has its place and is alive and well. Like all analytical methods, when used correctly it can lead to enhanced market positioning and competitive advantage, while improper application can have severe negative consequences.

This session will explore what are the elements of success, and what are the worse practices that lead to failure. The relationship between segmentation and predictive modeling will also be discussed to clarify when it is appropriate to use one versus the other, and how to use them together synergistically.

Length – 45:57 | Email to a Colleague

Price: $195


kobelius1.jpg
Add to Cart
TOPIC: SOCIAL DATA
Thought Leadership
Social Network Analysis: Killer Application for Cloud Analytics
 

James Kobielus, Senior Analyst, Forrester Research

Social networks such as Twitter and Facebook are a potential goldmine of insights on what is truly going through customers´minds. Every company wants to know whether, how, how often, and by whom they´re being mentioned across the billowing new cloud of social media. Just as important, every company wants to influence those discussions in their favor, target new business, and harvest maximum revenue potential. In this session, Forrester analyst James Kobielus identifies fruitful applications of social network analysis in customer service, sales, marketing, and brand management. He presents a roadmap for enterprises to leverage their inline analytics initiatives and leverage high-performance data warehousing (DW) clouds and appliances in order to analyze shifting patterns of customer sentiment, influence, and propensity. Leveraging Forrester’s ongoing research in advanced analytics and customer relationship management, Kobielus will discuss industry trends, commercial modeling tools, and emerging best practices in social network analysis, which represents a game-changing new discipline in predictive analytics.

Length – 48:16 | Email to a Colleague

Price: $195


dogan.jpg
Add to Cart
TOPIC: HEALTHCARE – INTERNATIONAL TARGETING
Case Study: Life Line Screening
Taking CRM Global Through Predictive Analytics 

Ozgur Dogan,
VP, Quantitative Solutions Group, Merkle Inc

Trish Mathe,
Director of Database Marketing, Life Line Screening

While Life Line is successfully executing a US CRM roadmap, they are also beginning this same evolution abroad. They are beginning in the UK where Merkle procured data and built a response model that is pulling responses over 30% higher than competitors. This presentation will give an overview of the US CRM roadmap, and then focus on the beginning of their strategy abroad, focusing on the data procurement they could not get anywhere else but through Merkle and the successful modeling and analytics for the UK. Speaker: Ozgur Dogan, VP, Quantitative Solutions Group, Merkle Inc Speaker: Trish Mathe, Director of Database Marketing, Life Line Screening

Length – 40:12 | Email to a Colleague

Price: $195


sambamoorthi1.jpg
Add to Cart
TOPIC: SURVEY ANALYSIS
Case Study: Forrester
Making Survey Insights Addressable and Scalable – The Case Study of Forrester’s Technographics Benchmark Survey 

Nethra Sambamoorthi, Team Leader, Consumer Dynamics & Analytics, Global Consulting, Acxiom Corporation

Marketers use surveys to create enterprise wide applicable strategic insights to: (1) develop segmentation schemes, (2) summarize consumer behaviors and attitudes for the whole US population, and (3) use multiple surveys to draw unified views about their target audience. However, these insights are not directly addressable and scalable to the whole consumer universe which is very important when applying the power of survey intelligence to the one to one consumer marketing problems marketers routinely face. Acxiom partnered with Forrester Research, creating addressable and scalable applications of Forrester’s Technographics Survey and applied it successfully to a number of industries and applications.

Length – 39:23 | Email to a Colleague

Price: $195


zasadil.jpg
Add to Cart
TOPIC: HEALTHCARE
Case Study: UPMC Health Plan
A Predictive Model for Hospital Readmissions 

Scott Zasadil, Senior Scientist, UPMC Health Plan

Hospital readmissions are a significant component of our nation’s healthcare costs. Predicting who is likely to be readmitted is a challenging problem. Using a set of 123,951 hospital discharges spanning nearly three years, we developed a model that predicts an individual’s 30-day readmission should they incur a hospital admission. The model uses an ensemble of boosted decision trees and prior medical claims and captures 64% of all 30-day readmits with a true positive rate of over 27%. Moreover, many of the ‘false’ positives are simply delayed true positives. 53% of the predicted 30-day readmissions are readmitted within 180 days.

Length – 54:18 | Email to a Colleague

Price: $195

The Popularity of Data Analysis Software

Here is a nice page by Bob Muenchen (author of “R for SAS and SPSS” and “R for Stata” books)

It is available at http://r4stats.com/popularity and uses a variety of methods, including Google Insights, Page Rank, Link analysis, as well as information from Rexer Analytics and KDNuggets.

I believe the following two graphs sum it all up:

1 Number of Jobs at Monster.com using keywords

2 Google Scholar’s analysis of academic papers

Despite R’s Rapid Growth which is clearly evident, in terms of jobs as well as publications, it lags behind SAS and SPSS. So if you are a corporate user or an academic user, it makes sense to have more than one skill just to be sure.  What do you think? Is learning R mutually exclusive and completely exhaustive from learning SAS or SPSS. See http://r4stats.com/popularity for the complete analysis by Bob Muenchen

Also it shows the tremendous opportunity for companies like Revolution Analytics and XL Solutions ( http://www.experience-rplus.com/ ) as the potential for growth is clearly evident.

Rexer Analytics Annual Data Miner Survey

HIGHLIGHTS from the 3rd Annual Data Miner Survey:

  • 40-item survey of data miners, conducted on-line in early 2009.
  • 710 participants from 58 countries.
  • Data miners’ most commonly used algorithms are regression, decision trees, and cluster analysis.
  • Data mining is playing an important role in organizations.
    • Half of data miners say their results are helping to drive strategic decisions and operational processes.
    • 58% say they are adding to the knowledge base in the field.
    • 60% of respondents say the results of their modeling are deployed always or most of the time.
  • Most data miners feel that the economy will not negatively impact them.
  • Almost half of industry data miners rate the analytic capabilities of their company as above average or excellent.  But 19% feel their company has minimal or no analytic capabilities.
  • The top challenges facing data miners are dirty data, explaining data mining to others, and difficult access to data.  However, in 2009 fewer data miners listed data quality and data access as challenges than in the previous year.
  • IBM SPSS Modeler (SPSS Clementine), Statistica, and IBM SPSS Statistics (SPSS Statistics) are identified as the “primary tools” used by the most data miners.
    • Open-source tools Weka and R made substantial movement up data miner’s tool rankings this year, and are now used by large numbers of both academic and for-profit data miners.
    • SAS Enterprise Miner dropped in data miner’s tool rankings this year.
  • Users of IBM SPSS Modeler, Statistica, and Rapid Miner are the most satisfied with their software.
  • Fields & Industries:  Data mining is everywhere.  The most sited areas are CRM / Marketing, Academic, Financial Services, & IT / Telecom.  And in the for-profit sector, the departments data miners most frequently work in are Marketing & Sales and Research & Development.


Additional Info can be taken from the Rexer Analytics website- I find their annual survey one of the most useful in summarizing the entire DM and A landscape.


Data Mining Survey Results :Tools and Offshoring

Here are some survey results from  Rexer Analytics

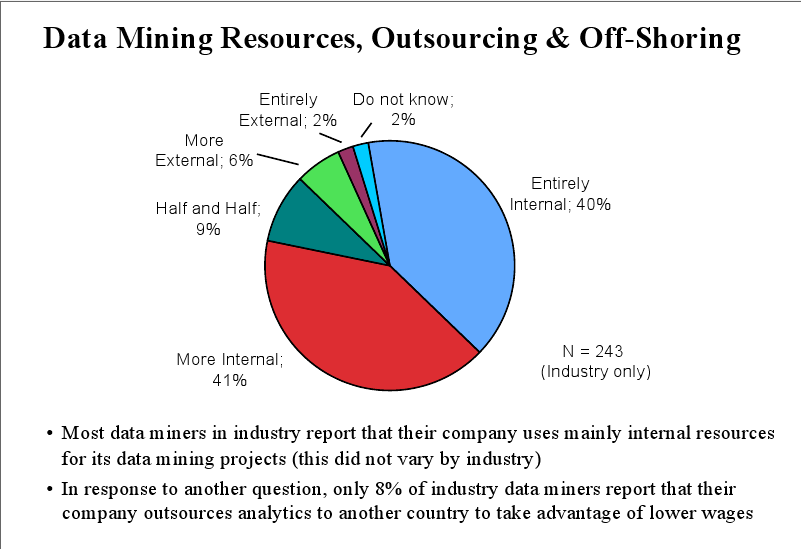
The Graphics seem self explanatory: terrific Data Visualization

1) The field of Data Mining seems ripe for either more offshoring to cut down costs or

there will be price pressures to cut costs on software ( read More R and SaaS) and Hardware ( more cloud /time sharing  ?)

2) Satisfaction with both R and SAS seems similar but R seems to score higher than other flavors.

3) An added dimension of  utility ( or say

(satisfaction in terms of analyst comfort + functionality in terms of business benefit) divided by (License + Training + Installation + Transition costs)

would have even extra analysis.

But these are not final results- for that you need to see Dr Karl at Rexer Analytics

Interview Karl Rexer -Rexer Analytics

Here is an interview with Karl Rexer of Rexer Analytics. His annual survey is considered a benchmark in the data mining and analytics industry. Here Karl talks of his career, his annual survey and his views on the industry direction and trends.

Almost 20% of data miners report that their company/organizations have only minimal analytic capabilities – Karl Rexer

IMG_2031

Ajay- Describe your career in science. What advice would you give to young science graduates in this recession? What advice would you give to high school students choosing from science – non science careers?

Karl- My interests in science began as a child. My father has multiple science degrees, and I grew up listening to his descriptions of the cool things he was building, or the cool investigative tools he was using, in his lab. He worked in an industrial setting, so visiting was difficult. But when I could, I loved going in to see the high-temperature furnaces he was designing, the carbon-fiber production processes he was developing, and the electron microscope that allowed him to look at his samples. Both of my parents encouraged me to ask why, and to think critically about both scientific and social issues. It was also the time of the Apollo moon landings, and I was totally absorbed in watching and thinking about them. Together these things motivated me and shaped my world-view.

I have also had the good fortune to work across many diverse areas and with some truly outstanding people. In graduate school I focused on applied statistics and the use of scientific methods in the social sciences. As a grad student and young academic, I applied those skills to researching how our brains process language. But on the side, I pursued a passion for using the scientific method and analytics to address ….well anything I could. We called it “statistical consulting” then, but it often extended to research design and many other parts of the scientific process. Some early projects included assisting people with AIDS outcome studies, psycholinguistic research, and studies of adolescent adjustment.

My first taste of applying these skills outside of an academic environment was with my mentor Len Katz. The US Navy hired us to help assess the new recruits that were entering the submarine school. Early identification of sailors who would excel in this unusual and stressful environment was critical. Perhaps even more important was identifying sailors who would not perform well in that environment. Luckily, the Navy had years of academic and psychological testing on many sailors, and this data proved quite useful in predicting later job performance onboard the submarines. Even though we never got the promised submarine ride, I was hooked on applying measurement, scientific methods, and analytics in non-academic settings.

And that’s basically what I have continued to do – apply those skills and methods in diverse scientific and business settings. I worked for two banks and two consulting firms before founding Rexer Analytics in 2002. Last year we supported 30 clients. I’ve got great staff and they have great quant skills. Importantly, we also don’t hesitate to challenge each other, and we’re continually learning from each other and from each client engagement. We share a love of project diversity, and we seek it out in our engagements. We’ve forecasted sales for medical devices, measured B2B customer loyalty, identified manufacturing problems by analyzing product returns, predicted which customers will close their bank accounts, analyzed millions of tax returns, helped identify the dimensions of business team cohesion that result in better performance, found millions of dollars of B2B and B2C fraud, and helped many companies understand their customers better with segmentations, surveys, and analyses of sales and customer behavior.

The advice I would give to young science grads in this recession is to expand your view of where you can apply your scientific training. This applies to high school students considering science careers too. All science does not happen in universities, labs and other traditional science locations. Think about applying scientific methods everywhere! Sometimes our projects at Rexer Analytics seem far away from what most people would consider “science.” But we’re always asking “what data is available that can be brought to bear on the business issue we’re addressing.” Sometimes the best solution is to go out and collect more data – so we frequently help our clients improve their measurement processes or design surveys to collect the necessary data. I think there are enormous opportunities for science grads to apply their scientific training in the business world. The opportunities are not limited to physics wiz-kids making models for Wall Street trading or computer science students moving to Silicon Valley. One of the best analytic teams I ever worked on was at Fleet Bank in the late 90s. We had an economist, two physicists, a sociologist, a psychologist, an operations research guy, and person with a degree in marketing science. We were all very focused on data, measurement, and analytic methods.

I recommend that all science grads read Tom Davenport’s book Competing on Analytics *. It illustrates, with compelling examples, how businesses can benefit from using science and analytics. Several examples in Tom’s book come from Gary Loveman, CEO of Harrah’s Entertainment. I think that Gary also serves as a great example of how scientific methods can be applied in every industry. Gary has a PhD in economics from MIT, he’s worked at the Federal Reserve Bank, he’s been a professor at Harvard, but more recently he runs the world’s largest casino and gaming company. And he’s famously said many times that there are three ways to get fired at Harrah’s: steal, harass women, or not use a control group. Business leaders across all industries are increasingly wanting data, analytics and scientific decision-making. Science grads have great training that enables them to take on these roles and to demonstrate the success of these methods.

Ajay- One more survey- How does the Rexer survey differentiate itself from other surveys out there?

Karl- The Annual Rexer Analytics Data Miner Survey is the only broad-reaching research that investigates the analytic behaviors, views and preferences of data mining professionals. Each year our sample grows — in 2009 we had over 700 people around the globe complete our survey. Our participants include large numbers of both academic and business people.

Another way our survey is differentiated from other surveys is that each year we ask our participants to provide suggestions on ways to improve the survey. Incorporating participants’ suggestions improves our survey. For example, in 2008 several people suggested adding questions about model deployment and off-shoring. We asked about both of these topics in the 2009 survey.

Ajay -Could you please share some sneak previews of the survey results? What impact is the recession likely to have on IT spending?

Karl- We’re just starting to analyze the 2009 survey data. But, yes, here’s a peek at some of the findings that relate to the impact of the recession:

* Many data miners report that funding for data mining projects can sometimes be a problem.
* However, when asked what will happen in 2009 if the economic downturn continues, many data miners still anticipate that their company/organization will conduct more data mining projects in 2009 than in previous years (41% anticipate more projects in 2009; 27% anticipate fewer projects).
* The vast majority of companies conduct their data mining internally, and very few are sending data mining off-shore.

I don’t have a crystal ball that tells me about the trends in overall corporate spending on IT, Business Intelligence, or Data Mining. It’s my personal experience that many budgets are tight this year, but that key projects are still getting funded. And it is my strong opinion that in the coming years many companies will increase their focus on analytics, and I think that increasingly analytics will be a source of competitive advantage for these companies.

There are other people and other surveys that provide better insight into the trends in IT spending. For example, Gartner’s recent survey of over 1,500 CIOs (http://www.gartner.com/it/page.jsp?id=855612 ) suggests that 2009 IT spending is likely to be flat. I’m personally happy to see that in the Gartner survey, Business Intelligence is again CIOs’ top technology priority, and that “increasing the use of information/analytics” is the #5 business priority.

Ajay- I noticed you advise SPSS among others. Describe what an advisory role is for an analytics company and how can small open source companies get renowned advisors?

Karl- We have advised Oracle, SPSS, Hewlett-Packard and several smaller companies. We find that advisory roles vary greatly. The biggest source of variation is what the company wants advice about. Example include:

* assessing opportunity areas for the application of analytics
* strategic data assessments
* analytic strategy
* product strategy
* reviewing software

Both large and small companies that look to apply analytics to their businesses can benefit from analytic advisors. So can open source companies that sell analytic software. Companies can find analytic advisors in several ways. One way is to look around for analytic experts whose advice you trust, and hire them. Networking in your own industry and in the analytic communities can identify potential advisors. Don’t forget to look in both academia and the business world. Many skilled people cross back and forth between these two worlds. Another way for these companies to obtain analytic advice is to look in their business networks and user communities for analytic specialists who share some of the goals of the company – they will be motivated for your company to succeed. Especially if focused topic areas or time-constrained tasks can be identified, outside experts may be willing to donate their time, and they may be flattered that you asked.

Ajay- What made you decide to begin the Rexer Surveys? Describe some results of last year’s surveys and any trends from the last three years that you have seen.

Karl- I’ve been involved on the organizing committees of several data mining workshops and conferences. At these conferences I talk with a lot of data miners and companies involved in data mining. I found that many people were interested in hearing about what other data miners were doing: what algorithms, what types of data, what challenges were being faced, what they liked and disliked about their data mining tools, etc. Since we conduct online surveys for several of our clients, and my network of data miners is pretty large, I realized that we could easily do a survey of data miners, and share the results with the data mining community. In the first year, 314 data miners participated, and it’s just grown from there. In 2009 over 700 people completed the survey. The interest we’ve seen in our research summaries has also been astounding – we’ve had thousands of requests. Overall, this just confirms what we originally thought: people are hungry for information about data mining.

Here is a preview of findings from the initial analyses of the 2009 survey data:

* Each year we’ve seen that the most commonly used algorithms are decision trees, regression, and cluster analysis.
* Consistently, some of the top challenges data miners report are dirty data and explaining data mining to others. Previously, data access issues were also reported as a big challenge, but in 2009 fewer data miners reported facing this challenge.
* The most prevalent concerns with how data mining is being utilized are: insufficient training of some data miners, and resistance to using data mining in contexts where it would be beneficial.
* Data mining is playing an important role in organizations. Half of data miners indicate their results are helping to drive strategic decisions and operational processes.
* But there’s room for data mining to grow – almost 20% of data miners report that their company/organizations have only minimal analytic capabilities.

Bio-

Karl Rexer, PhD is President of Rexer Analytics, a small Boston-based consulting firm. Rexer Analytics provides analytic and CRM consulting to help clients use their data to make better strategic and tactical decisions. Recent projects include fraud detection, sales forecasting, customer segmentation, loyalty analyses, predictive modeling for cross-sell and attrition, and survey research. Rexer Analytics also conducts an annual survey of data miners and freely distributes research summaries to the data mining community. Karl has been on the organizing committees of several international data mining conferences, including 3 KDD conferences, and BIWA-2008. Karl is on the SPSS Customer Advisory Board and on the Board of Directors of the Oracle Business Intelligence, Warehousing, & Analytics (BIWA) Special Interest Group. Karl and other Rexer Analytics staff are frequent invited speakers at MBA data mining classes and conferences.

To know more do check out the website on www.rexeranalytics.com

*