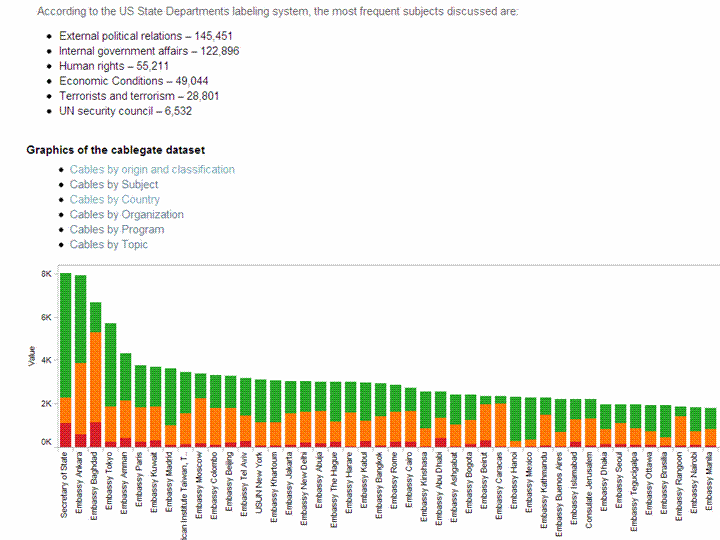
I would be very surprised if 260,000 documents and not even one was a counter-intelligence dis information move. Why was ALL the information stored in one place- maybe Wikileaks would leak the launch codes of the missiles next.
One more data visualization for Tableau– R watchers can not how jjplot by Facebook Analytics and Tableau are replacing GGPLOT 2 as visualization standards- (GGPLOT 2 needs a better GUI maybe using pyqt than the Deducer currently- maybe they can create GGPLOT extensions for Red R yet)
and yes stranger stupid things have happened in diplomacy and intelligence (like India exploding the nuclear bomb on exactly the same date and same place —-surprising CIA, but we are supposed to be on the same side atleast for the next decade) but it would be wrong not to cross reference the cables with the some verification.
Tableau gives great data viz though, but I dont think all 260,000 cables are valid data points (and boy they must really be regretting creating the internet at DARPA and DoD- but you can always blame Al Gore for that)
Here are some jobs from Vincent Granville, founder Analyticbridge. Please contact him directly- I just thought the Season of Joy should have better jobs than currently.
————————————————————————————–
Several job ads recently posted on DataShaping / AnalyticBridge, across United Sates and in Europe. Use the DataShaping search box to find more opportunities.
Now Jim Davis is a big guy, and he is rushing from the launch of SAS Institute’s Social Media Analytics in Japan- to some arguably difficult flying conditions in time to be home in America for Thanksgiving. That and and I have not been much of a good Blog Boy recently, more swayed by love of open source, than love of software per se. I love equally, given I am bad at both equally.
Anyways, Jim’s contention ( http://twitter.com/Davis_Jim ) was customers should go in business analytics only if there is Positive Return on Investment. I am quoting him here-
What is important is that there be a positive ROI on each and every BA project. Otherwise don’t do it.
That’s not the marketing I was taught in my business school- basically it was sell, sell, sell.
However I see most BI sales vendors also go through -let me meet my sales quota for this quarter- and quantifying customer ROI is simple maths than predictive analytics but there seems to be some information assymetry in it.
Here is a paper from North Western University on ROI in IT projects-.
but overall it would be in the interest of customers and Business Analytics Vendors to publish aggregated ROI.
The opponents to this transparency in ROI would be market leaders in market share, who have trapped their customers by high migration costs (due to complexity) or contractually.
A recent study listed Oracle having a large percentage of unhappy customers who would still renew!, SAP had problems when it raised prices for licensing arbitrarily (that CEO is now CEO of HP and dodging legal notices from Oracle).
Indeed Jim Davis’s famous unsettling call for focusing on Business Analytics,as Business Intelligence is dead- that call has been implemented more aggressively by IBM in analytical acquisitions than even SAS itself which has been conservative about inorganic growth. Quantifying ROI, should theoretically aid open source software the most (since they are cheapest in up front licensing) or newer technologies like MapReduce /Hadoop (since they are quite so fast)- but I think that market has a way of factoring in these things- and customers are not as foolish neither as unaware of costs versus benefits of migration.
The contrary to this is Business Analytics and Business Intelligence are imperfect markets with duo-poly or big players thriving in absence of customer regulation.
You get more protection as a customer of $20 bag of potato chips, than as a customer of a $200,000 software. Regulators are wary to step in to ensure ROI fairness (since most bright techies are qither working for private sector, have their own startup or invested in startups)- who in Govt understands Analytics and Intelligence strong enough to ensure vendor lock-ins are not done, and market flexibility is done. It is also a lower choice for embattled regulators to ensure ROI on enterprise software unlike the aggressiveness they have showed in retail or online software.
Who will Analyze the Analysts and who can quantify the value of quants (or penalize them for shoddy quantitative analytics)- is an interesting phenomenon we expect to see more of.
Here is an interview with James Dixon the founder of Pentaho, self confessed Chief Geek and CTO. Pentaho has been growing very rapidly and it makes open source Business Intelligence solutions- basically the biggest chunk of enterprise software market currently.
Ajay- How would you describe Pentaho as a BI product for someone who is completely used to traditional BI vendors (read non open source). Do the Oracle lawsuits over Java bother you from a business perspective?
The Oracle/Java issue does not bother me much. There are a lot of software companies dependent on Java. If Oracle abandons Java a lot resources will suddenly focus on OpenJDK. It would be good for OpenJDK and might be the best thing for Java in the long term.
Ajay- What parts of Pentaho’s technology do you personally like the best as having an advantage over other similar proprietary packages.
Describe the latest Pentaho for Hadoop offering and Hadoop/HIVE ‘s advantage over say Map Reduce and SQL.
James- The coolest thing is that everything is pluggable:
* ETL: New data transformation steps can be added. New orchestration controls (job entries) can be added. New perspectives can be added to the design UI. New data sources and destinations can be added.
* Reporting: New content types and report objects can be added. New data sources can be added.
* BI Server: Every factory, engine, and layer can be extended or swapped out via configuration. BI components can be added. New visualizations can be added.
This means it is very easy for Pentaho, partners, customers, and community member to extend our software to do new things.
In addition every engine and component can be fully embedded into a desktop or web-based application. I made a youtube video about our philosophy: http://www.youtube.com/watch?v=uMyR-In5nKE
Our Hadoop offerings allow ETL developers to work in a familiar graphical design environment, instead of having to code MapReduce jobs in Java or Python.
90% of the Hadoop use cases we hear about are transformation/reporting/analysis of structured/semi-structured data, so an ETL tool is perfect for these situations.
Using Pentaho Data Integration reduces implementation and maintenance costs significantly. The fact that our ETL engine is Java and is embeddable means that we can deploy the engine to the Hadoop data nodes and transform the data within the nodes.
Ajay- Do you think the combination of recession, outsourcing,cost cutting, and unemployment are a suitable environment for companies to cut technology costs by going out of their usual vendor lists and try open source for a change /test projects.
Jamie- Absolutely. Pentaho grew (downloads, installations, revenue) throughout the recession. We are on target to do 250% of what we did last year, while the established vendors are flat in terms of new license revenue.
Ajay- How would you compare the user interface of reports using Pentaho versus other reporting software. Please feel free to be as specific.
James- We have all of the everyday, standard reporting features covered.
Over the years the old tools, like Crystal Reports, have become bloated and complicated.
We don’t aim to have 100% of their features, because we’d end us just as complicated.
The 80:20 rule applies here. 80% of the time people only use 20% of their features.
We aim for 80% feature parity, which should cover 95-99% of typical use cases.
Ajay- Could you describe the Pentaho integration with R as well as your relationship with Weka. Jaspersoft already has a partnership with Revolution Analytics for RevoDeployR (R on a web server)-
Any R plans for Pentaho as well?
James- The feature set of R and Weka overlap to a small extent – both of them include basic statistical functions. Weka is focused on predictive models and machine learning, whereas R is focused on a full suite of statistical models. The creator and main Weka developer is a Pentaho employee. We have integrated R into our ETL tool. (makes me happy 🙂 )
(probably not a good time to ask if SAS integration is done as well for a big chunk of legacy base SAS/ WPS users)
About-
As “Chief Geek” (CTO) at Pentaho, James Dixon is responsible for Pentaho’s architecture and technology roadmap. James has over 15 years of professional experience in software architecture, development and systems consulting. Prior to Pentaho, James held key technical roles at AppSource Corporation (acquired by Arbor Software which later merged into Hyperion Solutions) and Keyola (acquired by Lawson Software). Earlier in his career, James was a technology consultant working with large and small firms to deliver the benefits of innovative technology in real-world environments.
Name an industry in which top level executives are mostly white males, new recruits are mostly male (white or Indian/Chinese), women are primarily shunted into publicity relationships, social media or marketing.
Statistical Computing And Business Intelligence are the white man’s last stand to preserve an exclusive club of hail fellow well met and lets catch up after drinks culture. Newer startups are the exception in the business intelligence world , but a whiter face helps (so do an Indian or Chinese male) to attract a mostly male white venture capital industry.
I have earlier talked about technology being totally dominated by Asian males at grad student level and ASA membership almost not representing minorities like blacks and yes women- but this is about corporate culture in the traditional BI world.
If you are connected to the BI or Stat Computing world, who would you rather hire AND who have you actually hired- with identical resumes
White Male or White Female or Brown Indian Male/Female or Yellow Male/Female or Black Male or Black Female
How many Black Grad Assistants do you see in tech corridors- (Nah- it is easier to get a hard working Chinese /Indian- who smiles and does a great job at $12/hour)
How many non- Asian non white Authors do you see in technology and does that compare to pie chart below
Note_ 2010 Census numbers arent available for STEM, and I was unable to find ethnic background for various technology companies, because though these numbers are collected for legal purposes, they are not publicly shared.
Any technology company which has more than 40% women , or more than 10% blacks would be fairly representative to the US population. Anecdotal evidence suggests European employment for minorities is worse (especially for Asians) but better for women.
Any data sources to support/ refute these hypothesis are welcome for purposes of scientific inquiry.
Tableau was named by Software Magazine as the fastest growing software company in the $10 million to $30 million range in the world, and the second fastest growing software company worldwide overall. The ranking stems from the publication’s 28th annual Software 500 ranking of the world’s largest software service providers.
“We’re growing fast because the market is starving for easy-to-use products that deliver rapid-fire business intelligence to everyone. Our customers want ways to unlock their databases and produce engaging reports and dashboards,” said Christian Chabot CEO and co-founder of Tableau.
Put together an Academy-Award winning professor from the nation’s most prestigious university, a savvy business leader with a passion for data, and a brilliant computer scientist. Add in one of the most challenging problems in software – making databases and spreadsheets understandable to ordinary people. You have just recreated the fundamental ingredients for Tableau.
The catalyst? A Department of Defense (DOD) project aimed at increasing people’s ability to analyze information and brought to famed Stanford professor, Pat Hanrahan. A founding member of Pixar and later its chief architect for RenderMan, Pat invented the technology that changed the world of animated film. If you know Buzz and Woody of “Toy Story”, you have Pat to thank.
Under Pat’s leadership, a team of Stanford Ph.D.s got together just down the hall from the Google folks. Pat and Chris Stolte, the brilliant computer scientist, realized that data visualization could produce large gains in people’s ability to understand information. Rather than analyzing data in text form and then creating visualizations of those findings, Pat and Chris invented a technology called VizQL™ by which visualization is part of the journey and not just the destination. Fast analytics and visualization for everyone was born.
While satisfying the DOD project, Pat and Chris met Christian Chabot, a former data analyst who turned into Jello when he saw what had been invented. The three formed a company and spun out of Stanford like so many before them (Yahoo, Google, VMWare, SUN). With Christian on board as CEO, Tableau rapidly hit one success after another: its first customer (now Tableau’s VP, Operations, Tom Walker), an OEM deal with Hyperion (now Oracle), funding from New Enterprise Associates, a PC Magazine award for “Product of the Year” just one year after launch, and now over 50,000 people in 50+ countries benefiting from the breakthrough.
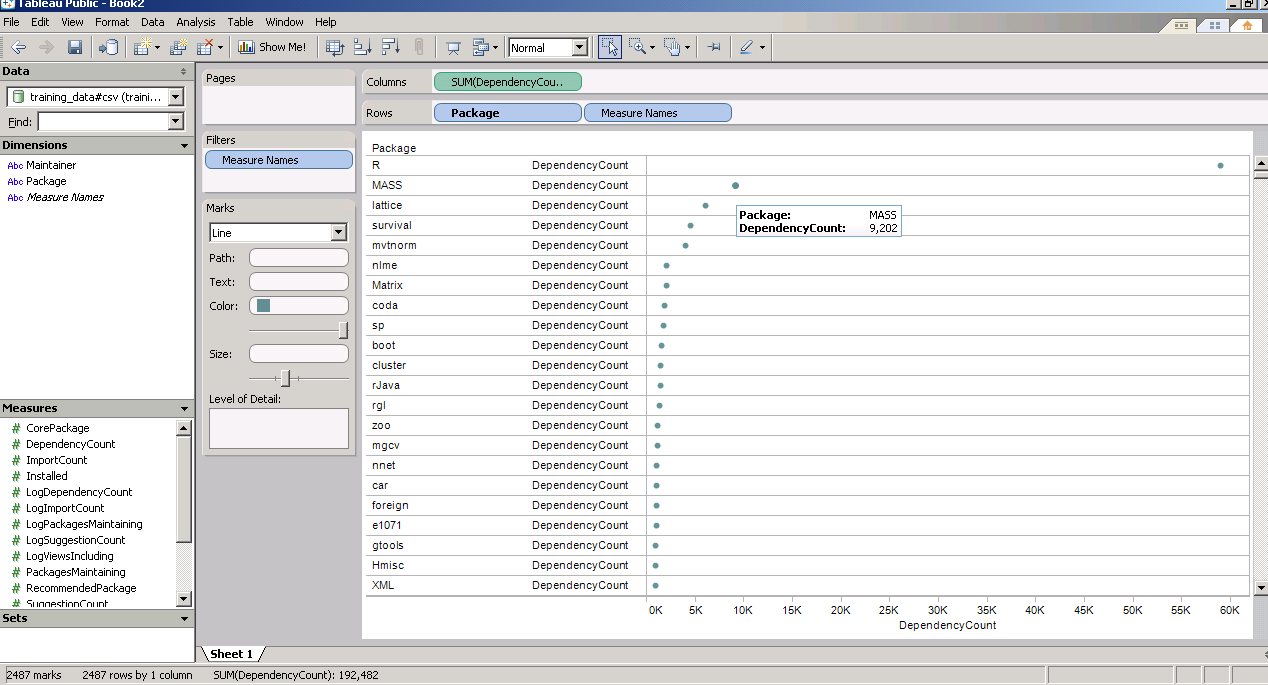
and now a demo I ran on the Kaggle contest data (it is a csv dataset with 95000 rows)
I found Tableau works extremely good at pivoting data and visualizing it -almost like Excel on Steroids. Download the free version here ( I dont know about an academic program (see links below) but software is not expensive at all)
The Professional Edition is a visual analysis and reporting solution for data stored in MS SQL Server, MS Analysis Services, Oracle, IBM DB2, Netezza, Hyperion Essbase, Teradata, Vertica, MySQL, PostgreSQL, Firebird, Excel, MS Access or Text Files. Available via download.
Tableau Server enables users of Tableau Desktop Professional to publish workbooks and visualizations to a server where users with web browsers can access and interact with the results. Available via download.
* Price is per Named User and includes one year of maintenance (upgrades and support). Products are made available as a download immediately after purchase. You may revisit the download site at any time during your current maintenance period to access the latest releases.
Cisco SocialMiner is a social media customer care solution that can help you proactively respond to customers and prospects communicating through public social media networks like Twitter, Facebook, or other public forums or blogging sites. By providing social media monitoring, queuing, and workflow to organize customer posts on social media networks and deliver them to your social media customer care team, your company can respond to customers in real time using the same social network they are using.
Cisco SocialMiner provides:
The ability to configure multiple campaigns to search for customer postings on the public social web about your company’s products, services, or area of expertise
Filtering of social contacts based on preconfigured campaign filters to focus campaign searches
Routing of social contacts to skilled customer care representatives in the contact center or to experts in the enterprise–multiple people can work together to handle responses to customer postings through shared work queues
Detailed metrics for social media customer care activities, campaign reports, and team reports
With Cisco SocialMiner, your company can listen and respond to customer conversations originating in the social web. Being proactive can help your company enhance its service, improve customer loyalty, garner new customers, and protect your brand.
Table 1. Features and Benefits of Cisco SocialMiner 8.5
Feature
Benefits
Product Baseline Features
Social media feeds
• Feeds are configurable sources to capture public social contacts that contain specific words, terms, or phrases.
• Feeds enable you to search for information on the public social web about your company’s products, services, or area of expertise.
• Cisco SocialMiner supports the following types of feeds:
• Groups feeds into campaigns to organize all posting activity related to a product category or business objective
• Produces metrics on campaign activity
• Provides the ability to configure multiple campaigns to search for customer postings on specific products or services
• Groups social contacts for handling by the social media customer care team
• Enables filtering of social contacts based on preconfigured campaign filters to focus campaign searches
Route and queue social contacts
• Enables routing of social contacts to skilled customer care representatives in the contact center
• Draws on expertise in the enterprise by allowing multiple people in the enterprise to work together to handle responses to customer postings through shared work queues
• Enables automated distribution of work to improve efficiency and effectiveness of social media engagement
Tagging
• Allows work to be routed to the appropriate team by grouping each post or social contact into different categories; for example, a post can be marked with the “customer_support” tag; this post will then appear on a customer support agent’s queue for processing
Social media customer care metrics
• Provides detailed metrics on social media customer care activities, campaign reports, and team reports
• Measures work and results
• Manages to service-level goals
• Supports brand management
• Optimizes staffing
• Includes dashboarding of social media posting activity when Cisco Unified Intelligence Center is used
Reporting for social contacts
• Provides a reporting database that can be accessed using any reporting tool, including Cisco Unified Intelligence Center
• Enables customer care management to accurately report on and track social media interactions by the contact center
OpenSocial-compliant gadgets
Representational State Transfer (REST) application programming interfaces (APIs)
• Provides flexible user interface options
• Enables extensive opportunities for customization
Optional integration with full suite of Cisco Collaboration tools
• Allows you to take advantage of the full suite of Cisco Collaboration tools, including Cisco Quad, Cisco Show and Share, and Cisco Pulse technology, to help your social media customer care team quickly find answers to help customers efficiently and effectively
• Requires a Cisco UCS C-Series or B-Series Server.
• Server consolidation means lower cost per server with Cisco UCS Servers.
Architecture
Scalability
• One server supports up to 30 simultaneous social media customer care users and 10,000 social contacts per hour.
Management
Cisco Unified Real-Time Monitoring Tool (RTMT)
• Operational management is enhanced through integration with the Cisco Unified RTMT, providing consistent application monitoring across Cisco Unified Communications Solutions.
Simple Network Management Protocol (SNMP)
• SNMP with an associated MIB is supported through the Cisco Voice Operating System (VOS).
Reporting
Cisco Unified Intelligence Center
• Create customizable reports of social media customer care events using Cisco Unified Intelligence Center (purchased separately).