#Rstats for Business Intelligence

This is a short list of several known as well as lesser known R ( #rstats) language codes, packages and tricks to build a business intelligence application. It will be slightly Messy (and not Messi) but I hope to refine it someday when the cows come home.

It assumes that BI is basically-

a Database, a Document Database, a Report creation/Dashboard pulling software as well unique R packages for business intelligence.

What is business intelligence?

Seamless dissemination of data in the organization. In short let it flow- from raw transactional data to aggregate dashboards, to control and test experiments, to new and legacy data mining models- a business intelligence enabled organization allows information to flow easily AND capture insights and feedback for further action.

BI software has lately meant to be just reporting software- and Business Analytics has meant to be primarily predictive analytics. the terms are interchangeable in my opinion -as BI reports can also be called descriptive aggregated statistics or descriptive analytics, and predictive analytics is useless and incomplete unless you measure the effect in dashboards and summary reports.

Data Mining- is a bit more than predictive analytics- it includes pattern recognizability as well as black box machine learning algorithms. To further aggravate these divides, students mostly learn data mining in computer science, predictive analytics (if at all) in business departments and statistics, and no one teaches metrics , dashboards, reporting  in mainstream academia even though a large number of graduates will end up fiddling with spreadsheets or dashboards in real careers.

Using R with

1) Databases-

I created a short list of database connectivity with R here at https://rforanalytics.wordpress.com/odbc-databases-for-r/ but R has released 3 new versions since then.

The RODBC package remains the package of choice for connecting to SQL Databases.

http://cran.r-project.org/web/packages/RODBC/RODBC.pdf

Details on creating DSN and connecting to Databases are given at  https://rforanalytics.wordpress.com/odbc-databases-for-r/

For document databases like MongoDB and CouchDB

( what is the difference between traditional RDBMS and NoSQL if you ever need to explain it in a cocktail conversation http://dba.stackexchange.com/questions/5/what-are-the-differences-between-nosql-and-a-traditional-rdbms

Basically dispensing with the relational setup, with primary and foreign keys, and with the additional overhead involved in keeping transactional safety, often gives you extreme increases in performance

NoSQL is a kind of database that doesn’t have a fixed schema like a traditional RDBMS does. With the NoSQL databases the schema is defined by the developer at run time. They don’t write normal SQL statements against the database, but instead use an API to get the data that they need.

instead relating data in one table to another you store things as key value pairs and there is no database schema, it is handled instead in code.)

I believe any corporation with data driven decision making would need to both have atleast one RDBMS and one NoSQL for unstructured data-Ajay. This is a sweeping generic statement 😉 , and is an opinion on future technologies.

  • Use RMongo

From- http://tommy.chheng.com/2010/11/03/rmongo-accessing-mongodb-in-r/

http://plindenbaum.blogspot.com/2010/09/connecting-to-mongodb-database-from-r.html

Connecting to a MongoDB database from R using Java

http://nsaunders.wordpress.com/2010/09/24/connecting-to-a-mongodb-database-from-r-using-java/

Also see a nice basic analysis using R Mongo from

http://pseudofish.com/blog/2011/05/25/analysis-of-data-with-mongodb-and-r/

For CouchDB

please see https://github.com/wactbprot/R4CouchDB and

http://digitheadslabnotebook.blogspot.com/2010/10/couchdb-and-r.html

  • First install RCurl and RJSONIO. You’ll have to download the tar.gz’s if you’re on a Mac. For the second part, we’ll need to installR4CouchDB,

2) External Report Creating Software-

Jaspersoft- It has good integration with R and is a certified Revolution Analytics partner (who seem to be the only ones with a coherent #Rstats go to market strategy- which begs the question – why is the freest and finest stats software having only ONE vendor- if it was so great lots of companies would make exclusive products for it – (and some do -see https://rforanalytics.wordpress.com/r-business-solutions/ and https://rforanalytics.wordpress.com/using-r-from-other-software/)

From

http://www.jaspersoft.com/sites/default/files/downloads/events/Analytics%20-Jaspersoft-SEP2010.pdf

we see

http://jasperforge.org/projects/rrevodeployrbyrevolutionanalytics

RevoConnectR for JasperReports Server

RevoConnectR for JasperReports Server RevoConnectR for JasperReports Server is a Java library interface between JasperReports Server and Revolution R Enterprise’s RevoDeployR, a standardized collection of web services that integrates security, APIs, scripts and libraries for R into a single server. JasperReports Server dashboards can retrieve R charts and result sets from RevoDeployR.

http://jasperforge.org/plugins/esp_frs/optional_download.php?group_id=409


Using R and Pentaho
Extending Pentaho with R analytics”R” is a popular open source statistical and analytical language that academics and commercial organizations alike have used for years to get maximum insight out of information using advanced analytic techniques. In this twelve-minute video, David Reinke from Pentaho Certified Partner OpenBI provides an overview of R, as well as a demonstration of integration between R and Pentaho.
and from
R and BI – Integrating R with Open Source Business
Intelligence Platforms Pentaho and Jaspersoft
David Reinke, Steve Miller
Keywords: business intelligence
Increasingly, R is becoming the tool of choice for statistical analysis, optimization, machine learning and
visualization in the business world. This trend will only escalate as more R analysts transition to business
from academia. But whereas in academia R is often the central tool for analytics, in business R must coexist
with and enhance mainstream business intelligence (BI) technologies. A modern BI portfolio already includes
relational databeses, data integration (extract, transform, load – ETL), query and reporting, online analytical
processing (OLAP), dashboards, and advanced visualization. The opportunity to extend traditional BI with
R analytics revolves on the introduction of advanced statistical modeling and visualizations native to R. The
challenge is to seamlessly integrate R capabilities within the existing BI space. This presentation will explain
and demo an initial approach to integrating R with two comprehensive open source BI (OSBI) platforms –
Pentaho and Jaspersoft. Our efforts will be successful if we stimulate additional progress, transparency and
innovation by combining the R and BI worlds.
The demonstration will show how we integrated the OSBI platforms with R through use of RServe and
its Java API. The BI platforms provide an end user web application which include application security,
data provisioning and BI functionality. Our integration will demonstrate a process by which BI components
can be created that prompt the user for parameters, acquire data from a relational database and pass into
RServer, invoke R commands for processing, and display the resulting R generated statistics and/or graphs
within the BI platform. Discussion will include concepts related to creating a reusable java class library of
commonly used processes to speed additional development.

If you know Java- try http://ramanareddyg.blog.com/2010/07/03/integrating-r-and-pentaho-data-integration/


and I like this list by two venerable powerhouses of the BI Open Source Movement

http://www.openbi.com/demosarticles.html

Open Source BI as disruptive technology

http://www.openbi.biz/articles/osbi_disruption_openbi.pdf

Open Source Punditry

TITLE AUTHOR COMMENTS
Commercial Open Source BI Redux Dave Reinke & Steve Miller An review and update on the predictions made in our 2007 article focused on the current state of the commercial open source BI market. Also included is a brief analysis of potential options for commercial open source business models and our take on their applicability.
Open Source BI as Disruptive Technology Dave Reinke & Steve Miller Reprint of May 2007 DM Review article explaining how and why Commercial Open Source BI (COSBI) will disrupt the traditional proprietary market.

Spotlight on R

TITLE AUTHOR COMMENTS
R You Ready for Open Source Statistics? Steve Miller R has become the “lingua franca” for academic statistical analysis and modeling, and is now rapidly gaining exposure in the commercial world. Steve examines the R technology and community and its relevancy to mainstream BI.
R and BI (Part 1): Data Analysis with R Steve Miller An introduction to R and its myriad statistical graphing techniques.
R and BI (Part 2): A Statistical Look at Detail Data Steve Miller The usage of R’s graphical building blocks – dotplots, stripplots and xyplots – to create dashboards which require little ink yet tell a big story.
R and BI (Part 3): The Grooming of Box and Whiskers Steve Miller Boxplots and variants (e.g. Violin Plot) are explored as an essential graphical technique to summarize data distributions by categories and dimensions of other attributes.
R and BI (Part 4): Embellishing Graphs Steve Miller Lattices and logarithmic data transformations are used to illuminate data density and distribution and find patterns otherwise missed using classic charting techniques.
R and BI (Part 5): Predictive Modelling Steve Miller An introduction to basic predictive modelling terminology and techniques with graphical examples created using R.
R and BI (Part 6) :
Re-expressing Data
Steve Miller How do you deal with highly skewed data distributions? Standard charting techniques on this “deviant” data often fail to illuminate relationships. This article explains techniques to re-express skewed data so that it is more understandable.
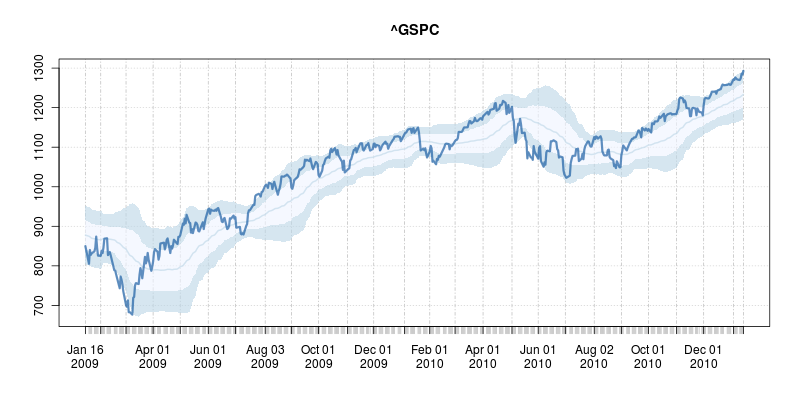
The Stock Market, 2007 Steve Miller R-based dashboards are presented to demonstrate the return performance of various asset classes during 2007.
Bootstrapping for Portfolio Returns: The Practice of Statistical Analysis Steve Miller Steve uses the R open source stats package and Monte Carlo simulations to examine alternative investment portfolio returns…a good example of applied statistics using R.
Statistical Graphs for Portfolio Returns Steve Miller Steve uses the R open source stats package to analyze market returns by asset class with some very provocative embedded trellis charts.
Frank Harrell, Iowa State and useR!2007 Steve Miller In August, Steve attended the 2007 Internation R User conference (useR!2007). This article details his experiences, including his meeting with long-time R community expert, Frank Harrell.
An Open Source Statistical “Dashboard” for Investment Performance Steve Miller The newly launched Dashboard Insight web site is focused on the most useful of BI tools: dashboards. With this article discussing the use of R and trellis graphics, OpenBI brings the realm of open source to this forum.
Unsexy Graphics for Business Intelligence Steve Miller Utilizing Tufte’s philosophy of maximizing the data to ink ratio of graphics, Steve demonstrates the value in dot plot diagramming. The R open source statistical/analytics software is showcased.
I think that the report generation package Brew would also qualify as a BI package, but large scale implementation remains to be seen in
a commercial business environment
  • brew: Creating Repetitive Reports
 brew: Templating Framework for Report Generation

brew implements a templating framework for mixing text and R code for report generation. brew template syntax is similar to PHP, Ruby's erb module, Java Server Pages, and Python's psp module. http://bit.ly/jINmaI
  • Yarr- creating reports in R
to be continued ( when I have more time and the temperature goes down from 110F in Delhi, India)

Pentaho and R: working together

open_source_communism
Image by jagelado via Flickr

I interview Pentaho Co-founder here at https://decisionstats.com/2010/11/14/pentaho/

and recently became aware of the R Pentaho integration.

“R” is a popular open source statistical and analytical language that academics and commercial organizations alike have used for years to get maximum insight out of information using advanced analytic techniques. In this twelve-minute video, David Reinke from Pentaho Certified Partner OpenBI provides an overview of R, as well as a demonstration of integration between R and Pentaho.

http://www.pentaho.com/products/demos/r_project_with_pentaho/

or http://www.pentaho.com/products/demos/showNtell.php

Related-

M.S. in Applied Statistics

http://www.information-management.com/blogs/analytics_business_intelligence_BI_statistics-10019474-1.html

R and BI – Integrating R with Open Source BusinessIntelligence Platforms Pentaho and Jaspersoft

http://www.r-project.org/conferences/useR-2010/abstracts/Reinke+Miller.pdf

Web development with R

http://www.r-project.org/conferences/useR-2010/slides/Ooms.pdf

In-database analytics with R

http://www.r-project.org/conferences/useR-2010/slides/Hess+Chambers_1.pdf

R role in Business Intelligence Software Architecture

http://www.r-project.org/conferences/useR-2010/slides/Colombo+Ronzoni+Fontana.pdf

Increasing views to Youtube Videos

YouTube
Image via Wikipedia

The Youtube Promoted Videos (basically a video form of Adsense) can really help companies like Oracle, SAP, IBM, Netezza, SAS Insititute, AsterData, Rapid Miner, Pentaho,  JasperSoft, Teradata, Revolution who create

either corporate videos/training videos or upload their seminar, webinar,conference videos to Youtube.

Making a video is hard work in itself- doing an A/ B test with Youtube Promoted videos might just get a better ROI for your video marketing budget and IMHO embeddable videos from Youtube are much better and easier to share than Videos that can be seen only after registration on a company web site. You want to get the word out for your software, or you want to get website views?

Interview James Dixon Pentaho

Here is an interview with James Dixon the founder of Pentaho, self confessed Chief Geek and CTO. Pentaho has been growing very rapidly and it makes open source Business Intelligence solutions- basically the biggest chunk of enterprise software market currently.

Ajay-  How would you describe Pentaho as a BI product for someone who is completely used to traditional BI vendors (read non open source). Do the Oracle lawsuits over Java bother you from a business perspective?

James-

Pentaho has a full suite of BI software:

* ETL: Pentaho Data Integration

* Reporting: Pentaho Reporting for desktop and web-based reporting

* OLAP: Mondrian ROLAP engine, and Analyzer or Jpivot for web-based OLAP client

* Dashboards: CDF and Dashboard Designer

* Predictive Analytics: Weka

* Server: Pentaho BI Server, handles web-access, security, scheduling, sharing, report bursting etc

We have all of the standard BI functionality.

The Oracle/Java issue does not bother me much. There are a lot of software companies dependent on Java. If Oracle abandons Java a lot resources will suddenly focus on OpenJDK. It would be good for OpenJDK and might be the best thing for Java in the long term.

Ajay-  What parts of Pentaho’s technology do you personally like the best as having an advantage over other similar proprietary packages.

Describe the latest Pentaho for Hadoop offering and Hadoop/HIVE ‘s advantage over say Map Reduce and SQL.

James- The coolest thing is that everything is pluggable:

* ETL: New data transformation steps can be added. New orchestration controls (job entries) can be added. New perspectives can be added to the design UI. New data sources and destinations can be added.

* Reporting: New content types and report objects can be added. New data sources can be added.

* BI Server: Every factory, engine, and layer can be extended or swapped out via configuration. BI components can be added. New visualizations can be added.

This means it is very easy for Pentaho, partners, customers, and community member to extend our software to do new things.

In addition every engine and component can be fully embedded into a desktop or web-based application. I made a youtube video about our philosophy: http://www.youtube.com/watch?v=uMyR-In5nKE

Our Hadoop offerings allow ETL developers to work in a familiar graphical design environment, instead of having to code MapReduce jobs in Java or Python.

90% of the Hadoop use cases we hear about are transformation/reporting/analysis of structured/semi-structured data, so an ETL tool is perfect for these situations.

Using Pentaho Data Integration reduces implementation and maintenance costs significantly. The fact that our ETL engine is Java and is embeddable means that we can deploy the engine to the Hadoop data nodes and transform the data within the nodes.

Ajay-  Do you think the combination of recession, outsourcing,cost cutting, and unemployment are a suitable environment for companies to cut technology costs by going out of their usual vendor lists and try open source for a change /test projects.

Jamie- Absolutely. Pentaho grew (downloads, installations, revenue) throughout the recession. We are on target to do 250% of what we did last year, while the established vendors are flat in terms of new license revenue.

Ajay-  How would you compare the user interface of reports using Pentaho versus other reporting software. Please feel free to be as specific.

James- We have all of the everyday, standard reporting features covered.

Over the years the old tools, like Crystal Reports, have become bloated and complicated.

We don’t aim to have 100% of their features, because we’d end us just as complicated.

The 80:20 rule applies here. 80% of the time people only use 20% of their features.

We aim for 80% feature parity, which should cover 95-99% of typical use cases.

Ajay-  Could you describe the Pentaho integration with R as well as your relationship with Weka. Jaspersoft already has a partnership with Revolution Analytics for RevoDeployR (R on a web server)-

Any  R plans for Pentaho as well?

James- The feature set of R and Weka overlap to a small extent – both of them include basic statistical functions. Weka is focused on predictive models and machine learning, whereas R is focused on a full suite of statistical models. The creator and main Weka developer is a Pentaho employee. We have integrated R into our ETL tool. (makes me happy 🙂 )

(probably not a good time to ask if SAS integration is done as well for a big chunk of legacy base SAS/ WPS users)

About-

As “Chief Geek” (CTO) at Pentaho, James Dixon is responsible for Pentaho’s architecture and technology roadmap. James has over 15 years of professional experience in software architecture, development and systems consulting. Prior to Pentaho, James held key technical roles at AppSource Corporation (acquired by Arbor Software which later merged into Hyperion Solutions) and Keyola (acquired by Lawson Software). Earlier in his career, James was a technology consultant working with large and small firms to deliver the benefits of innovative technology in real-world environments.

Open Source Cartoon

Jim Goodnight, Chief Executive Officer, SAS, U...
Image via Wikipedia

Ok I promised a weekly cartoon on Friday but it’s Saturday.
Last week we spoofed Larry Ellison , Jim Goodnight and Bill Gates– people who created billions of taxes for the economy but would be regarded as evil by some open source guys- though they may have created more jobs for more families than the whole Federal Reserve Bank did in 2008-10. Jobs are necessary for families. Period.

You can review it here https://decisionstats.files.wordpress.com/2010/11/os1.png

In Part 2- we see Open Source is actually older than Stallman (yes people are older than Stallman) – in fact open source has been around for far more time than even

Jim Goodnight’s current age- which can be revealed by using proc goodnight options=all.

Open Source’s worst enemy is itself not Microsoft/SAS/SAP/Oracle

The decision of quality open source makers to offer their software at bargain basement prices even to enterprise customers who are used to pay prices many times more-pricing is the reason open source software is taking a long time to command respect in enterprise software.

I hate to be the messenger who brings the bad news to my open source brethren-

but their worst nightmare is not the actions of their proprietary competitors like Oracle, SAP, SAS, Microsoft ( they hate each other even more than open source )

nor the collective marketing tactics which are textbook like (but referred as Fear Uncertainty Doubt by those outside that golden quartet)- it is their own communities and their own cheap pricing.

It is community action which prevents them from offering their software by ridiculously low bargain basement prices. James Dixon, head geek and founder at Pentaho has a point when he says traditional metrics like revenue need o be adjusted for this impact in his article at http://jamesdixon.wordpress.com/2010/11/02/comparing-open-source-and-proprietary-software-markets/

But James, why offer software to enterprise customers at one tenth the next competitor- one reason is open source companies more often than not compete more with their free community version software than with big proprietary packages.

Communities including academics are used to free- hey how about paying say 1$ for each download.

There are two million R users- if say even 50 % of them  paid 1 $ as a lifetime license fee- you could sponsor enough new packages than twenty years of Google Summer of Code does right now.

Secondly, this pricing can easily be adjusted by shifting the licensing to say free for businesses less than 2 people (even for the enhanced corporate software version not just the plain vanilla community software thus further increasing the spread of the plain vanilla versions)- for businesses from 10 to 20 people offer a six month trial rather than one month trial.

– but adjust the pricing to much more realistic levels compared to competing software. Make enterprise software pay a real value.

That’s the only way to earn respect. as well as a few dollars more.

As for SAS, it is time it started ridiculing Python now that it has accepted R.

Python is even MORE powerful than R in some use cases for stat computing

Dixon’s Pentaho and the Jaspersoft/ Revolution combo are nice _ I tested both Jasper and Pentaho thanks to these remarks this week 🙂  (see slides at http://www.jaspersoft.com/sites/default/files/downloads/events/Analytics%20-Jaspersoft-SEP2010.pdf or http://www.revolutionanalytics.com/news-events/free-webinars/2010/deploying-r/index.php )

Pentaho and Jasper do give good great graphics in BI (Graphical display in BI is not a SAS forte though probably I dont know how much they cross sell JMP to BI customers- probably too much JMP is another division syndrome there)

Open Source's worst enemy is itself not Microsoft/SAS/SAP/Oracle

The decision of quality open source makers to offer their software at bargain basement prices even to enterprise customers who are used to pay prices many times more-pricing is the reason open source software is taking a long time to command respect in enterprise software.

I hate to be the messenger who brings the bad news to my open source brethren-

but their worst nightmare is not the actions of their proprietary competitors like Oracle, SAP, SAS, Microsoft ( they hate each other even more than open source )

nor the collective marketing tactics which are textbook like (but referred as Fear Uncertainty Doubt by those outside that golden quartet)- it is their own communities and their own cheap pricing.

It is community action which prevents them from offering their software by ridiculously low bargain basement prices. James Dixon, head geek and founder at Pentaho has a point when he says traditional metrics like revenue need o be adjusted for this impact in his article at http://jamesdixon.wordpress.com/2010/11/02/comparing-open-source-and-proprietary-software-markets/

But James, why offer software to enterprise customers at one tenth the next competitor- one reason is open source companies more often than not compete more with their free community version software than with big proprietary packages.

Communities including academics are used to free- hey how about paying say 1$ for each download.

There are two million R users- if say even 50 % of them  paid 1 $ as a lifetime license fee- you could sponsor enough new packages than twenty years of Google Summer of Code does right now.

Secondly, this pricing can easily be adjusted by shifting the licensing to say free for businesses less than 2 people (even for the enhanced corporate software version not just the plain vanilla community software thus further increasing the spread of the plain vanilla versions)- for businesses from 10 to 20 people offer a six month trial rather than one month trial.

– but adjust the pricing to much more realistic levels compared to competing software. Make enterprise software pay a real value.

That’s the only way to earn respect. as well as a few dollars more.

As for SAS, it is time it started ridiculing Python now that it has accepted R.

Python is even MORE powerful than R in some use cases for stat computing

Dixon’s Pentaho and the Jaspersoft/ Revolution combo are nice _ I tested both Jasper and Pentaho thanks to these remarks this week 🙂  (see slides at http://www.jaspersoft.com/sites/default/files/downloads/events/Analytics%20-Jaspersoft-SEP2010.pdf or http://www.revolutionanalytics.com/news-events/free-webinars/2010/deploying-r/index.php )

Pentaho and Jasper do give good great graphics in BI (Graphical display in BI is not a SAS forte though probably I dont know how much they cross sell JMP to BI customers- probably too much JMP is another division syndrome there)

%d bloggers like this: