Information graphics or infographics are graphic visual representations of information, data or knowledge intended to present complex information quickly and clearly.[1][2] They can improve cognition by utilizing graphics to enhance the human visual system’s ability to see patterns and trends.[3][4] The process of creating infographics can be referred to as data visualization, information design, or information architecture.[2]
What is Infogr.am?
It Create infographics and interactive online charts. It’s free and super-easy!
How?
Step 1
Login using Twitter or Facebook
Step 2
Create
Step 3
Choose New Infographic or New Chart?
Step 4
Create using options-you can edit the table, figures, text, colors etc
Tableau was named by Software Magazine as the fastest growing software company in the $10 million to $30 million range in the world, and the second fastest growing software company worldwide overall. The ranking stems from the publication’s 28th annual Software 500 ranking of the world’s largest software service providers.
“We’re growing fast because the market is starving for easy-to-use products that deliver rapid-fire business intelligence to everyone. Our customers want ways to unlock their databases and produce engaging reports and dashboards,” said Christian Chabot CEO and co-founder of Tableau.
Put together an Academy-Award winning professor from the nation’s most prestigious university, a savvy business leader with a passion for data, and a brilliant computer scientist. Add in one of the most challenging problems in software – making databases and spreadsheets understandable to ordinary people. You have just recreated the fundamental ingredients for Tableau.
The catalyst? A Department of Defense (DOD) project aimed at increasing people’s ability to analyze information and brought to famed Stanford professor, Pat Hanrahan. A founding member of Pixar and later its chief architect for RenderMan, Pat invented the technology that changed the world of animated film. If you know Buzz and Woody of “Toy Story”, you have Pat to thank.
Under Pat’s leadership, a team of Stanford Ph.D.s got together just down the hall from the Google folks. Pat and Chris Stolte, the brilliant computer scientist, realized that data visualization could produce large gains in people’s ability to understand information. Rather than analyzing data in text form and then creating visualizations of those findings, Pat and Chris invented a technology called VizQL™ by which visualization is part of the journey and not just the destination. Fast analytics and visualization for everyone was born.
While satisfying the DOD project, Pat and Chris met Christian Chabot, a former data analyst who turned into Jello when he saw what had been invented. The three formed a company and spun out of Stanford like so many before them (Yahoo, Google, VMWare, SUN). With Christian on board as CEO, Tableau rapidly hit one success after another: its first customer (now Tableau’s VP, Operations, Tom Walker), an OEM deal with Hyperion (now Oracle), funding from New Enterprise Associates, a PC Magazine award for “Product of the Year” just one year after launch, and now over 50,000 people in 50+ countries benefiting from the breakthrough.
and now a demo I ran on the Kaggle contest data (it is a csv dataset with 95000 rows)
I found Tableau works extremely good at pivoting data and visualizing it -almost like Excel on Steroids. Download the free version here ( I dont know about an academic program (see links below) but software is not expensive at all)
The Professional Edition is a visual analysis and reporting solution for data stored in MS SQL Server, MS Analysis Services, Oracle, IBM DB2, Netezza, Hyperion Essbase, Teradata, Vertica, MySQL, PostgreSQL, Firebird, Excel, MS Access or Text Files. Available via download.
Tableau Server enables users of Tableau Desktop Professional to publish workbooks and visualizations to a server where users with web browsers can access and interact with the results. Available via download.
* Price is per Named User and includes one year of maintenance (upgrades and support). Products are made available as a download immediately after purchase. You may revisit the download site at any time during your current maintenance period to access the latest releases.
A recnet product by Google is Knol (http://knol.google.com) . A knol is a unit of knowledge. As you can see from the features below, it is more like a wikipedia , or a collbrative scholarly tool . It has customized options for the kind of license you want, your self rating , viewer’s rating, collbration enabled or not. An extremely nifty tool, but hosted by the big G will have its share of suspicions among the academic community. Here is the snapshot of an empty knol page.And here is a link to a knol created by me at http://knol.google.com/k/ajay-ohri/data-mining-through-cloud-computing/d8o4tiw9xa68/3

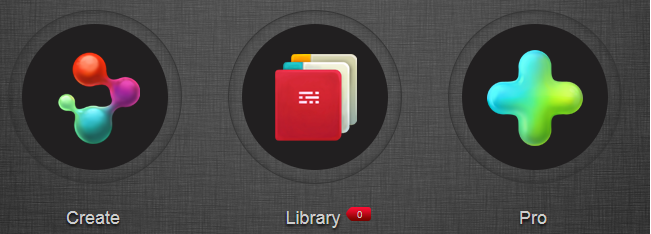 Create
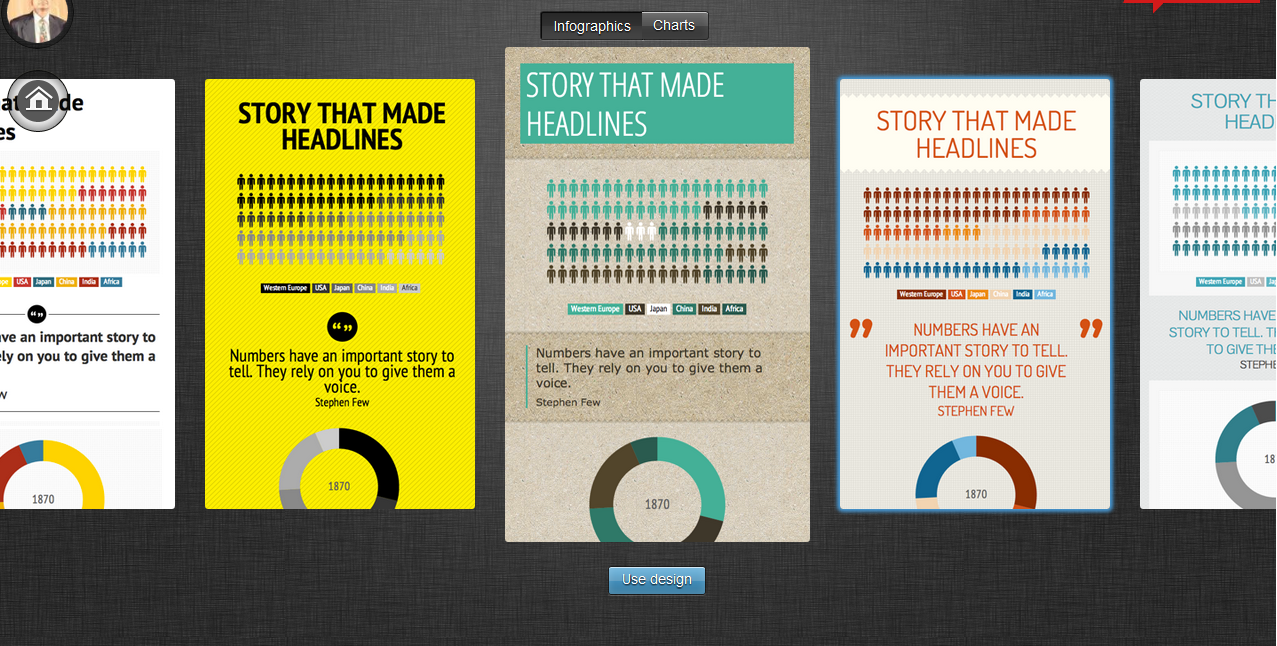 Choose New Infographic or New Chart?
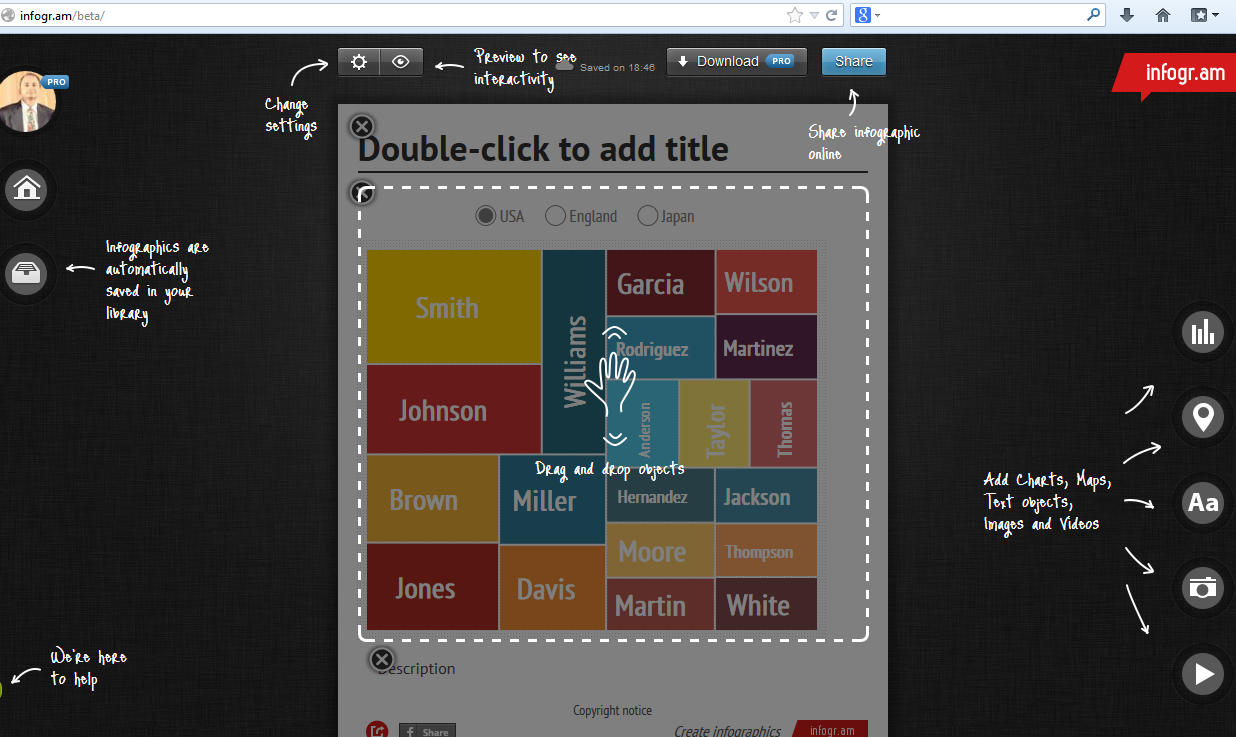 Create using options-you can edit the table, figures, text, colors etc