UPDATED- Here are three great examples of a visualization making a process easy to understand. Please click on the images to read them clearly.
1) It visualizes CRISP-DM and is made by Nicole Leaper (http://exde.wordpress.com/2009/03/13/a-visual-guide-to-crisp-dm-methodology/)

2) KDD -Knowledge Discovery in Databases -visualization by Fayyad whom I have interviewed here at http://www.decisionstats.com/interview-dr-usama-fayyad-founder-open-insights-llc/
and work By Gregory Piatetsky Shapiro interviewed by this website here
https://decisionstats.com/2009/08/13/interview-gregory-piatetsky-kdnuggets-com/
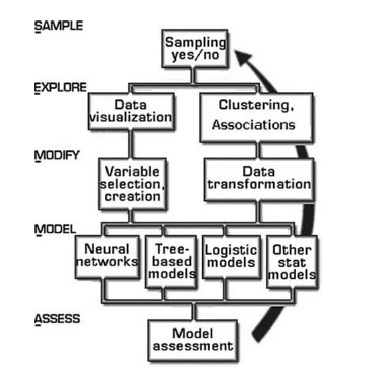
3) I am also attaching a visual representation of SEMMA from http://www.dataprix.net/en/blogs/respinosamilla/theory-data-mining