
What is an Infographic?
http://en.wikipedia.org/wiki/Infographic
Information graphics or infographics are graphic visual representations of information, data or knowledge intended to present complex information quickly and clearly.[1][2] They can improve cognition by utilizing graphics to enhance the human visual system’s ability to see patterns and trends.[3][4] The process of creating infographics can be referred to as data visualization, information design, or information architecture.[2]
What is Infogr.am?
It Create infographics and interactive online charts. It’s free and super-easy!
How?
Step 1
Login using Twitter or Facebook
Step 2
 Create
Step 3
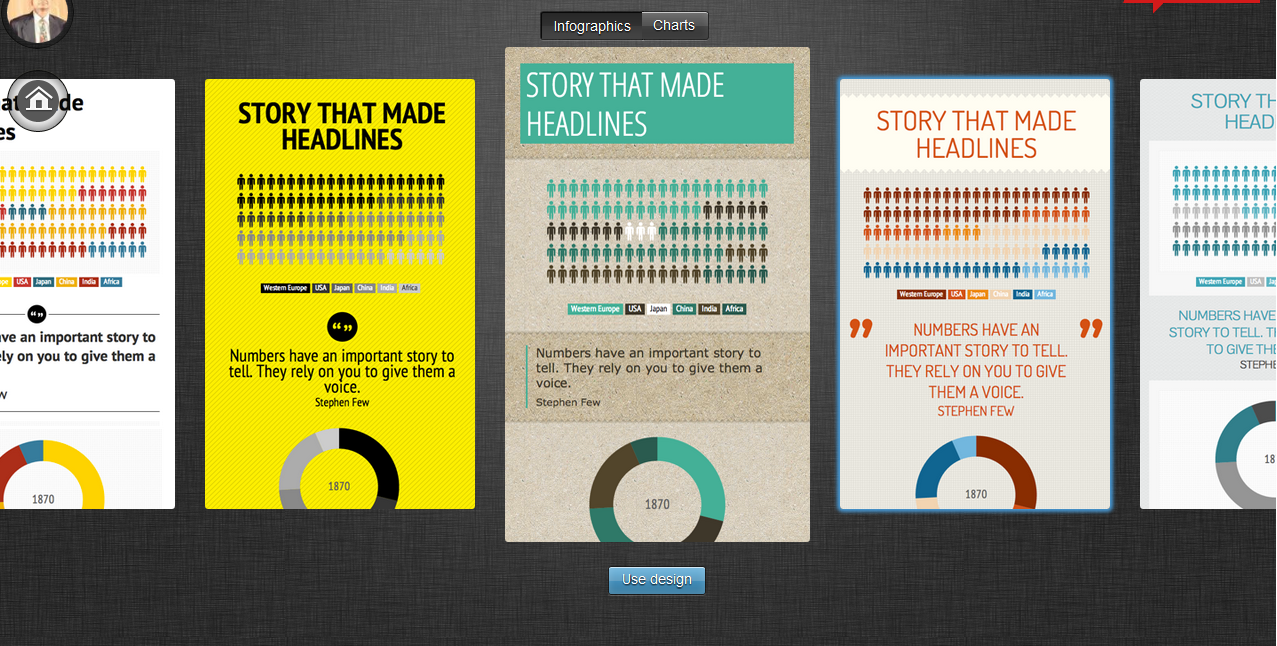 Choose New Infographic or New Chart?
Step 4
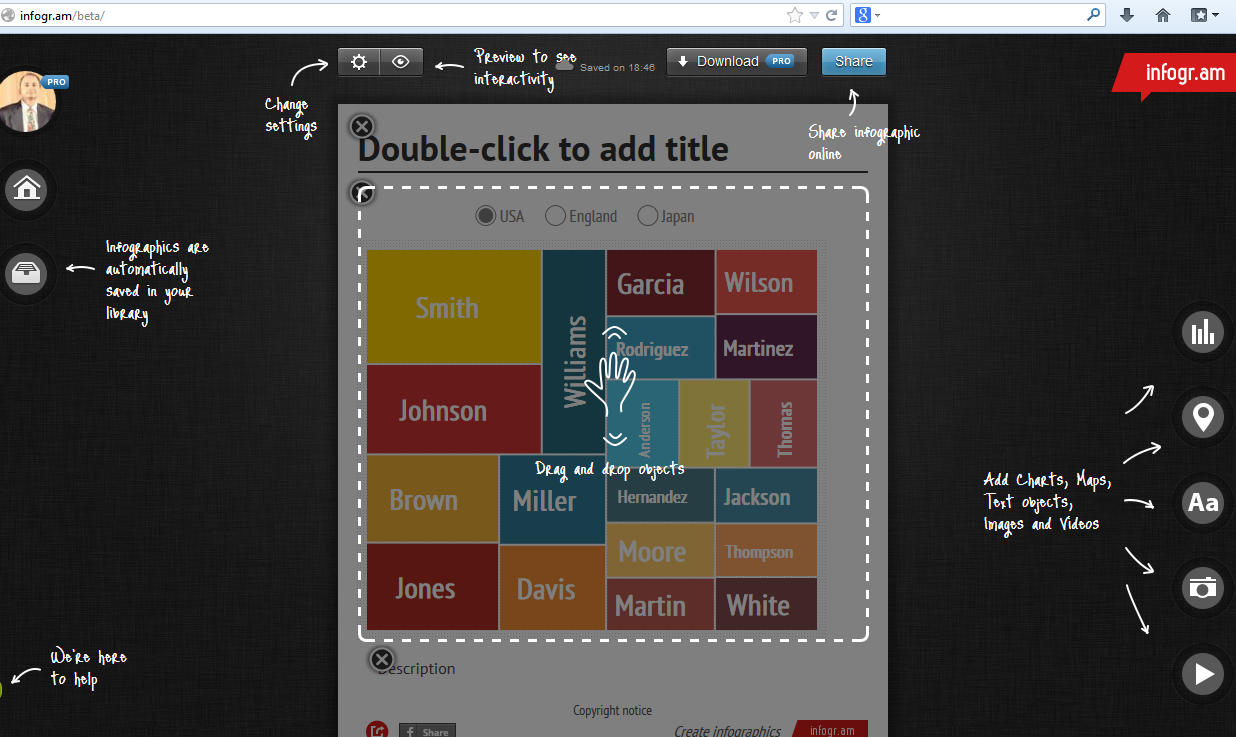 Create using options-you can edit the table, figures, text, colors etc
That’s it
Use Infogr.am to make inforgraphics easily!
