WP.com made a cool change to WP- Stats , its default analytics program, It now counts visitors as well as visits. This is especially useful to writers like me who like to customize content based on analytics ( GA Analytics does not work on WordPress.com hosted sites) and who dont want to bother with hosting /hacking (WP.com is much more hassle free than self-hosted , or even Rackspace hosted in my experience).
Of course the guy DOS-ing my poetry blog (via Yahoo Image Service) needs to use Tor to hide. Unless they dont want to hide and just want to click on my Roses poem 200 times (passing a subliminal message?) . Of course GA Analytics loves line charts and WP Stats loves Bar Charts, but we wont get into that.
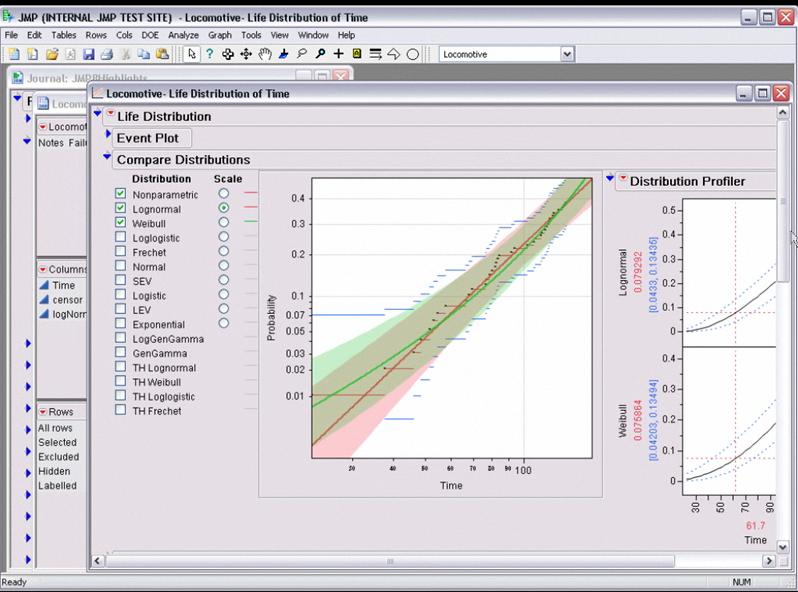
I really liked the initiatives at JMP/Academic. Not only they offer the software bundled with a textbook, which is both good common sense as well as business sense given how fast students can get confused
(Rant 1 Bundling with textbooks is something I think is Revolution Analytics should think of doing instead of just offering the academic version for free downloading- it would be interesting to see the penetration of R academic market with Revolution’s version and the open source version with the existing strategy)
Major publishers of introductory statistics textbooks offer a 12-month license to JMP Student Edition, a streamlined version of JMP, with their textbooks.
Oracle, SAP- Hana, Revolution Analytics and even SAS/STAT itself can make more reference cards like this- elegant solutions for students and new learners!
More- creative-rants Honestly why do corporate sites use PDFs anymore when they can use Instapaper , or any of these SlideShare/Scribd formats to show information in a better way without diverting the user from the main webpage.
But I digress, back to JMP
Resources for Faculty Using JMP® Student Edition
Faculty who select a JMP Student Edition bundle for their courses may be eligible for additional resources, including course materials and training.
Special JMP® Student Edition for AP Statistics
JMP Student Edition is available in a convenient five-year license for qualified Advanced Placement statistics programs.
Here is an interview with Hjálmar Gíslason, CEO of Datamarket.com . DataMarket is an active marketplace for structured data and statistics. Through powerful search and visual data exploration, DataMarket connects data seekers with data providers.
Ajay- Describe your journey as an entrepreneur and techie in Iceland. What are the 10 things that surprised you most as a tech entrepreneur.
HG- DataMarket is my fourth tech start-up since at age 20 in 1996. The previous ones have been in gaming, mobile and web search. I come from a technical background but have been moving more and more to the business side over the years. I can still prototype, but I hope there isn’t a single line of my code in production!
Funny you should ask about the 10 things that have surprised me the most on this journey, as I gave a presentation – literally yesterday – titled: “9 things nobody told me about the start-up business”
They are:
* Do NOT generalize – especially not to begin with
* Prioritize – and find a work-flow that works for you
* Meet people – face to face
* You are a sales person – whether you like it or not
* Technology is not a product – it’s the entire experience
* Sell the current version – no matter how amazing the next one is
* Learn from mistakes – preferably others’
* Pick the right people – good people is not enough
* Tell a good story – but don’t make them up
I obviously elaborate on each of these points in the talk, but the points illustrate roughly some of the things I believe I’ve learned … so far 😉
Both Amazon and Google have entered the public datasets space. Infochimps has 14,000+ public datasets. The US has http://www.data.gov/
So clearly the space is both competitive and yet the demand for public data repositories is clearly under served still.
How does DataMarket intend to address this market in a unique way to differentiate itself from others.
HG- DataMarket is about delivering business data to decision makers. We help data seekers find the data they need for planning and informed decision making, and data publishers reaching this audience. DataMarket.com is the meeting point, where data seekers can come to find the best available data, and data publishers can make their data available whether for free or for a fee. We’ve populated the site with a wealth of data from public sources such as the UN, Eurostat, World Bank, IMF and others, but there is also premium data that is only available to those that subscribe to and pay for the access. For example we resell the entire data offering from the EIU (Economist Intelligence Unit) (link: http://datamarket.com/data/list/?q=provider:eiu)
DataMarket.com allows all this data to be searched, visualized, compared and downloaded in a single place in a standard, unified manner.
We see many of these efforts not as competition, but as valuable potential sources of data for our offering, while others may be competing with parts of our proposition, such as easy access to the public data sets.
Ajay- What are your views on data confidentiality and access to data owned by Governments funded by tax payer money.
HG- My views are very simple: Any data that is gathered or created for taxpayers’ money should be open and free of charge unless higher priorities such as privacy or national security indicate otherwise.
Reflecting that, any data that is originally open and free of charge is still open and free of charge on DataMarket.com, just easier to find and work with.
Ajay- How is the technology entrepreneurship and venture capital scene in Iceland. What things work and what things can be improved?
HG- The scene is quite vibrant, given the small community. Good teams with promising concepts have been able to get the funding they need to get started and test their footing internationally. When the rapid growth phase is reached outside funding may still be needed.
There are positive and negative things about any location. Among the good things about Iceland from the stand point of a technology start-up are highly skilled tech people and a relatively simple corporate environment. Among the bad things are a tiny local market, lack of skills in international sales and marketing and capital controls that were put in place after the crash of the Icelandic economy in 2008.
I’ve jokingly said that if a company is hot in the eyes of VCs it would get funding even if it was located in the jungles of Congo, while if they’re only lukewarm towards you, they will be looking for any excuse not to invest. Location can certainly be one of them, and in that case being close to the investor communities – physically – can be very important.
We’re opening up our sales and marketing offices in Boston as we speak. Not to be close to investors though, but to be close to our market and current customers.
Ajay- Describe your hobbies when you are not founding amazing tech startups.
HG- Most of my time is spent working – which happens to by my number one hobby.
It is still important to step away from it all every now and then to see things in perspective and come back with a clear mind.
I *love* traveling to exotic places. Me and my wife have done quite a lot of traveling in Africa and S-America: safari, scuba diving, skiing, enjoying nature. When at home I try to do some sports activities 3-4 times a week at least, and – recently – play with my now 8 month old son as much as I can.
Hjálmar Gíslason, Founder and CEO: Hjalmar is a successful entrepreneur, founder of three startups in the gaming, mobile and web sectors since 1996. Prior to launching DataMarket, Hjalmar worked on new media and business development for companies in the Skipti Group (owners of Iceland Telecom) after their acquisition of his search startup – Spurl. Hjalmar offers a mix of business, strategy and technical expertise. DataMarket is based largely on his vision of the need for a global exchange for structured data.
R Authors get more choice and variety now-
http://www.mail-archive.com/r-help@r-project.org/msg122965.html
We are pleased to announce the launch of a new series of books on R.

Chapman & Hall/CRC: The R Series

Aims and Scope
This book series reflects the recent rapid growth in the development and
application of R, the programming language and software environment for
statistical computing and graphics. R is now widely used in academic research,
education, and industry. It is constantly growing, with new versions of the
core software released regularly and more than 2,600 packages available. It is
difficult for the documentation to keep pace with the expansion of the
software, and this vital book series provides a forum for the publication of
books covering many aspects of the development and application of R.

The scope of the series is wide, covering three main threads:
• Applications of R to specific disciplines such as biology, epidemiology,
genetics, engineering, finance, and the social sciences.
• Using R for the study of topics of statistical methodology, such as linear
and mixed modeling, time series, Bayesian methods, and missing data.
• The development of R, including programming, building packages, and graphics.

The books will appeal to programmers and developers of R software, as well as
applied statisticians and data analysts in many fields. The books will feature
detailed worked examples and R code fully integrated into the text, ensuring
their usefulness to researchers, practitioners and students.

Series Editors
John M. Chambers (Department of Statistics, Stanford University, USA;
j...@stat.stanford.edu)
Torsten Hothorn (Institut für Statistik, Ludwig-Maximilians-Universität,
München, Germany; torsten.hoth...@stat.uni-muenchen.de)
Duncan Temple Lang (Department of Statistics, University of California, Davis,
USA; dun...@wald.ucdavis.edu)
Hadley Wickham (Department of Statistics, Rice University, Houston, Texas, USA;
had...@rice.edu)

Call for Proposals
We are interested in books covering all aspects of the development and
application of R software. If you have an idea for a book, please contact one
of the series editors above or one of the Chapman & Hall/CRC statistics
acquisitions editors below. Please provide brief details of topic, audience,
aims and scope, and include an outline if possible.

We look forward to hearing from you.

Best regards,Rob Calver (rob.cal...@informa.com)
David Grubbs (david.gru...@taylorandfrancis.com)
John Kimmel (john.kim...@taylorandfrancis.com)
Here is an interview with Prof Luis Torgo, author of the recent best seller “Data Mining with R-learning with case studies”.
Ajay- Describe your career in science. How do you think can more young people be made interested in science.
Luis- My interest in science only started after I’ve finished my degree. I’ve entered a research lab at the University of Porto and started working on Machine Learning, around 1990. Since then I’ve been involved generally in data analysis topics both from a research perspective as well as from a more applied point of view through interactions with industry partners on several projects. I’ve spent most of my career at the Faculty of Economics of the University of Porto, but since 2008 I’m at the department of Computer Science of the Faculty of Sciences of the same university. At the same time I’ve been a researcher at LIAAD / Inesc Porto LA (www.liaad.up.pt).
I like a lot what I do and like science and the “scientific way of thinking”, but I cannot say that I’ve always thought of this area as my “place”. Most of all I like solving challenging problems through data analysis. If that translates into some scientific outcome than I’m more satisfied but that is not my main goal, though I’m kind of “forced” to think about that because of the constraints of an academic career.
That does not mean I’m not passionate about science, I just think there are many more ways of “doing science” than what is reflected in the usual “scientific indicators” that most institutions seem to be more and more obsessed about.
Regards interesting young people in science that is a hard question that I’m not sure I’m qualified to answer. I do tend to think that young people are more sensible to concrete examples of problems they think are interesting and that science helps in solving, as a way of finding a motivation for facing the hard work they will encounter in a scientific career. I do believe in case studies as a nice way to learn and motivate, and thus my book 😉
Ajay- Describe your new book “Data Mining with R, learning with case studies” Why did you choose a case study based approach? who is the target audience? What is your favorite case study from the book
Luis- This book is about learning how to use R for data mining. The book follows a “learn by doing it” approach to data mining instead of the more common theoretical description of the available techniques in this discipline. This is accomplished by presenting a series of illustrative case studies for which all necessary steps, code and data are provided to the reader. Moreover, the book has an associated web page (www.liaad.up.pt/~ltorgo/DataMiningWithR) where all code inside the book is given so that easy copy-paste is possible for the more lazy readers.
The language used in the book is very informal without many theoretical details on the used data mining techniques. For obtaining these theoretical insights there are already many good data mining books some of which are referred in “further readings” sections given throughout the book. The decision of following this writing style had to do with the intended target audience of the book.
In effect, the objective was to write a monograph that could be used as a supplemental book for practical classes on data mining that exist in several courses, but at the same time that could be attractive to professionals working on data mining in non-academic environments, and thus the choice of this more practically oriented approach.
Regards my favorite case study that is a hard question for an author… still I would probably choose the “Predicting Stock Market Returns” case study (Chapter 3). Not only because I like this challenging problem, but mainly because the case study addresses all aspects of knowledge discovery in a real world scenario and not only the construction of predictive models. It tackles data collection, data pre-processing, model construction, transforming predictions into actions using different trading policies, using business-related performance metrics, implementing a trading simulator for “real-world” evaluation, and laying out grounds for constructing an online trading system.
Obviously, for all these steps there are far too many options to be possible to describe/evaluate all of them in a chapter, still I do believe that for the reader it is important to see the overall picture, and read about the relevant questions on this problem and some possible paths that can be followed at these different steps.
In other words: do not expect to become rich with the solution I describe in the chapter !
Ajay- Apart from R, what other data mining software do you use or have used in the past. How would you compare their advantages and disadvantages with R
Luis- I’ve played around with Clementine, Weka, RapidMiner and Knime, but really only playing with teaching goals, and no serious use/evaluation in the context of data mining projects. For the latter I mainly use R or software developed by myself (either in R or other languages). In this context, I do not think it is fair to compare R with these or other tools as I lack serious experience with them. I can however, tell you about what I see as the main pros and cons of R. The main reason for using R is really not only the power of the tool that does not stop surprising me in terms of what already exists and keeps appearing as contributions of an ever growing community, but mainly the ability of rapidly transforming ideas into prototypes. Regards some of its drawbacks I would probably mention the lack of efficiency when compared to other alternatives and the problem of data set sizes being limited by main memory.
I know that there are several efforts around for solving this latter issue not only from the community (e.g. http://cran.at.r-project.org/web/views/HighPerformanceComputing.html), but also from the industry (e.g. Revolution Analytics), but I would prefer that at this stage this would be a standard feature of the language so the the “normal” user need not worry about it. But then this is a community effort and if I’m not happy with the current status instead of complaining I should do something about it!
Ajay- Describe your writing habit- How do you set about writing the book- did you write a fixed amount daily or do you write in bursts etc
Luis- Unfortunately, I write in bursts whenever I find some time for it. This is much more tiring and time consuming as I need to read back material far too often, but I cannot afford dedicating too much consecutive time to a single task. Actually, I frequently tease my PhD students when they “complain” about the lack of time for doing what they have to, that they should learn to appreciate the luxury of having a single task to complete because it will probably be the last time in their professional life!
Ajay- What do you do to relax or unwind when not working?
Luis- For me, the best way to relax from work is by playing sports. When I’m involved in some game I reset my mind and forget about all other things and this is very relaxing for me. A part from sports I enjoy a lot spending time with my family and friends. A good and long dinner with friends over a good bottle of wine can do miracles when I’m too stressed with work! Finally,I do love traveling around with my family.
Short Bio: Luis Torgo has a degree in Systems and Informatics Engineering and a PhD in Computer Science. He is an Associate Professor of the Department of Computer Science of the Faculty of Sciences of the University of Porto. He is also a researcher of the Laboratory of Artificial Intelligence and Data Analysis (LIAAD) belonging to INESC Porto LA. Luis Torgo has been an active researcher in Machine Learning and Data Mining for more than 20 years. He has lead several academic and industrial Data Mining research projects. Luis Torgo accompanies the R project almost since its beginning, using it on his research activities. He teaches R at different levels and has given several courses in different countries.
For reading “Data Mining with R” – you can visit this site, also to avail of a 20% discount the publishers have generously given (message below)-
For more information and to place an order, visit us at http://www.crcpress.com. Order online and apply 20% Off discount code 907HM at checkout. CRC is pleased to offer free standard shipping on all online orders!
Price: $79.95 Cat. #: K10510 ISBN: 9781439810187 ISBN 10: 1439810184 Publication Date: November 09, 2010 Number of Pages: 305 Availability: In Stock Binding(s): Hardback
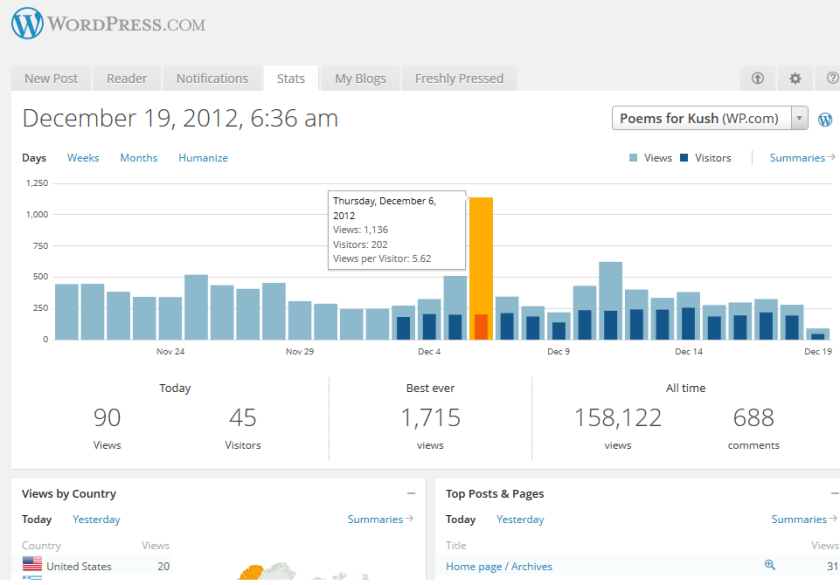
The following is an auto generated post thanks to WordPress.com stats team- clearly they have got some stuff wrong
1) Defining the speedometer quantitatively
2) The busiest day numbers are plain wrong ( 2 views ??)
3) There is still no geographic data in WordPress -com stats (unlike Google Analytics) and I cant enable Google Analytics on a wordpress.com hosted site.
The stats helper monkeys at WordPress.com mulled over how this blog did in 2010, and here’s a high level summary of its overall blog health:
The Blog-Health-o-Meter™ reads Wow.
Crunchy numbers
The Louvre Museum has 8.5 million visitors per year. This blog was viewed about 97,000 times in 2010. If it were an exhibit at The Louvre Museum, it would take 4 days for that many people to see it.
In 2010, there were 367 new posts, growing the total archive of this blog to 1191 posts. There were 411 pictures uploaded, taking up a total of 121mb. That’s about 1 pictures per day.
The top referring sites in 2010 were r-bloggers.com, reddit.com, rattle.togaware.com, twitter.com, and Google Reader.
Some visitors came searching, mostly for libre office, facebook analytics, test drive a chrome notebook, test drive a chrome notebook., and wps sas lawsuit.
Attractions in 2010
These are the posts and pages that got the most views in 2010.


 Hjálmar Gíslason, Founder and CEO: Hjalmar is a successful entrepreneur, founder of three startups in the gaming, mobile and web sectors since 1996. Prior to launching DataMarket, Hjalmar worked on new media and business development for companies in the Skipti Group (owners of Iceland Telecom) after their acquisition of his search startup – Spurl. Hjalmar offers a mix of business, strategy and technical expertise. DataMarket is based largely on his vision of the need for a global exchange for structured data.