How to learn to be a hacker easily

1) Are you sure. It is tough to be a hacker. And football players get all the attention.

2) Really? Read on

3) Read Hacker’s Code

http://muq.org/~cynbe/hackers-code.html

The Hacker’s Code

“A hacker of the Old Code.”

  • Hackers come and go, but a great hack is forever.
  • Public goods belong to the public.*
  • Software hoarding is evil.
    Software does the greatest good given to the greatest number.
  • Don’t be evil.
  • Sourceless software sucks.
  • People have rights.
    Organizations live on sufferance.
  • Governments are organizations.
  • If it is wrong when citizens do it,
    it is wrong when governments do it.
  • Information wants to be free.
    Information deserves to be free.
  • Being legal doesn’t make it right.
  • Being illegal doesn’t make it wrong.
  • Subverting tyranny is the highest duty.
  • Trust your technolust!

4) Read How to be a hacker by

Eric Steven Raymond

http://www.catb.org/~esr/faqs/hacker-howto.html

or just get the Hacker Attitude

The Hacker Attitude

1. The world is full of fascinating problems waiting to be solved.
2. No problem should ever have to be solved twice.
3. Boredom and drudgery are evil.
4. Freedom is good.
5. Attitude is no substitute for competence.
5) If you are tired of reading English, maybe I should move on to technical stuff
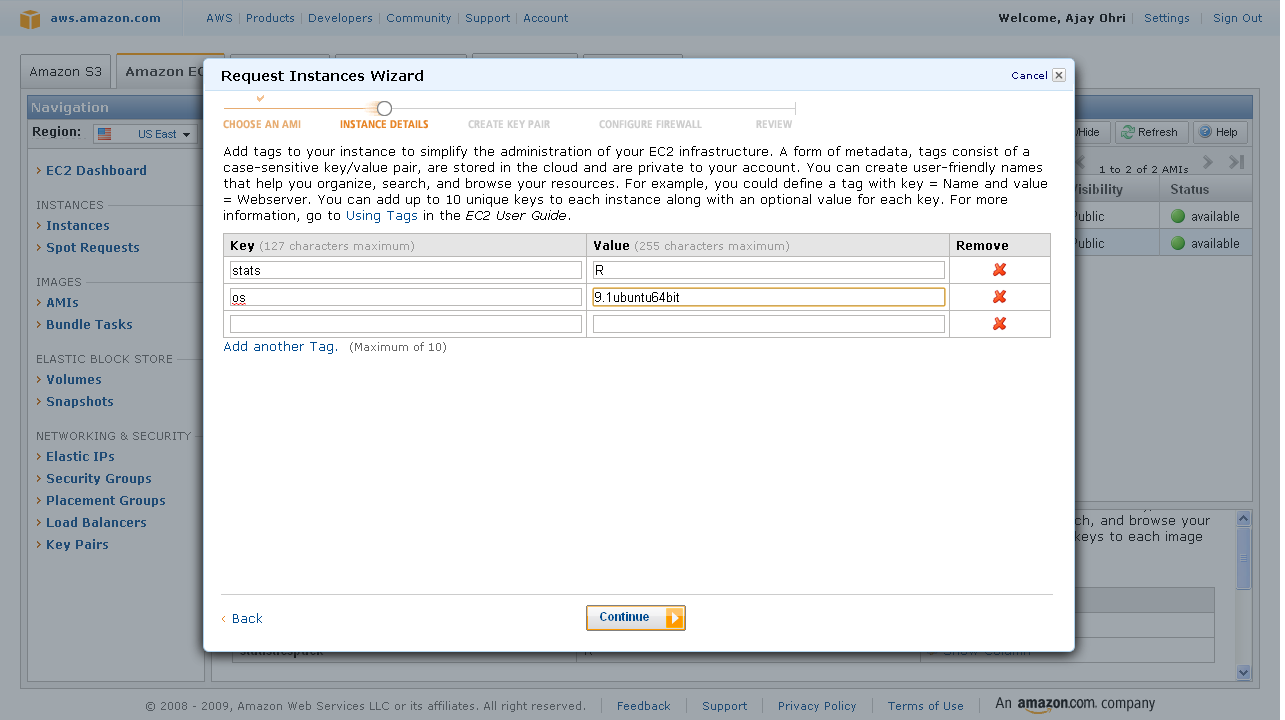
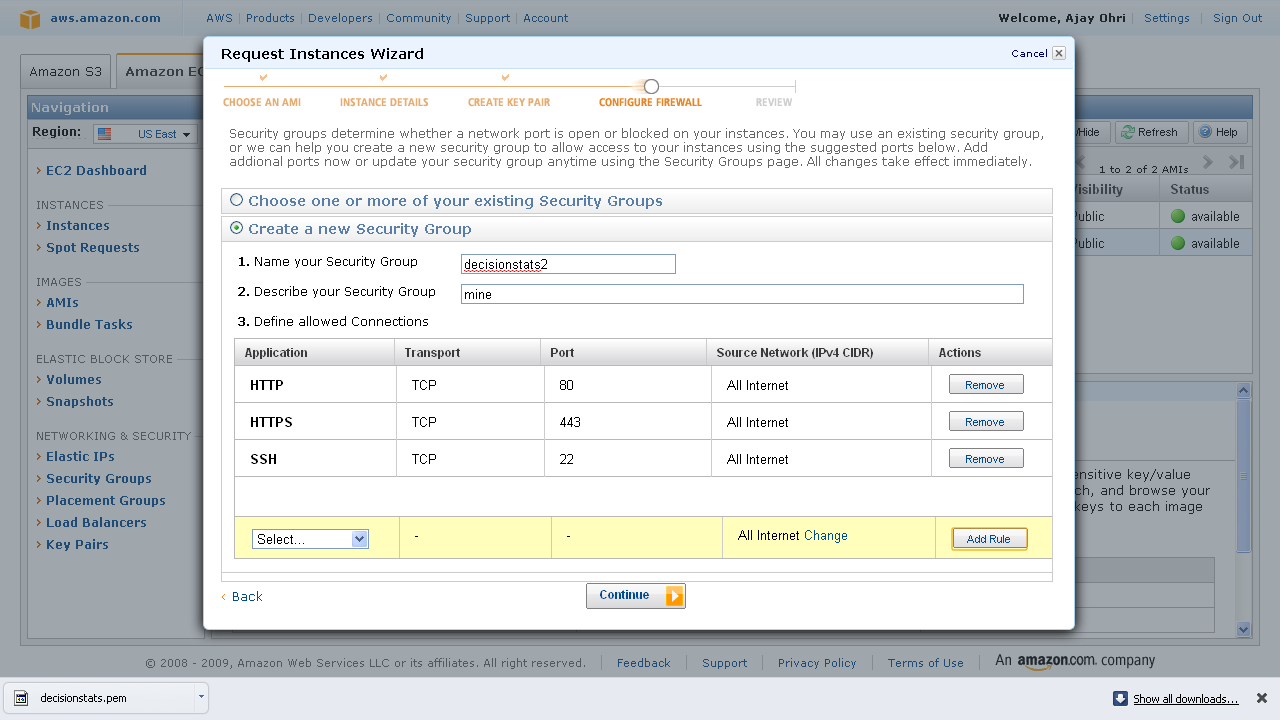
6) Create your hacking space, a virtual disk on your machine.
You will need to learn a bit of Linux. If you are a Windows user, I recommend creating a VMWare partition with Ubuntu
If you like Mac, I recommend the more aesthetic Linux Mint.
How to create your virtual disk-
read here-
Download VM Player here
http://www.vmware.com/support/product-support/player/
Down iso image of operating system here
http://ubuntu.com
Downloading is the longest thing in this exercise
Now just do what is written here
http://www.vmware.com/pdf/vmware_player40.pdf
or if you want to try and experiment with other ways to use Windows and Linux just read this
http://www.decisionstats.com/ways-to-use-both-windows-and-linux-together/
Moving data back and forth between your new virtual disk and your old real disk
http://www.decisionstats.com/moving-data-between-windows-and-ubuntu-vmware-partition/
7) Get Tor to hide your IP address when on internet
https://www.torproject.org/docs/tor-doc-windows.html.en
8a ) Block Ads using Ad-block plugin when surfing the internet (like 14.95 million other users)
https://addons.mozilla.org/en-US/firefox/addon/adblock-plus/
 8b) and use Mafiafire to get elusive websites
https://addons.mozilla.org/en-US/firefox/addon/mafiaafire-redirector/
9) Get a  Bit Torrent Client at http://www.utorrent.com/
This will help you download stuff
10) Hacker Culture Alert-
This instruction is purely for sharing the culture but not the techie work of being a hacker
The website Pirate bay acts like a search engine for Bit torrents 
http://thepiratebay.se/
Visiting it is considered bad since you can get lots of music, videos, movies etc for free, without paying copyright fees.
The website 4chan is considered a meeting place to meet other hackers. The site can be visually shocking
http://boards.4chan.org/b/
You need to do atleast set up these systems, read the websites and come back in N month time for second part in this series on how to learn to be a hacker. That will be the coding part.
END OF PART  1
Updated – sorry been a bit delayed on next part. Will post soon.

Moving data between Windows and Ubuntu VMWare partition

I use Windows 7 on my laptop (it came pre-installed) and Ubuntu using the VMWare Player. What are the advantages of using VM Player instead of creating a dual-boot system? Well I can quickly shift from Ubuntu to Windows and bakc again without restarting my computer everytime. Using this approach allows me to utilize software that run only on Windows and run software like Rattle, the R data mining GUI, that are much easier installed on Linux.

However if your statistical software is on your Virtual Disk , and your data is on your Windows disk, you need a way to move data from Windows to Ubuntu.

The solution to this as per Ubuntu forums is –http://communities.vmware.com/thread/55242

Open My Computer, browse to the folder you want to share.  Right-click on the folder, select Properties.  Sharing tab.  Select the radio button to “Share this Folder”.  Change the default generated name if you wish; add a description if you wish.  Click the Permissions button to modify the security settings of what users can read/write to the share.

On the Linux side, it depends on the distro, the shell, and the window manager.

Well Ubuntu makes it really easy to configure the Linux steps to move data within Windows and Linux partitions.


NEW UPDATE-

VMmare makes it easy to share between your Windows (host) and Linux (guest) OS


Step 1

and step 2

Do this


and

Start the Wizard

when you finish the wizard and share a drive or folder- hey where do I see my shared ones-


see this folder in Linux- /mnt/hgfs (bingo!)

Hacker HW – Make this folder //mnt/hgfs a shortcut in Places your Ubuntu startup

Hacker Hw 2-

Upload using an anon email your VM dark data to Ubuntu one

Delete VM

Purge using software XX

Reinstall VM and bring back backup


Note time to do this


-General Sharing in Windows


Just open the Network tab in Ubuntu- see screenshots below-

Windows will now ask your Ubuntu user for login-

Once Logged in Windows from within Ubuntu Vmware, this is what happens

You see a tab called “users on “windows username”- pc appear on your Ubuntu Desktop  (see top right of the screenshot)

If you double click it- you see your windows path

You can now just click and drag data between your windows and linux partitions , just the way you do it in Windows .

So based on this- if you want to build  decision trees, artifical neural networks, regression models, and even time series models for zero capital expenditure- you can use both Ubuntu/R without compromising on your IT policy of Windows only in your organization (there is a shortage of Ubuntu trained IT administrators in the enterprise world)

Revised Installation Procedure for utilizing both Ubuntu /R/Rattle data mining on your Windows PC.

Using VMWare to build a free data mining system in R, as well as isolate your analytics system (thus using both Linux and Windows without overburdening your machine)

First Time

  1. http://downloads.vmware.com/d/info/desktop_end_user_computing/vmware_player/4_0Download and Install
  2. http://www.ubuntu.com/download/ubuntu/downloadDownload Only
  3. Create New Virtual Image in VM Ware Player
  4. Applications—–Terminal——sudo apt get-install R (to download and install)
  5.                                          sudo R (to open R)
  6. Once R is opened type this  —-install.packages(rattle)—– This will install rattle
  7. library(rattle) will load Rattle—–
  8. rattle() will open the GUI—-
Getting Data from Host to Guest VM
Next Time
  1. Go to VM Player
  2. Open the VM
  3. sudo R in terminal to bring up R
  4. library(rattle) within R
  5. rattle()
At this point even if you dont know any Linux and dont know any R, you can create data mining models using the Rattle GUI (and time series model using E pack in the R Commander GUI) – What can Rattle do in data mining? See this slideshow-http://www.decisionstats.com/data-mining-with-r-gui-rattle-rstats/
If Google Docs is banned as per your enterprise organizational IT policy of having Windows Explorer only- well you can see these screenshots http://rattle.togaware.com/rattle-screenshots.html

Troubleshooting Rattle Installation- Data Mining R GUI

Screenshot of Synaptic Package Manager running...
Image via Wikipedia

I really find the Rattle GUI very very nice and easy to do any data mining task. The software is available from http://rattle.togaware.com/

The only issue is Rattle can be quite difficult to install due to dependencies on GTK+

After fiddling for a couple of years- this is what I did

1) Created dual boot OS- Basically downloaded the netbook remix from http://ubuntu.com I created a dual boot OS so you can choose at the beginning whether to use Windows or Ubuntu Linux in that session.  Alternatively you can download VM Player www.vmware.com/products/player/ if you want to do both

2) Download R packages using Ubuntu packages and Install GTK+ dependencies before that.

GTK + Requires

  1. Libglade
  2. Glib
  3. Cairo
  4. Pango
  5. ATK

If  you are a Linux newbie like me who doesnt get the sudo apt get, tar, cd, make , install rigmarole – scoot over to synaptic software packages or just the main ubuntu software centre and download these packages one by one.

For R Dependencies, you need

  • PMML
  • XML
  • RGTK2

Again use r-cran as the prefix to these package names and simply install (almost the same way Windows does it easily -double click)

see http://packages.ubuntu.com/search?suite=lucid&searchon=names&keywords=r-cran

4) Install Rattle from source

http://rattle.togaware.com/rattle-download.html

Advanced users can download the Rattle source packages directly:

Save theses to your hard disk (e.g., to your Desktop) but don’t extract them. Then, on GNU/Linux run the install command shown below. This command is entered into a terminal window:

  • R CMD INSTALL rattle_2.6.0.tar.gz

After installation-

5) Type library(rattle) and rattle.info to get messages on what R packages to update for a proper functioning

</code>

> library(rattle)
Rattle: Graphical interface for data mining using R.
Version 2.6.0 Copyright (c) 2006-2010 Togaware Pty Ltd.
Type 'rattle()' to shake, rattle, and roll your data.
> rattle.info()
Rattle: version 2.6.0
R: version 2.11.1 (2010-05-31) (Revision 52157)

Sysname: Linux
Release: 2.6.35-23-generic
Version: #41-Ubuntu SMP Wed Nov 24 10:18:49 UTC 2010
Nodename: k1-M725R
Machine: i686
Login: k1ng
User: k1ng

Installed Dependencies
RGtk2: version 2.20.3
pmml: version 1.2.26
colorspace: version 1.0-1
cairoDevice: version 2.14
doBy: version 4.1.2
e1071: version 1.5-24
ellipse: version 0.3-5
foreign: version 0.8-41
gdata: version 2.8.1
gtools: version 2.6.2
gplots: version 2.8.0
gWidgetsRGtk2: version 0.0-69
Hmisc: version 3.8-3
kernlab: version 0.9-12
latticist: version 0.9-43
Matrix: version 0.999375-46
mice: version 2.4
network: version 1.5-1
nnet: version 7.3-1
party: version 0.9-99991
playwith: version 0.9-53
randomForest: version 4.5-36 upgrade available 4.6-2
rggobi: version 2.1.16
survival: version 2.36-2
XML: version 3.2-0
bitops: version 1.0-4.1

Upgrade the packages with:

 > install.packages(c("randomForest"))

<code>

Now upgrade whatever package rattle.info tells to upgrade.

This is much simpler and less frustrating than some of the other ways to install Rattle.

If all goes well, you will see this familiar screen popup when you type

>rattle()


Choosing R for business – What to consider?

A composite of the GNU logo and the OSI logo, ...
Image via Wikipedia

Additional features in R over other analytical packages-

1) Source Code is given to ensure complete custom solution and embedding for a particular application. Open source code has an advantage that is extensively peer- reviewed in Journals and Scientific Literature.  This means bugs will found, shared and corrected transparently.

2) Wide literature of training material in the form of books is available for the R analytical platform.

3) Extensively the best data visualization tools in analytical software (apart from Tableau Software ‘s latest version). The extensive data visualization available in R is of the form a variety of customizable graphs, as well as animation. The principal reason third-party software initially started creating interfaces to R is because the graphical library of packages in R is more advanced as well as rapidly getting more features by the day.

4) Free in upfront license cost for academics and thus budget friendly for small and large analytical teams.

5) Flexible programming for your data environment. This includes having packages that ensure compatibility with Java, Python and C++.


6) Easy migration from other analytical platforms to R Platform. It is relatively easy for a non R platform user to migrate to R platform and there is no danger of vendor lock-in due to the GPL nature of source code and open community.

Statistics are numbers that tell (descriptive), advise ( prescriptive) or forecast (predictive). Analytics is a decision-making help tool. Analytics on which no decision is to be made or is being considered can be classified as purely statistical and non analytical. Thus ease of making a correct decision separates a good analytical platform from a not so good analytical platform. The distinction is likely to be disputed by people of either background- and business analysis requires more emphasis on how practical or actionable the results are and less emphasis on the statistical metrics in a particular data analysis task. I believe one clear reason between business analytics is different from statistical analysis is the cost of perfect information (data costs in real world) and the opportunity cost of delayed and distorted decision-making.

Specific to the following domains R has the following costs and benefits

  • Business Analytics
    • R is free per license and for download
    • It is one of the few analytical platforms that work on Mac OS
    • It’s results are credibly established in both journals like Journal of Statistical Software and in the work at LinkedIn, Google and Facebook’s analytical teams.
    • It has open source code for customization as per GPL
    • It also has a flexible option for commercial vendors like Revolution Analytics (who support 64 bit windows) as well as bigger datasets
    • It has interfaces from almost all other analytical software including SAS,SPSS, JMP, Oracle Data Mining, Rapid Miner. Existing license holders can thus invoke and use R from within these software
    • Huge library of packages for regression, time series, finance and modeling
    • High quality data visualization packages
    • Data Mining
      • R as a computing platform is better suited to the needs of data mining as it has a vast array of packages covering standard regression, decision trees, association rules, cluster analysis, machine learning, neural networks as well as exotic specialized algorithms like those based on chaos models.
      • Flexibility in tweaking a standard algorithm by seeing the source code
      • The RATTLE GUI remains the standard GUI for Data Miners using R. It was created and developed in Australia.
      • Business Dashboards and Reporting
      • Business Dashboards and Reporting are an essential piece of Business Intelligence and Decision making systems in organizations. R offers data visualization through GGPLOT, and GUI like Deducer and Red-R can help even non R users create a metrics dashboard
        • For online Dashboards- R has packages like RWeb, RServe and R Apache- which in combination with data visualization packages offer powerful dashboard capabilities.
        • R can be combined with MS Excel using the R Excel package – to enable R capabilities to be imported within Excel. Thus a MS Excel user with no knowledge of R can use the GUI within the R Excel plug-in to use powerful graphical and statistical capabilities.

Additional factors to consider in your R installation-

There are some more choices awaiting you now-
1) Licensing Choices-Academic Version or Free Version or Enterprise Version of R

2) Operating System Choices-Which Operating System to choose from? Unix, Windows or Mac OS.

3) Operating system sub choice- 32- bit or 64 bit.

4) Hardware choices-Cost -benefit trade-offs for additional hardware for R. Choices between local ,cluster and cloud computing.

5) Interface choices-Command Line versus GUI? Which GUI to choose as the default start-up option?

6) Software component choice- Which packages to install? There are almost 3000 packages, some of them are complimentary, some are dependent on each other, and almost all are free.

7) Additional Software choices- Which additional software do you need to achieve maximum accuracy, robustness and speed of computing- and how to use existing legacy software and hardware for best complementary results with R.

1) Licensing Choices-
You can choose between two kinds of R installations – one is free and open source from http://r-project.org The other R installation is commercial and is offered by many vendors including Revolution Analytics. However there are other commercial vendors too.

Commercial Vendors of R Language Products-
1) Revolution Analytics http://www.revolutionanalytics.com/
2) XL Solutions- http://www.experience-rplus.com/
3) Information Builder – Webfocus RStat -Rattle GUI http://www.informationbuilders.com/products/webfocus/PredictiveModeling.html
4) Blue Reference- Inference for R http://inferenceforr.com/default.aspx

  1. Choosing Operating System
      1. Windows


Windows remains the most widely used operating system on this planet. If you are experienced in Windows based computing and are active on analytical projects- it would not make sense for you to move to other operating systems. This is also based on the fact that compatibility problems are minimum for Microsoft Windows and the help is extensively documented. However there may be some R packages that would not function well under Windows- if that happens a multiple operating system is your next option.

        1. Enterprise R from Revolution Analytics- Enterprise R from Revolution Analytics has a complete R Development environment for Windows including the use of code snippets to make programming faster. Revolution is also expected to make a GUI available by 2011. Revolution Analytics claims several enhancements for it’s version of R including the use of optimized libraries for faster performance.
      1. MacOS


Reasons for choosing MacOS remains its considerable appeal in aesthetically designed software- but MacOS is not a standard Operating system for enterprise systems as well as statistical computing. However open source R claims to be quite optimized and it can be used for existing Mac users. However there seem to be no commercially available versions of R available as of now for this operating system.

      1. Linux


        1. Ubuntu
        2. Red Hat Enterprise Linux
        3. Other versions of Linux


Linux is considered a preferred operating system by R users due to it having the same open source credentials-much better fit for all R packages and it’s customizability for big data analytics.

Ubuntu Linux is recommended for people making the transition to Linux for the first time. Ubuntu Linux had an marketing agreement with revolution Analytics for an earlier version of Ubuntu- and many R packages can  installed in a straightforward way as Ubuntu/Debian packages are available. Red Hat Enterprise Linux is officially supported by Revolution Analytics for it’s enterprise module. Other versions of Linux popular are Open SUSE.

      1. Multiple operating systems-
        1. Virtualization vs Dual Boot-


You can also choose between having a VMware VM Player for a virtual partition on your computers that is dedicated to R based computing or having operating system choice at the startup or booting of your computer. A software program called wubi helps with the dual installation of Linux and Windows.

  1. 64 bit vs 32 bit – Given a choice between 32 bit versus 64 bit versions of the same operating system like Linux Ubuntu, the 64 bit version would speed up processing by an approximate factor of 2. However you need to check whether your current hardware can support 64 bit operating systems and if so- you may want to ask your Information Technology manager to upgrade atleast some operating systems in your analytics work environment to 64 bit operating systems.


  1. Hardware choices- At the time of writing this book, the dominant computing paradigm is workstation computing followed by server-client computing. However with the introduction of cloud computing, netbooks, tablet PCs, hardware choices are much more flexible in 2011 than just a couple of years back.

Hardware costs are a significant cost to an analytics environment and are also  remarkably depreciated over a short period of time. You may thus examine your legacy hardware, and your future analytical computing needs- and accordingly decide between the various hardware options available for R.
Unlike other analytical software which can charge by number of processors, or server pricing being higher than workstation pricing and grid computing pricing extremely high if available- R is well suited for all kinds of hardware environment with flexible costs. Given the fact that R is memory intensive (it limits the size of data analyzed to the RAM size of the machine unless special formats and /or chunking is used)- it depends on size of datasets used and number of concurrent users analyzing the dataset. Thus the defining issue is not R but size of the data being analyzed.

    1. Local Computing- This is meant to denote when the software is installed locally. For big data the data to be analyzed would be stored in the form of databases.
      1. Server version- Revolution Analytics has differential pricing for server -client versions but for the open source version it is free and the same for Server or Workstation versions.
      2. Workstation
    2. Cloud Computing- Cloud computing is defined as the delivery of data, processing, systems via remote computers. It is similar to server-client computing but the remote server (also called cloud) has flexible computing in terms of number of processors, memory, and data storage. Cloud computing in the form of public cloud enables people to do analytical tasks on massive datasets without investing in permanent hardware or software as most public clouds are priced on pay per usage. The biggest cloud computing provider is Amazon and many other vendors provide services on top of it. Google is also coming for data storage in the form of clouds (Google Storage), as well as using machine learning in the form of API (Google Prediction API)
      1. Amazon
      2. Google
      3. Cluster-Grid Computing/Parallel processing- In order to build a cluster, you would need the RMpi and the SNOW packages, among other packages that help with parallel processing.
    3. How much resources
      1. RAM-Hard Disk-Processors- for workstation computing
      2. Instances or API calls for cloud computing
  1. Interface Choices
    1. Command Line
    2. GUI
    3. Web Interfaces
  2. Software Component Choices
    1. R dependencies
    2. Packages to install
    3. Recommended Packages
  3. Additional software choices
    1. Additional legacy software
    2. Optimizing your R based computing
    3. Code Editors
      1. Code Analyzers
      2. Libraries to speed up R

citation-  R Development Core Team (2010). R: A language and environment for statistical computing. R Foundation for Statistical Computing,Vienna, Austria. ISBN 3-900051-07-0, URL http://www.R-project.org.

(Note- this is a draft in progress)

Using VM Player and Chromium OS on a PC

Here is a short presentation tutorial including screenshots I made of using VM Player and playing with Chromium OS. Note- Its like a Machine (light weight linux) with a Chrome Browser. The real computing is when you use Chrome Extensions and/if you have a underpowered legacy PC.

or you can see the file here if the above does not work 15 Clicks to a Cloud OS

%d bloggers like this: