Data Mining with R GUI -Rattle #Rstats

Why is RATTLE my favorite R package?
because it allows data mining in a very nice interface.
Complicated software need not have complicated interfaces.
Have a look-

(Note- download rattle from http://rattle.togaware.com)

For better visibility please click the full screen button or click the second pps below- automatically advances every 5 secs

Protected: Whats behind that pretty SAS Blog?

This content is password protected. To view it please enter your password below:

Input Data in R using the top 3 R GUI

PC-DOS was an early OS for personal computers ...
Image via Wikipedia

One area where clearly GUI methods are preferable to command line methods in R, is data input. There is no need of learning read.csv or read.table when these options are only two clicks away in any R GUI. For academics/students there is a definite need to easily access

datasets from attached packages just as it is a need for business analysts to access databases with a few clicks than learn or read pages of pdf on RODBC. However some GUI (like Rattle) need data only in data frames, rather than list or arrays-this limits R’s flexibility. These are my views but you can see and compare views of data input in R Commander, Rattle and Deducer.


The Year 2010

Nokia N800 internet tablet, with open source s...
Image via Wikipedia

My annual traffic to this blog was almost 99,000 . Add in additional views on networking sites plus the 400 plus RSS readers- so I can say traffic was 1,20,000 for 2010. Nice. Thanks for reading and hope it was worth your time. (this is a long post and will take almost 440 secs to read but the summary is just given)

My intent is either to inform you, give something useful or atleast something interesting.

see below-

Jan Feb Mar Apr May Jun
2010 6,311 4,701 4,922 5,463 6,493 4,271
Jul Aug Sep Oct Nov Dec Total
5,041 5,403 17,913 16,430 11,723 10,096 98,767


Sandro Saita from http://www.dataminingblog.com/ just named me for an award on his blog (but my surname is ohRi , Sandro left me without an R- What would I be without R :)) ).

Aw! I am touched. Google for “Data Mining Blog” and Sandro is the best that it is in data mining writing.

DMR People Award 2010
There are a lot of active people in the field of data mining. You can discuss with them on forums. You can read their blogs. You can also meet them in events such as PAW or KDD. Among the people I follow on a regular basis, I have elected:

Ajay Ori

He has been very active in 2010, especially on his blog . Good work Ajay and continue sharing your experience with us!”

What did I write in 2010- stuff.

What did you read on this blog- well thats the top posts list.

2009-12-31 to Today

Title Views
Home page More stats 21,150
Top 10 Graphical User Interfaces in Statistical Software More stats 6,237
Wealth = function (numeracy, memory recall) More stats 2,014
Matlab-Mathematica-R and GPU Computing More stats 1,946
The Top Statistical Softwares (GUI) More stats 1,405
About DecisionStats More stats 1,352
Using Facebook Analytics (Updated) More stats 1,313
Test drive a Chrome notebook. More stats 1,170
Top ten RRReasons R is bad for you ? More stats 1,157
Libre Office More stats 1,151
Interview Hadley Wickham R Project Data Visualization Guru More stats 1,007
Using Red R- R with a Visual Interface More stats 854
SAS Institute files first lawsuit against WPS- Episode 1 More stats 790
Interview Professor John Fox Creator R Commander More stats 764
R Package Creating More stats 754
Windows Azure vs Amazon EC2 (and Google Storage) More stats 726
Norman Nie: R GUI and More More stats 716
Startups for Geeks More stats 682
Google Maps – Jet Ski across Pacific Ocean More stats 670
Not so AWkward after all: R GUI RKWard More stats 579
Red R 1.8- Pretty GUI More stats 570
Parallel Programming using R in Windows More stats 569
R is an epic fail or is it just overhyped More stats 559
Enterprise Linux rises rapidly:New Report More stats 537
Rapid Miner- R Extension More stats 518
Creating a Blog Aggregator for free More stats 504
So which software is the best analytical software? Sigh- It depends More stats 473
Revolution R for Linux More stats 465
John Sall sets JMP 9 free to tango with R More stats 460

So how do people come here –

well I guess I owe Tal G for almost 9000 views ( incidentally I withdrew posting my blog from R- Bloggers and Analyticbridge blogs – due to SEO keyword reasons and some spam I was getting see (below))

http://r-bloggers.com is still the CAT’s whiskers and I read it  a lot.

I still dont know who linked my blog to a free sex movie site with 400 views but I have a few suspects.

2009-12-31 to Today

Referrer Views
r-bloggers.com 9,131
Reddit 3,829
rattle.togaware.com 1,500
Twitter 1,254
Google Reader 1,215
linkedin.com 717
freesexmovie.irwanaf.com 422
analyticbridge.com 341
Google 327
coolavenues.com 322
Facebook 317
kdnuggets.com 298
dataminingblog.com 278
en.wordpress.com 185
google.co.in 151
xianblog.wordpress.com 130
inside-r.org 124
decisionstats.com 119
ifreestores.com 117
bits.blogs.nytimes.com 108

Still reading this post- gosh let me sell you some advertising. It is only $100 a month (yes its a recession)

Advertisers are treated on First in -Last out (FILO)

I have been told I am obsessed with SEO , but I dont care much for search engines apart from Google, and yes SEO is an interesting science (they should really re name it GEO or Google Engine Optimization)

Apparently Hadley Wickham and Donald Farmer are big keywords for me so I should be more respectful I guess.

Search Terms for 365 days ending 2010-12-31 (Summarized)

2009-12-31 to Today

Search Views
libre office 925
facebook analytics 798
test drive a chrome notebook 467
test drive a chrome notebook. 215
r gui 203
data mining 163
wps sas lawsuit 158
wordle.net 133
wps sas 123
google maps jet ski 123
test drive chrome notebook 96
sas wps 89
sas wps lawsuit 85
chrome notebook test drive 83
decision stats 83
best statistics software 74
hadley wickham 72
google maps jetski 72
libreoffice 70
doug savage 65
hive tutorial 58
funny india 56
spss certification 52
donald farmer microsoft 51
best statistical software 49

What about outgoing links? Apparently I need to find a way to ask Google to pay me for the free advertising I gave their chrome notebook launch. But since their search engine and browser is free to me, guess we are even steven.

Clicks for 365 days ending 2010-12-31 (Summarized)

2009-12-31 to Today

URL Clicks
rattle.togaware.com 378
facebook.com/Decisionstats 355
rapid-i.com/content/view/182/196 319
services.google.com/fb/forms/cr48basic 313
red-r.org 228
decisionstats.wordpress.com/2010/05/07/the-top-statistical-softwares-gui 199
teamwpc.co.uk/products/wps 162
r4stats.com/popularity 148
r-statistics.com/2010/04/r-and-the-google-summer-of-code-2010-accepted-students-and-projects 138
socserv.mcmaster.ca/jfox/Misc/Rcmdr 138
spss.com/certification 116
learnr.wordpress.com 114
dudeofdata.com/decisionstats 108
r-project.org 107
documentfoundation.org/faq 104
goo.gl/maps/UISY 100
inside-r.org/download 96
en.wikibooks.org/wiki/R_Programming 92
nytimes.com/external/readwriteweb/2010/12/07/07readwriteweb-report-google-offering-chrome-notebook-test-11919.html 92
sourceforge.net/apps/mediawiki/rkward/index.php?title=Main_Page 92
analyticdroid.togaware.com 88
yeroon.net/ggplot2 87

so in 2010,

SAS remained top daddy in business analytics,

R made revolutionary strides in terms of new packages,

JMP  launched a new version,

SPSS got integrated with Cognos,

Oracle sued Google and did build a great Data Mining GUI,

Libre Office gave you a non Oracle Open office ( or open even more office)

2011 looks like  a fun year. Have safe partying .

Who searches for this Blog?

Statue of Michael Jackson in Eindhoven, the Ne...
Image via Wikipedia

Using WP- Stats I set about answering this question-

What search keywords lead here-

Clearly Michael Jackson is down this year

And R GUI, Data Mining is up.

How does that affect my writing- given I get almost 250 visitors by search engines alone daily- assume I write nothing on this blog from now on.

It doesnt- I still write what ever code or poem that comes to my mind. So it is hurtful people misunderstimate the effort in writing and jump to conclusions (esp if I write about a company- I am not on payroll of that company- just like if  I write about a poem- I am not a full time poet)
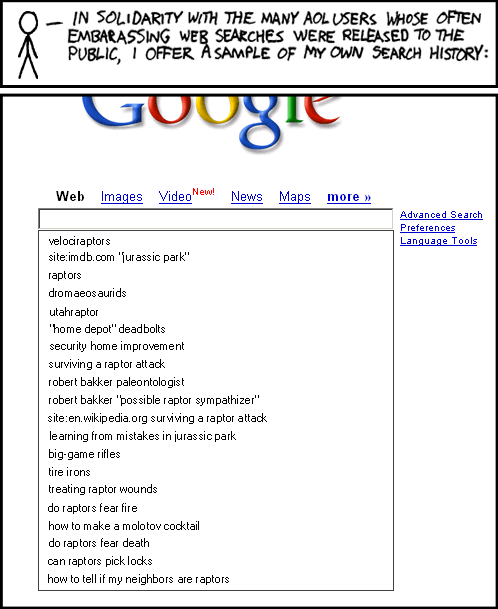
Over to xkcd

All Time (for Decisionstats.Wordpress.com)

Search Views
libre office 818
facebook analytics 806
michael jackson history 240
wps sas lawsuit 180
r gui 168
wps sas 154
wordle.net 118
sas wps 116
decision stats 110
sas wps lawsuit 100
google maps jet ski 94
data mining 88
doug savage 72
hive tutorial 63
spss certification 63
hadley wickham 63
google maps jetski 62
sas sues wps 60
decisionstats 58
donald farmer microsoft 45
libreoffice 44
wps statistics 44
best statistics software 42
r gui ubuntu 41
rstat 37
tamilnadu advanced technical training institute tatti 37

YTD

2009-11-24 to Today

Search Views
libre office 818
facebook analytics 781
wps sas lawsuit 170
r gui 164
wps sas 125
wordle.net 118
sas wps 101
sas wps lawsuit 95
google maps jet ski 94
data mining 86
decision stats 82
doug savage 63
hadley wickham 63
google maps jetski 62
hive tutorial 56
donald farmer microsoft 45

Message from RATTLE

Microsoft Windows Vista Wallpaper
Image by Brajeshwar via Flickr

A new release of the R GUI Rattle is making its way to CRAN (currently on the Austrian server).

Latest version 2.5.47 (revision 527) released 13 Nov 2010.

Change Log link for details –

http://cran.r-project.org/web/packages/rattle/index.html

Major changes relate to simplifying the installation of Rattle under the recently released R 2.12.0 on Microsoft Windows 32bit and 64bit.

The major advance for R 2.12.0 is the improved support for 64bit Microsoft Windows and thus support for much larger datasets in memory.

See the new installation steps at http://datamining.togaware.com/survivor/Internet_Connected.html

For Microsoft Windows installations, to upgrade your Rattle installation you may need to remove any old installs of the Gtk+ libraries using the Uninstall application from the Microsoft Windows Control Panel). Then install the new Gtk2 library:

http://downloads.sourceforge.net/gtk-win/gtk2-runtime-2.22.0-2010-10-21-ash.exe

You can the update Rattle to version 2.5.47:

> install.packages(“rattle“)

>library(rattle)

rattle.info()

The output from rattle.info() will include an “install.packages” command that will identify Rattle related packages that have updates available. You can cut-and-paste that command to the R prompt to have those packages updated in your installation.

Citation- From rattle-users@googlegroups.com

http://rattle.togaware.com/

Doing Time Series using a R GUI

The Xerox Star Workstation introduced the firs...
Image via Wikipedia

Until recently I had been thinking that RKWard was the only R GUI supporting Time Series Models-

however Bob Muenchen of http://www.r4stats.com/ was helpful to point out that the Epack Plugin provides time series functionality to R Commander.

Note the GUI helps explore various time series functionality.

Using Bulkfit you can fit various ARMA models to dataset and choose based on minimum AIC


> bulkfit(AirPassengers$x)
$res
ar d ma      AIC
[1,]  0 0  0 1790.368
[2,]  0 0  1 1618.863
[3,]  0 0  2 1522.122
[4,]  0 1  0 1413.909
[5,]  0 1  1 1397.258
[6,]  0 1  2 1397.093
[7,]  0 2  0 1450.596
[8,]  0 2  1 1411.368
[9,]  0 2  2 1394.373
[10,]  1 0  0 1428.179
[11,]  1 0  1 1409.748
[12,]  1 0  2 1411.050
[13,]  1 1  0 1401.853
[14,]  1 1  1 1394.683
[15,]  1 1  2 1385.497
[16,]  1 2  0 1447.028
[17,]  1 2  1 1398.929
[18,]  1 2  2 1391.910
[19,]  2 0  0 1413.639
[20,]  2 0  1 1408.249
[21,]  2 0  2 1408.343
[22,]  2 1  0 1396.588
[23,]  2 1  1 1378.338
[24,]  2 1  2 1387.409
[25,]  2 2  0 1440.078
[26,]  2 2  1 1393.882
[27,]  2 2  2 1392.659
$min
ar        d       ma      AIC
2.000    1.000    1.000 1378.338
> ArimaModel.5 <- Arima(AirPassengers$x,order=c(0,1,1),
+ include.mean=1,
+   seasonal=list(order=c(0,1,1),period=12))
> ArimaModel.5
Series: AirPassengers$x
ARIMA(0,1,1)(0,1,1)[12]
Call: Arima(x = AirPassengers$x, order = c(0, 1, 1), seasonal = list(order = c(0,      1, 1), period = 12), include.mean = 1)
Coefficients:
ma1     sma1
-0.3087  -0.1074
s.e.   0.0890   0.0828
sigma^2 estimated as 135.4:  log likelihood = -507.5
AIC = 1021   AICc = 1021.19   BIC = 1029.63
> summary(ArimaModel.5, cor=FALSE)
Series: AirPassengers$x
ARIMA(0,1,1)(0,1,1)[12]
Call: Arima(x = AirPassengers$x, order = c(0, 1, 1), seasonal = list(order = c(0,      1, 1), period = 12), include.mean = 1)
Coefficients:
ma1     sma1
-0.3087  -0.1074
s.e.   0.0890   0.0828
sigma^2 estimated as 135.4:  log likelihood = -507.5
AIC = 1021   AICc = 1021.19   BIC = 1029.63
In-sample error measures:
ME        RMSE         MAE         MPE        MAPE        MASE
0.32355285 11.09952005  8.16242469  0.04409006  2.89713514  0.31563730
Dataset79 <- predar3(ArimaModel.5,fore1=5)


And I also found an interesting Ref Sheet for Time Series functions in R-

http://cran.r-project.org/doc/contrib/Ricci-refcard-ts.pdf

and a slightly more exhaustive time series ref card

http://www.statistische-woche-nuernberg-2010.org/lehre/bachelor/datenanalyse/Refcard3.pdf

Also of interest a matter of opinion on issues in Time Series Analysis in R at

http://www.stat.pitt.edu/stoffer/tsa2/Rissues.htm

Of course , if I was the sales manager for SAS ETS I would be worried given the increasing capabilities in Time Series in R. But then again some deficiencies in R GUI for Time Series-

1) Layout is not very elegant

2) Not enough documented help (atleast for the Epack GUI- and no integrated help ACROSS packages-)

3) Graphical capabilties need more help documentation to interpret the output (especially in ACF and PACF plots)

More resources on Time Series using R.

http://people.bath.ac.uk/masgs/time%20series/TimeSeriesR2004.pdf

and http://www.statoek.wiso.uni-goettingen.de/veranstaltungen/zeitreihen/sommer03/ts_r_intro.pdf

and books

http://www.springer.com/economics/econometrics/book/978-0-387-77316-2

http://www.springer.com/statistics/statistical+theory+and+methods/book/978-0-387-75960-9

http://www.springer.com/statistics/statistical+theory+and+methods/book/978-0-387-75958-6

http://www.springer.com/statistics/statistical+theory+and+methods/book/978-0-387-75966-1

%d bloggers like this: