Here is a short list of resources and material I put together as starting points for R and Cloud Computing It’s a bit messy but overall should serve quite comprehensively.
Cloud computing is a commonly used expression to imply a generational change in computing from desktop-servers to remote and massive computing connections,shared computers, enabled by high bandwidth across the internet.
As per the National Institute of Standards and Technology Definition,
Cloud computing is a model for enabling convenient, on-demand network access to a shared pool of configurable computing resources (e.g., networks, servers, storage, applications, and services) that can be rapidly provisioned and released with minimal management effort or service provider interaction.
Rweb is developed and maintained by Jeff Banfield. The Rweb Home Page provides access to all three versions of Rweb—a simple text entry form that returns output and graphs, a more sophisticated JavaScript version that provides a multiple window environment, and a set of point and click modules that are useful for introductory statistics courses and require no knowledge of the R language. All of the Rweb versions can analyze Web accessible datasets if a URL is provided.
The paper “Rweb: Web-based Statistical Analysis”, providing a detailed explanation of the different versions of Rweb and an overview of how Rweb works, was published in the Journal of Statistical Software (http://www.jstatsoft.org/v04/i01/).
Ulf Bartel has developed R-Online, a simple on-line programming environment for R which intends to make the first steps in statistical programming with R (especially with time series) as easy as possible. There is no need for a local installation since the only requirement for the user is a JavaScript capable browser. See http://osvisions.com/r-online/ for more information.
Rcgi is a CGI WWW interface to R by MJ Ray. It had the ability to use “embedded code”: you could mix user input and code, allowing the HTMLauthor to do anything from load in data sets to enter most of the commands for users without writing CGI scripts. Graphical output was possible in PostScript or GIF formats and the executed code was presented to the user for revision. However, it is not clear if the project is still active.
Currently, a modified version of Rcgi by Mai Zhou (actually, two versions: one with (bitmap) graphics and one without) as well as the original code are available from http://www.ms.uky.edu/~statweb/.
David Firth has written CGIwithR, an R add-on package available from CRAN. It provides some simple extensions to R to facilitate running R scripts through the CGI interface to a web server, and allows submission of data using both GET and POST methods. It is easily installed using Apache under Linux and in principle should run on any platform that supports R and a web server provided that the installer has the necessary security permissions. David’s paper “CGIwithR: Facilities for Processing Web Forms Using R” was published in the Journal of Statistical Software (http://www.jstatsoft.org/v08/i10/). The package is now maintained by Duncan Temple Lang and has a web page athttp://www.omegahat.org/CGIwithR/.
Rpad, developed and actively maintained by Tom Short, provides a sophisticated environment which combines some of the features of the previous approaches with quite a bit of JavaScript, allowing for a GUI-like behavior (with sortable tables, clickable graphics, editable output), etc.
Jeff Horner is working on the R/Apache Integration Project which embeds the R interpreter inside Apache 2 (and beyond). A tutorial and presentation are available from the project web page at http://biostat.mc.vanderbilt.edu/twiki/bin/view/Main/RApacheProject.
Rserve is a project actively developed by Simon Urbanek. It implements a TCP/IP server which allows other programs to use facilities of R. Clients are available from the web site for Java and C++ (and could be written for other languages that support TCP/IP sockets).
OpenStatServer is being developed by a team lead by Greg Warnes; it aims “to provide clean access to computational modules defined in a variety of computational environments (R, SAS, Matlab, etc) via a single well-defined client interface” and to turn computational services into web services.
Two projects use PHP to provide a web interface to R. R_PHP_Online by Steve Chen (though it is unclear if this project is still active) is somewhat similar to the above Rcgi and Rweb. R-php is actively developed by Alfredo Pontillo and Angelo Mineo and provides both a web interface to R and a set of pre-specified analyses that need no R code input.
webbioc is “an integrated web interface for doing microarray analysis using several of the Bioconductor packages” and is designed to be installed at local sites as a shared computing resource.
Rwui is a web application to create user-friendly web interfaces for R scripts. All code for the web interface is created automatically. There is no need for the user to do any extra scripting or learn any new scripting techniques. Rwui can also be found at http://rwui.cryst.bbk.ac.uk.
Finally, the R.rsp package by Henrik Bengtsson introduces “R Server Pages”. Analogous to Java Server Pages, an R server page is typically HTMLwith embedded R code that gets evaluated when the page is requested. The package includes an internal cross-platform HTTP server implemented in Tcl, so provides a good framework for including web-based user interfaces in packages. The approach is similar to the use of the brew package withRapache with the advantage of cross-platform support and easy installation.
Remote access to R/Bioconductor on EBI’s 64-bit Linux Cluster
Start the workbench by downloading the package for your operating system (Macintosh or Windows), or via Java Web Start, and you will get access to an instance of R running on one of EBI’s powerful machines. You can install additional packages, upload your own data, work with graphics and collaborate with colleagues, all as if you are running R locally, but unlimited by your machine’s memory, processor or data storage capacity.
Most up-to-date R version built for multicore CPUs
Access to all Bioconductor packages
Access to our computing infrastructure
Fast access to data stored in EBI’s repositories (e.g., public microarray data in ArrayExpress)
Using R Google Docs http://www.omegahat.org/RGoogleDocs/run.pdf
It uses the XML and RCurl packages and illustrates that it is relatively quick and easy
to use their primitives to interact with Web services.
Amazon’s EC2 is a type of cloud that provides on demand computing infrastructures called an Amazon Machine Images or AMIs. In general, these types of cloud provide several benefits:
Simple and convenient to use. An AMI contains your applications, libraries, data and all associated configuration settings. You simply access it. You don’t need to configure it. This applies not only to applications like R, but also can include any third-party data that you require.
On-demand availability. AMIs are available over the Internet whenever you need them. You can configure the AMIs yourself without involving the service provider. You don’t need to order any hardware and set it up.
Elastic access. With elastic access, you can rapidly provision and access the additional resources you need. Again, no human intervention from the service provider is required. This type of elastic capacity can be used to handle surge requirements when you might need many machines for a short time in order to complete a computation.
Pay per use. The cost of 1 AMI for 100 hours and 100 AMI for 1 hour is the same. With pay per use pricing, which is sometimes called utility pricing, you simply pay for the resources that you use.
#This example requires you had previously created a bucket named data_language on your Google Storage and you had uploaded a CSV file named language_id.txt (your data) into this bucket – see for details
library(predictionapirwrapper)
Elastic-R is a new portal built using the Biocep-R platform. It enables statisticians, computational scientists, financial analysts, educators and students to use cloud resources seamlessly; to work with R engines and use their full capabilities from within simple browsers; to collaborate, share and reuse functions, algorithms, user interfaces, R sessions, servers; and to perform elastic distributed computing with any number of virtual machines to solve computationally intensive problems.
Also see Karim Chine’s http://biocep-distrib.r-forge.r-project.org/
R for Salesforce.com
At the point of writing this, there seem to be zero R based apps on Salesforce.com This could be a big opportunity for developers as both Apex and R have similar structures Developers could write free code in R and charge for their translated version in Apex on Salesforce.com
Force.com and Salesforce have many (1009) apps at http://sites.force.com/appexchange/home for cloud computing for
businesses, but very few forecasting and statistical simulation apps.
These are like iPhone apps except meant for business purposes (I am
unaware if any university is offering salesforce.com integration
though google apps and amazon related research seems to be on)
Personal Note-Mentioning SAS in an email to a R list is a big no-no in terms of getting a response and love. Same for being careless about which R help list to email (like R devel or R packages or R help)
I tried it out and have subsequently added some screenshots to this tutorial so as to help you run R. My intention of course was to run a R GUI preferable Revolution Enterprise on the Amazon EC 2- and crunch uhm a lot of data.
Note you need your Amazon Id (even the same id which you use for buying books).
Note we are into Amazon EC2 as shown by the upper tab. Click upper tab to get into the Amazon EC2
2) Choosing the right AMI-
On the left margin, you can click AMI -Images.
Now you can search for the image-
I chose Ubuntu images (linux images are cheaper) and opendata in the search as belows- I get two images.
You can choose whether you want 32 bit or 64 bit image. Thumb rule- 64 bit images are preferable for data intensive tasks.
Click on launch instance in the upper tab ( near the search feature)
2) A pop up comes up, which shows the 5 step process to launch your computing.
Choose the right compute instance- As the screenshot shows- there are various compute instances and they all are at different multiples of prices or compute units.
After choosing the compute instance of your choice (extra large is highlighted)- click on continue-
3) Instance Details-
I did not choose cloudburst monitoring as it has a extra charge- and I am just trying out things.So I simply clicked continue.
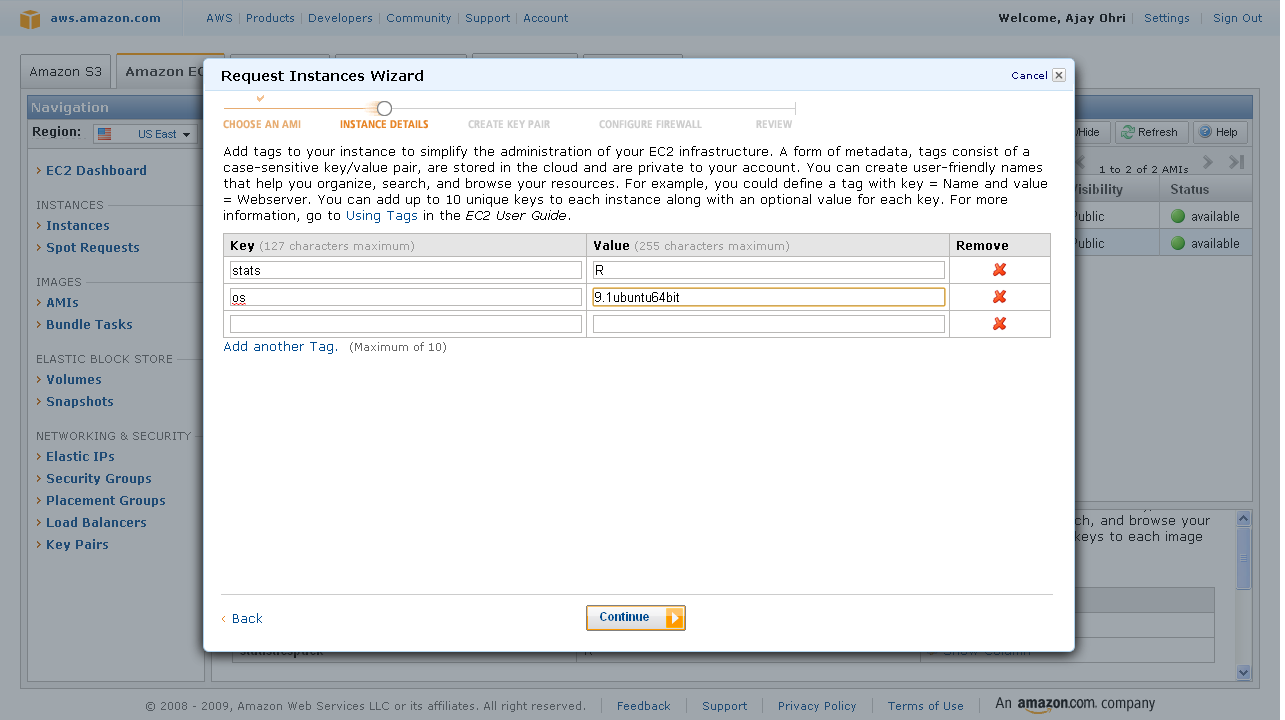
4) Add Tag Details- If you are running a lot of instances you need to create your own tags to help you manage them. Advisable if you are running many instances.
Since I am going to run just one- I clicked continue with adding just two things OS and Stats Package.
5) Create a key pair- A key pair is an added layer of encryption. Click on create new pair and name it (note the name will be handy in coming steps)
6)
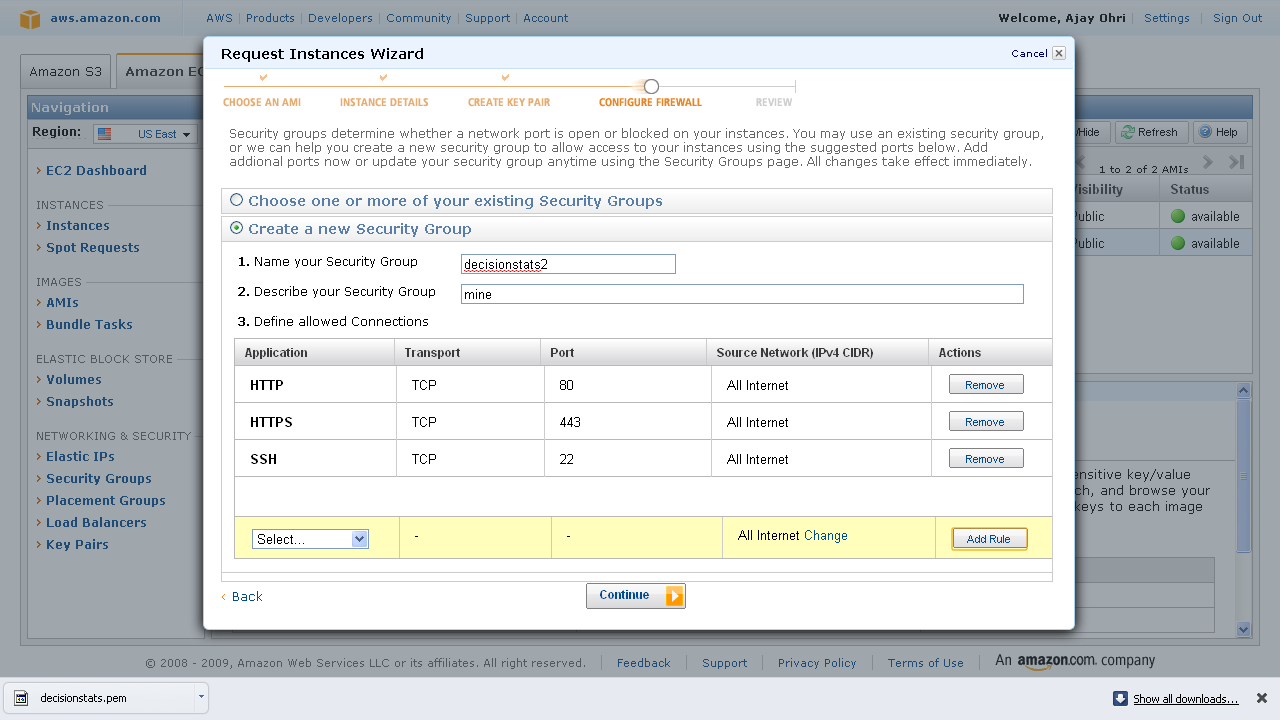
After clicking and downloading the key pair- you come into security groups. Security groups is just a set of instructions to help keep your data transfer secure. So I created a new security group.
And I added some ways in security group to connect (like SSH using Port 22)
7) Last step- Review Details and Click Launch
8) On the Left margin click on instances ( you were in Images.>AMI earlier)
It will take some 3-5 minutes to launch an instance. You can see status as pending till then.
9) Pending instance as shown by yellow light-
10) Once the instance is running -it is shown by a green light.
Click on the check box, and on upper tab go to instance actions. Click on connect-
you see a popup with instructions like these-
Open the SSH client of your choice (e.g., PuTTY, terminal).
Locate your private key file, decisionstats2.pem
Use chmod to make sure your key file isn’t publicly viewable, ssh won’t work otherwise: chmod 400 decisionstats.pem
Connect to your instance using instance’s public DNS [ec2-75-101-182-203.compute-1.amazonaws.com].
I may be willing to try Red Hat Enterprise Linux on the ec2 with 64 bit AND Revolution Enterprise to see the maximum juice I can get. or you can try it using an image below- It would be interesting if there could be an Amazon Machine Image for that (paid-public and private-academic)
5) For some reason on Ubuntu 64 bit Amazon image -I cant get Revolution R (even after using sudo apt) , and I am still learning how I can try and get Enterprise Edition fired up on a 64 bit Red Hat Enterprise Linux Amazon AMI (and maybe create an all new Machine Image 😉
Also it prevents me from loogin onto as root, and asks me to login as ubuntu@amazon…. I also wanted to try logging into using my Windows session but kept shuttling between my VM Player Ubuntu session and Windows
7) Hope this was useful. I am thankful to tips from Revolution Blog, R Grossman’s Blog, Creators of the Open Data AMI, Tal’s R Statistics Blog and Cerebral Mastication blog on this
Ashamed at my lack of parallel programming, I decided to learn some R Parallel Programming (after all parallel blogging is not really respect worthy in tech-geek-ninja circles).
So I did the usual Google- CRAN- search like a dog thing only to find some obstacles.
Obstacles-
Some Parallel Programming Packages like doMC are not available in Windows
what is a PVM or MPI? and SOCKS are for wearing or getting lost in washers till I encountered them in SNOW
Finally I did the following-and made the parallel programming work in Windows using R
require(doSNOW)
cl<-makeCluster(2) # I have two cores
registerDoSNOW(cl)
# create a function to run in each itteration of the loop

check <-function(n) {

+ for(i in 1:1000)

+ {

+ sme <- matrix(rnorm(100), 10,10)

+ solve(sme)

+ }

+ }
times <- 100     # times to run the loop
system.time(x <- foreach(j=1:times ) %dopar% check(j))
user  system elapsed
0.16    0.02   19.17
system.time(for(j in 1:times ) x <- check(j))
user  system elapsed</pre>
39.66    0.00   40.46

stopCluster(cl)
PALO ALTO, Calif., Sept. 20 — Revolution Analytics, the leading commercial provider of software and support for the popular open source R statistics language, today announced it will deliver Revolution R Enterprise for Microsoft Windows HPC Server 2008 R2, released today, enabling users to analyze very large data sets in high-performance computing environments.
R is a powerful open source statistics language and the modern system for predictive analytics. Revolution Analytics recently introduced RevoScaleR, new “Big Data” analysis capabilities, to its R distribution, Revolution R Enterprise. RevoScaleR solves the performance and capacity limitations of the R language by with parallelized algorithms that stream data across multiple cores on a laptop, workstation or server. Users can now process, visualize and model terabyte-class data sets at top speeds — without the need for specialized hardware.
“Revolution Analytics is pleased to support Microsoft’s Technical Computing initiative, whose efforts will benefit scientists, engineers and data analysts,” said David Champagne, CTO at Revolution. “We believe the engineering we have done for Revolution R Enterprise, in particular our work on big-data statistics and multicore computing, along with Microsoft’s HPC platform for technical computing, makes an ideal combination for high-performance large scale statistical computing.”
“Processing and analyzing this ‘big data’ is essential to better prediction and decision making,” said Bill Hamilton, director of technical computing at Microsoft Corp. “Revolution R Enterprise for Windows HPC Server 2008 R2 gives customers an extremely powerful tool that handles analysis of very large data and high workloads.”
REvolution R Enterprise is designed for both novice and experienced R users looking for a production-grade R distribution to perform mission critical predictive analytics tasks right from the desktop and scale across multiprocessor environments. Featuring RPE™ REvolution’s R Productivity Environment for Windows.
Of course R Enterprise is available on Linux but on Red Hat Enterprise Linux- it would be nice to see Amazom Machine Images as well as Ubuntu versions as well.
Like all virtual appliances, the main component of an AMI is a read-only filesystem image which includes an operating system (e.g., Linux, UNIX, or Windows) and any additional software required to deliver a service or a portion of it.[2]
The AMI filesystem is compressed, encrypted, signed, split into a series of 10MB chunks and uploaded into Amazon S3 for storage. An XML manifest file stores information about the AMI, including name, version, architecture, default kernel id, decryption key and digests for all of the filesystem chunks.
An AMI does not include a kernel image, only a pointer to the default kernel id, which can be chosen from an approved list of safe kernels maintained by Amazon and its partners (e.g., RedHat, Canonical, Microsoft). Users may choose kernels other than the default when booting an AMI.[3]
Paid: a for-pay AMI image that is registered with Amazon DevPay and can be used by any one who subscribes for it. DevPay allows developers to mark-up Amazon’s usage fees and optionally add monthly subscription fees.
Parallel Computing Toolbox™ lets you solve computationally and data-intensive problems using multicore processors, GPUs, and computer clusters. High-level constructs—parallel for-loops, special array types, and parallelized numerical algorithms—let you parallelize MATLAB® applications without CUDA or MPI programming. You can use the toolbox with Simulink® to run multiple simulations of a model in parallel.
The toolbox provides eight workers (MATLAB computational engines) to execute applications locally on a multicore desktop. Without changing the code, you can run the same application on a computer cluster or a grid computing service (using MATLAB Distributed Computing Server™). You can run parallel applications interactively or in batch.
The gputools package by Buckner provides several common data-mining algorithms which are implemented using a mixture of nVidia‘s CUDA langauge and cublas library. Given a computer with an nVidia GPU these functions may be substantially more efficient than native R routines. The rpud package provides an optimised distance metric for NVidia-based GPUs.
The cudaBayesreg package by da Silva implements the rhierLinearModel from the bayesm package using nVidia’s CUDA langauge and tools to provide high-performance statistical analysis of fMRI voxels.
The rgpu package (see below for link) aims to speed up bioinformatics analysis by using the GPU.
The magma package provides an interface to the hybrid GPU/CPU library Magma (see below for link).
The gcbd package implements a benchmarking framework for BLAS and GPUs (using gputools).
I tried to search for SAS and GPU and SPSS and GPU but got nothing. Maybe they would do well to atleast test these alternative hardwares-
Also see Matlab on GPU comparison for the product Jacket vs Parallel Computing Toolbox


 - Rotating ...")


