Non Oracle Open Office completes important milestone- from the press release
The Document Foundation launches LibreOffice 3.3
The first stable release of the free office suite is available for download
The Internet, January 25, 2011 – The Document Foundation launches LibreOffice 3.3, the first stable release of the free office suite developed by the community. In less than four months, the number of developers hacking LibreOffice has grown from less than twenty in late September 2010, to well over one hundred today. This has allowed us to release ahead of the aggressive schedule set by the project.
Not only does it ship a number of new and original features, LibreOffice 3.3 is also a significant achievement for a number of reasons:
– the developer community has been able to build their own and independent process, and get up and running in a very short time (with respect to the size of the code base and the project’s strong ambitions);
– thanks to the high number of new contributors having been attracted into the project, the source code is quickly undergoing a major clean-up to provide a better foundation for future development of LibreOffice;
– the Windows installer, which is going to impact the largest and most diverse user base, has been integrated into a single build containing all language versions, thus reducing the size for download sites from 75 to 11GB, making it easier for us to deploy new versions more rapidly and lowering the carbon footprint of the entire infrastructure.
Caolán McNamara from RedHat, one of the developer community leaders, comments, “We are excited: this is our very first stable release, and therefore we are eager to get user feedback, which will be integrated as soon as possible into the code, with the first enhancements being released in February. Starting from March, we will be moving to a real time-based, predictable, transparent and public release schedule, in accordance with Engineering Steering Committee’s goals and users’ requests”. The LibreOffice development roadmap is available at http://wiki.documentfoundation.org/ReleasePlan
LibreOffice 3.3 brings several unique new features. The 10 most-popular among community members are, in no particular order:
the ability to import and work with SVG files;
an easy way to format title pages and their numbering in Writer;
a more-helpful Navigator Tool for Writer;
improved ergonomics in Calc for sheet and cell management;
and Microsoft Works and Lotus Word Pro document import filters.
In addition, many great extensions are now bundled, providing
LibreOffice 3.3 also provides all the new features of OpenOffice.org 3.3, such as new custom properties handling; embedding of standard PDF fonts in PDF documents; new Liberation Narrow font; increased document protection in Writer and Calc; auto decimal digits for “General” format in Calc; 1 million rows in a spreadsheet; new options for CSV import in Calc; insert drawing objects in Charts; hierarchical axis labels for Charts; improved slide layout handling in Impress; a new easier-to-use print interface; more options for changing case; and colored sheet tabs in Calc. Several of these new features were contributed by members of the LibreOffice team prior to the formation of The Document Foundation.
LibreOffice hackers will be meeting at FOSDEM in Brussels on February 5 and 6, and will be presenting their work during a one-day workshop on February 6, with speeches and hacking sessions coordinated by several members of the project.
The home of LibreOffice is at http://www.libreoffice.org where the download page has been redesigned by the community to be more user-friendly.
*** About The Document Foundation
The Document Foundation has the mission of facilitating the evolution of the OOo Community into a new, open, independent, and meritocratic organization within the next few months. An independent Foundation is a better reflection of the values of our contributors, users and supporters, and will enable a more effective, efficient and transparent community. TDF will protect past investments by building on the achievements of the first decade, will encourage wide participation within the community, and will co-ordinate activity across the community.
WRITER is the word processor inside LibreOffice. Use it for everything, from dashing off a quick letter to producing an entire book with tables of contents, embedded illustrations, bibliographies and diagrams. The while-you-type auto-completion, auto-formatting and automatic spelling checking make difficult tasks easy (but are easy to disable if you prefer). Writer is powerful enough to tackle desktop publishing tasks such as creating multi-column newsletters and brochures. The only limit is your imagination.
CALC tames your numbers and helps with difficult decisions when you’re weighing the alternatives. Analyze your data with Calc and then use it to present your final output. Charts and analysis tools help bring transparency to your conclusions. A fully-integrated help system makes easier work of entering complex formulas. Add data from external databases such as SQL or Oracle, then sort and filter them to produce statistical analyses. Use the graphing functions to display large number of 2D and 3D graphics from 13 categories, including line, area, bar, pie, X-Y, and net – with the dozens of variations available, you’re sure to find one that suits your project.
IMPRESS is the fastest and easiest way to create effective multimedia presentations. Stunning animation and sensational special effects help you convince your audience. Create presentations that look even more professional than the standard presentations you commonly see at work. Get your collegues’ and bosses’ attention by creating something a little bit different.
DRAW lets you build diagrams and sketches from scratch. A picture is worth a thousand words, so why not try something simple with box and line diagrams? Or else go further and easily build dynamic 3D illustrations and special effects. It’s as simple or as powerful as you want it to be.
BASE is the database front-end of the LibreOffice suite. With Base, you can seamlessly integrate into your existing database structures. Based on imported and linked tables and queries from MySQL, PostgreSQL or Microsoft Access and many other data sources, you can build powerful databases containing forms, reports, views and queries. Full integration is possible with the in-built HSQL database.
MATH is a simple equation editor that lets you lay-out and display your mathematical, chemical, electrical or scientific equations quickly in standard written notation. Even the most-complex calculations can be understandable when displayed correctly. E=mc2
Open Documentation just announced release candidate 3 of Libre office.
Better performance and interoperability on Excel doc import;
Better performance on DBF import;
Slightly better performance on ODS import;
Possibility to use English formula names;
Distributed alignment – allows one to specify ‘distributed’ horizontal alignment and ‘justified’ and ‘distributed’ vertical alignments within cells. This is notably useful for CJK locales;
Support for 3 different formula syntaxes: Calc A1, Excel A1 and Excel R1C1;
Configurable argument and array separators in formula expressions;
External reference works within OFFSET function;
Hitting TAB during auto-complete commits current selection and moves to the next cell;
Shift-TAB cycles through auto-complete selections;
Find and replace skips those cells that are filtered out (thus hidden);
Protecting sheet provides two additional sheet protection options, to optionally limit cursor placement in protected and unprotected areas;
Copying a range highlights the range being copied. It also allows you to paste it by hitting ENTER key. Hitting ESC removes the range highlight;
Jumping to and from references in formula cells via “Ctrl-[” and “Ctrl-]”;
Cell cursor stays at the original cell during range selection.
Writer
AutoCorrections match case of the words that AutoCorrect replaces. (Issuezilla 2838);
The only issue is Rattle can be quite difficult to install due to dependencies on GTK+
After fiddling for a couple of years- this is what I did
1) Created dual boot OS- Basically downloaded the netbook remix from http://ubuntu.com I created a dual boot OS so you can choose at the beginning whether to use Windows or Ubuntu Linux in that session. Alternatively you can download VM Player www.vmware.com/products/player/ if you want to do both
2) Download R packages using Ubuntu packages and Install GTK+ dependencies before that.
GTK + Requires
Libglade
Glib
Cairo
Pango
ATK
If you are a Linux newbie like me who doesnt get the sudo apt get, tar, cd, make , install rigmarole – scoot over to synaptic software packages or just the main ubuntu software centre and download these packages one by one.
For R Dependencies, you need
PMML
XML
RGTK2
Again use r-cran as the prefix to these package names and simply install (almost the same way Windows does it easily -double click)
Save theses to your hard disk (e.g., to your Desktop) but don’t extract them. Then, on GNU/Linux run the install command shown below. This command is entered into a terminal window:
R CMD INSTALL rattle_2.6.0.tar.gz
After installation-
5) Type library(rattle) and rattle.info to get messages on what R packages to update for a proper functioning
</code>

> library(rattle)
Rattle: Graphical interface for data mining using R.
Version 2.6.0 Copyright (c) 2006-2010 Togaware Pty Ltd.
Type 'rattle()' to shake, rattle, and roll your data.
> rattle.info()
Rattle: version 2.6.0
R: version 2.11.1 (2010-05-31) (Revision 52157)

Sysname: Linux
Release: 2.6.35-23-generic
Version: #41-Ubuntu SMP Wed Nov 24 10:18:49 UTC 2010
Nodename: k1-M725R
Machine: i686
Login: k1ng
User: k1ng

Installed Dependencies
RGtk2: version 2.20.3
pmml: version 1.2.26
colorspace: version 1.0-1
cairoDevice: version 2.14
doBy: version 4.1.2
e1071: version 1.5-24
ellipse: version 0.3-5
foreign: version 0.8-41
gdata: version 2.8.1
gtools: version 2.6.2
gplots: version 2.8.0
gWidgetsRGtk2: version 0.0-69
Hmisc: version 3.8-3
kernlab: version 0.9-12
latticist: version 0.9-43
Matrix: version 0.999375-46
mice: version 2.4
network: version 1.5-1
nnet: version 7.3-1
party: version 0.9-99991
playwith: version 0.9-53
randomForest: version 4.5-36 upgrade available 4.6-2
rggobi: version 2.1.16
survival: version 2.36-2
XML: version 3.2-0
bitops: version 1.0-4.1

Upgrade the packages with:

 > install.packages(c("randomForest"))

<code>
Now upgrade whatever package rattle.info tells to upgrade.
This is much simpler and less frustrating than some of the other ways to install Rattle.
If all goes well, you will see this familiar screen popup when you type
Additional features in R over other analytical packages-
1) Source Code is given to ensure complete custom solution and embedding for a particular application. Open source code has an advantage that is extensively peer- reviewed in Journals and Scientific Literature. This means bugs will found, shared and corrected transparently.
2) Wide literature of training material in the form of books is available for the R analytical platform.
3) Extensively the best data visualization tools in analytical software (apart from Tableau Software ‘s latest version). The extensive data visualization available in R is of the form a variety of customizable graphs, as well as animation. The principal reason third-party software initially started creating interfaces to R is because the graphical library of packages in R is more advanced as well as rapidly getting more features by the day.
4) Free in upfront license cost for academics and thus budget friendly for small and large analytical teams.
5) Flexible programming for your data environment. This includes having packages that ensure compatibility with Java, Python and C++.
6) Easy migration from other analytical platforms to R Platform. It is relatively easy for a non R platform user to migrate to R platform and there is no danger of vendor lock-in due to the GPL nature of source code and open community.
Statistics are numbers that tell (descriptive), advise ( prescriptive) or forecast (predictive). Analytics is a decision-making help tool. Analytics on which no decision is to be made or is being considered can be classified as purely statistical and non analytical. Thus ease of making a correct decision separates a good analytical platform from a not so good analytical platform. The distinction is likely to be disputed by people of either background- and business analysis requires more emphasis on how practical or actionable the results are and less emphasis on the statistical metrics in a particular data analysis task. I believe one clear reason between business analytics is different from statistical analysis is the cost of perfect information (data costs in real world) and the opportunity cost of delayed and distorted decision-making.
Specific to the following domains R has the following costs and benefits
Business Analytics
R is free per license and for download
It is one of the few analytical platforms that work on Mac OS
It’s results are credibly established in both journals like Journal of Statistical Software and in the work at LinkedIn, Google and Facebook’s analytical teams.
It has open source code for customization as per GPL
It also has a flexible option for commercial vendors like Revolution Analytics (who support 64 bit windows) as well as bigger datasets
It has interfaces from almost all other analytical software including SAS,SPSS, JMP, Oracle Data Mining, Rapid Miner. Existing license holders can thus invoke and use R from within these software
Huge library of packages for regression, time series, finance and modeling
High quality data visualization packages
Data Mining
R as a computing platform is better suited to the needs of data mining as it has a vast array of packages covering standard regression, decision trees, association rules, cluster analysis, machine learning, neural networks as well as exotic specialized algorithms like those based on chaos models.
Flexibility in tweaking a standard algorithm by seeing the source code
The RATTLE GUI remains the standard GUI for Data Miners using R. It was created and developed in Australia.
Business Dashboards and Reporting
Business Dashboards and Reporting are an essential piece of Business Intelligence and Decision making systems in organizations. R offers data visualization through GGPLOT, and GUI like Deducer and Red-R can help even non R users create a metrics dashboard
For online Dashboards- R has packages like RWeb, RServe and R Apache- which in combination with data visualization packages offer powerful dashboard capabilities.
R can be combined with MS Excel using the R Excel package – to enable R capabilities to be imported within Excel. Thus a MS Excel user with no knowledge of R can use the GUI within the R Excel plug-in to use powerful graphical and statistical capabilities.
Additional factors to consider in your R installation-
There are some more choices awaiting you now-
1) Licensing Choices-Academic Version or Free Version or Enterprise Version of R
2) Operating System Choices-Which Operating System to choose from? Unix, Windows or Mac OS.
3) Operating system sub choice- 32- bit or 64 bit.
4) Hardware choices-Cost -benefit trade-offs for additional hardware for R. Choices between local ,cluster and cloud computing.
5) Interface choices-Command Line versus GUI? Which GUI to choose as the default start-up option?
6) Software component choice- Which packages to install? There are almost 3000 packages, some of them are complimentary, some are dependent on each other, and almost all are free.
7) Additional Software choices- Which additional software do you need to achieve maximum accuracy, robustness and speed of computing- and how to use existing legacy software and hardware for best complementary results with R.
1) Licensing Choices-
You can choose between two kinds of R installations – one is free and open source from http://r-project.org The other R installation is commercial and is offered by many vendors including Revolution Analytics. However there are other commercial vendors too.
Windows remains the most widely used operating system on this planet. If you are experienced in Windows based computing and are active on analytical projects- it would not make sense for you to move to other operating systems. This is also based on the fact that compatibility problems are minimum for Microsoft Windows and the help is extensively documented. However there may be some R packages that would not function well under Windows- if that happens a multiple operating system is your next option.
Enterprise R from Revolution Analytics- Enterprise R from Revolution Analytics has a complete R Development environment for Windows including the use of code snippets to make programming faster. Revolution is also expected to make a GUI available by 2011. Revolution Analytics claims several enhancements for it’s version of R including the use of optimized libraries for faster performance.
MacOS
Reasons for choosing MacOS remains its considerable appeal in aesthetically designed software- but MacOS is not a standard Operating system for enterprise systems as well as statistical computing. However open source R claims to be quite optimized and it can be used for existing Mac users. However there seem to be no commercially available versions of R available as of now for this operating system.
Linux
Ubuntu
Red Hat Enterprise Linux
Other versions of Linux
Linux is considered a preferred operating system by R users due to it having the same open source credentials-much better fit for all R packages and it’s customizability for big data analytics.
Ubuntu Linux is recommended for people making the transition to Linux for the first time. Ubuntu Linux had an marketing agreement with revolution Analytics for an earlier version of Ubuntu- and many R packages can installed in a straightforward way as Ubuntu/Debian packages are available. Red Hat Enterprise Linux is officially supported by Revolution Analytics for it’s enterprise module. Other versions of Linux popular are Open SUSE.
Multiple operating systems-
Virtualization vs Dual Boot-
You can also choose between having a VMware VM Player for a virtual partition on your computers that is dedicated to R based computing or having operating system choice at the startup or booting of your computer. A software program called wubi helps with the dual installation of Linux and Windows.
64 bit vs 32 bit – Given a choice between 32 bit versus 64 bit versions of the same operating system like Linux Ubuntu, the 64 bit version would speed up processing by an approximate factor of 2. However you need to check whether your current hardware can support 64 bit operating systems and if so- you may want to ask your Information Technology manager to upgrade atleast some operating systems in your analytics work environment to 64 bit operating systems.
Hardware choices- At the time of writing this book, the dominant computing paradigm is workstation computing followed by server-client computing. However with the introduction of cloud computing, netbooks, tablet PCs, hardware choices are much more flexible in 2011 than just a couple of years back.
Hardware costs are a significant cost to an analytics environment and are also remarkably depreciated over a short period of time. You may thus examine your legacy hardware, and your future analytical computing needs- and accordingly decide between the various hardware options available for R.
Unlike other analytical software which can charge by number of processors, or server pricing being higher than workstation pricing and grid computing pricing extremely high if available- R is well suited for all kinds of hardware environment with flexible costs. Given the fact that R is memory intensive (it limits the size of data analyzed to the RAM size of the machine unless special formats and /or chunking is used)- it depends on size of datasets used and number of concurrent users analyzing the dataset. Thus the defining issue is not R but size of the data being analyzed.
Local Computing- This is meant to denote when the software is installed locally. For big data the data to be analyzed would be stored in the form of databases.
Server version- Revolution Analytics has differential pricing for server -client versions but for the open source version it is free and the same for Server or Workstation versions.
Workstation
Cloud Computing- Cloud computing is defined as the delivery of data, processing, systems via remote computers. It is similar to server-client computing but the remote server (also called cloud) has flexible computing in terms of number of processors, memory, and data storage. Cloud computing in the form of public cloud enables people to do analytical tasks on massive datasets without investing in permanent hardware or software as most public clouds are priced on pay per usage. The biggest cloud computing provider is Amazon and many other vendors provide services on top of it. Google is also coming for data storage in the form of clouds (Google Storage), as well as using machine learning in the form of API (Google Prediction API)
Amazon
Google
Cluster-Grid Computing/Parallel processing- In order to build a cluster, you would need the RMpi and the SNOW packages, among other packages that help with parallel processing.
How much resources
RAM-Hard Disk-Processors- for workstation computing
Instances or API calls for cloud computing
Interface Choices
Command Line
GUI
Web Interfaces
Software Component Choices
R dependencies
Packages to install
Recommended Packages
Additional software choices
Additional legacy software
Optimizing your R based computing
Code Editors
Code Analyzers
Libraries to speed up R
citation- R Development Core Team (2010). R: A language and environment for statistical computing. R Foundation for Statistical Computing,Vienna, Austria. ISBN 3-900051-07-0, URL http://www.R-project.org.
Ubuntu has a slight glitch plus workaround for installing the RCurl package on which the Google Prediction API is dependent- you need to first install this Ubuntu package for RCurl to install libcurl4-gnutls-dev
Once you install that using Synaptic,
Simply start R
2) Install Packages rjson and Rcurl using install.packages and choosing CRAN
6) Uploading data to Google Storage using the GUI (rather than gs util)
Just go to https://sandbox.google.com/storage/
and thats the Google Storage manager
Notes on Training Data-
Use a csv file
The first column is the score column (like 1,0 or prediction score)
There are no headers- so delete headers from data file and move the dependent variable to the first column (Note I used data from the kaggle contest for R package recommendation at
Once you type in the basic syntax, the first time it will ask for your Google Credentials (email and password)
It then starts showing you time elapsed for training.
Now you can disconnect and go off (actually I got disconnected by accident before coming back in a say 5 minutes so this is the part where I think this is what happened is why it happened, dont blame me, test it for yourself) –
and when you come back (hopefully before token expires) you can see status of your request (see below)
> library(rjson)
> library(RCurl)
Loading required package: bitops
> library(googlepredictionapi)
> my.model <- PredictionApiTrain(data="gs://numtraindata/training_data")
The request for training has sent, now trying to check if training is completed
Training on numtraindata/training_data: time:2.09 seconds
Training on numtraindata/training_data: time:7.00 seconds
7)
Note I changed the format from the URL where my data is located- simply go to your Google Storage Manager and right click on the file name for link address ( https://sandbox.google.com/storage/numtraindata/training_data.csv)
to gs://numtraindata/training_data (that kind of helps in any syntax error)
## Load googlepredictionapi and dependent libraries
library(rjson)
library(RCurl)
library(googlepredictionapi)

## Make a training call to the Prediction API against data in the Google Storage.
## Replace MYBUCKET and MYDATA with your data.
my.model <- PredictionApiTrain(data="gs://MYBUCKET/MYDATA")

## Alternatively, make a training call against training data stored locally as a CSV file.
## Replace MYPATH and MYFILE with your data.
my.model <- PredictionApiTrain(data="MYPATH/MYFILE.csv")
At the time of writing my data was still getting trained, so I will keep you posted on what happens.
Using WP- Stats I set about answering this question-
What search keywords lead here-
Clearly Michael Jackson is down this year
And R GUI, Data Mining is up.
How does that affect my writing- given I get almost 250 visitors by search engines alone daily- assume I write nothing on this blog from now on.
It doesnt- I still write what ever code or poem that comes to my mind. So it is hurtful people misunderstimate the effort in writing and jump to conclusions (esp if I write about a company- I am not on payroll of that company- just like if I write about a poem- I am not a full time poet)
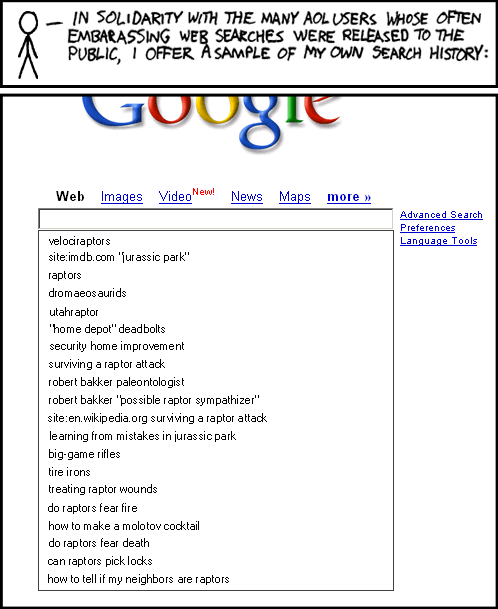
Over to xkcd
All Time (for Decisionstats.Wordpress.com)
Search
Views
libre office
818
facebook analytics
806
michael jackson history
240
wps sas lawsuit
180
r gui
168
wps sas
154
wordle.net
118
sas wps
116
decision stats
110
sas wps lawsuit
100
google maps jet ski
94
data mining
88
doug savage
72
hive tutorial
63
spss certification
63
hadley wickham
63
google maps jetski
62
sas sues wps
60
decisionstats
58
donald farmer microsoft
45
libreoffice
44
wps statistics
44
best statistics software
42
r gui ubuntu
41
rstat
37
tamilnadu advanced technical training institute tatti
Classical Economics talks of the value of utlity, diminishing marginal utility if the same things is repeated again and again (like spam in an online community)
StackOverflow has a great way of measuring reputation – and thus allows intangible benefits /awards -similar to wikipedia badges , reddit karma. Utility is also auto generated like @klout on twitter or lists memberships and other sucessful open source communities online including Ubuntu forums have ways to create ah hierarchies even in class less utopian classes.
Basically it then acts as the motivating game as the mostly boy population try to race on numbers.
in Stack Overflow- you can get buddies to upvote you and basically act as a role playing game too.
To gain reputation, post good questions and useful answers. Your peers will vote on your posts, and those votes will cause you to gain (or, in rare cases, lose) reputation:
answer is voted up
+10
question is voted up
+5
answer is accepted
+15
(+2 to acceptor)
post is voted down
-2
(-1 to voter)
A maximum of 30 votes can be cast per user per day, and you can earn a maximum of 200 reputation per day (although accepted answers and bounty awards are immune to this limit). Also, please note that votes for any posts marked “community wiki” do not generate reputation.
Amass enough reputation points and Stack Overflow will allow you to go beyond simply asking and answering questions: