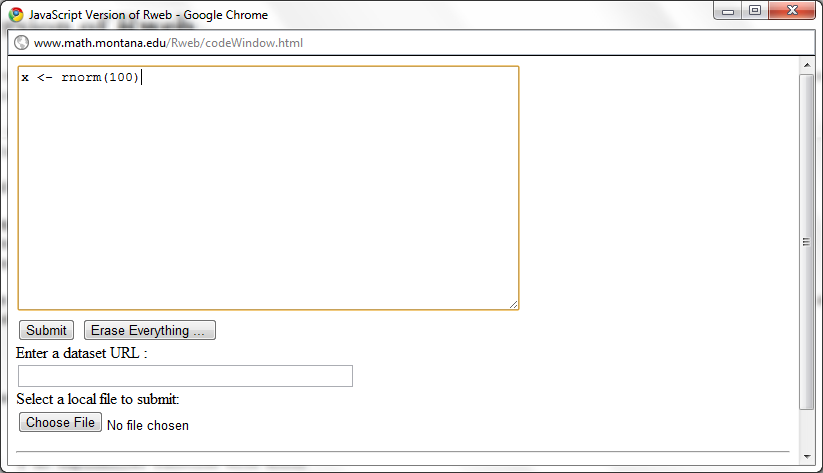
The web browser UI works in all modern browsers, including IE 7 and 8 (excluding SVG based graphs).
Username/password login (both from the browser to the R-Node server, and from the R-Node server to Rserve and R).
Per-user R sessions. Each user can have their own R workspace, or they can share.
Support for most R commands that perform statistical analysis and provide textual feedback.
Support for most standard R commands that provide graphical feedback via server side generation of the graphs. Some graphs (e.g. plot() can be plotted via SVG client-side as well).
Downloading of generated graphs.
Accessing R help files using help() and ? commands (Note R v2.10 altered how help is provided, so this currently is not working in R v2.10)
Uploading files to work with their data in R.
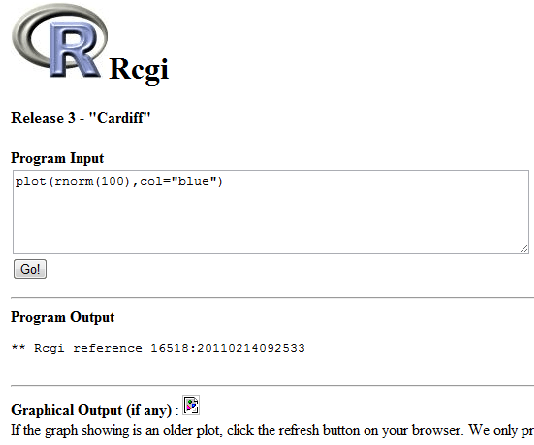
Many commands will work. Try a command, if it does not work, use the feedback button in the application to let us know.
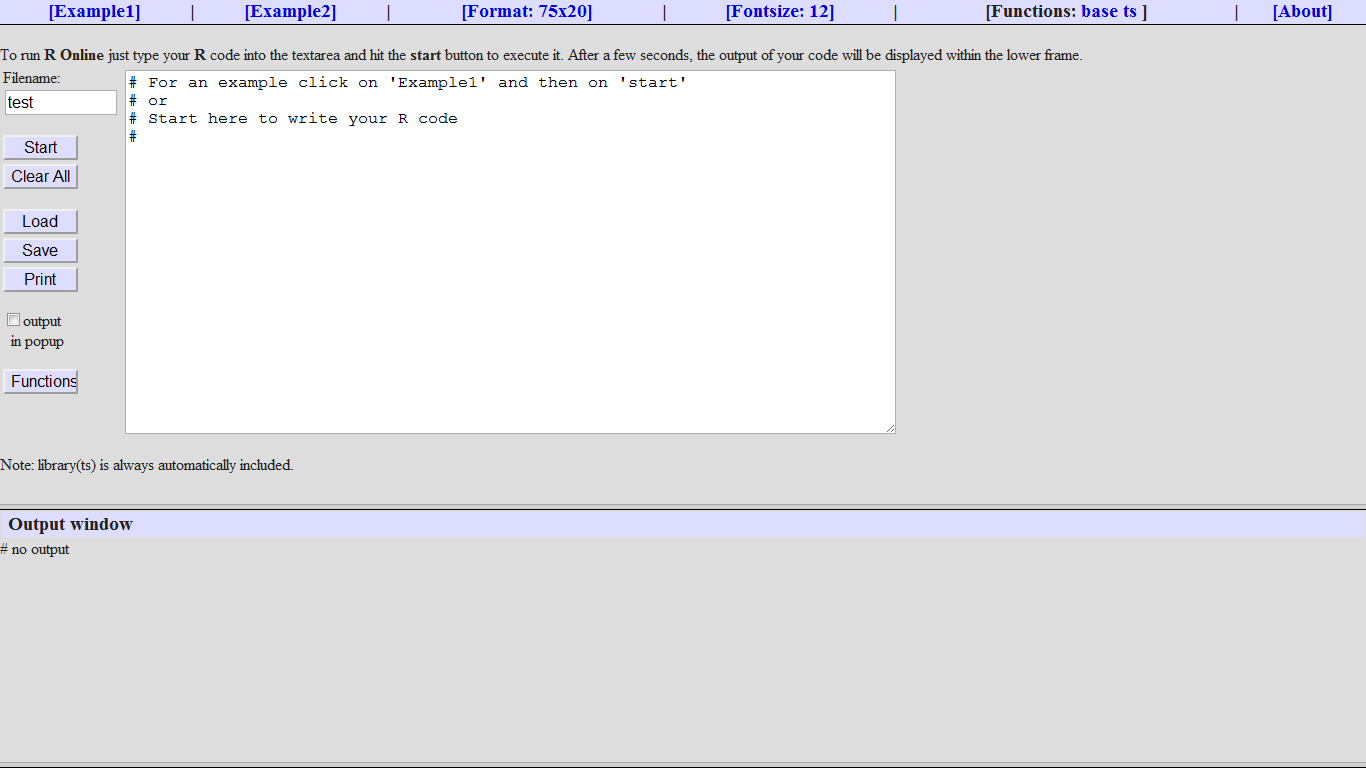
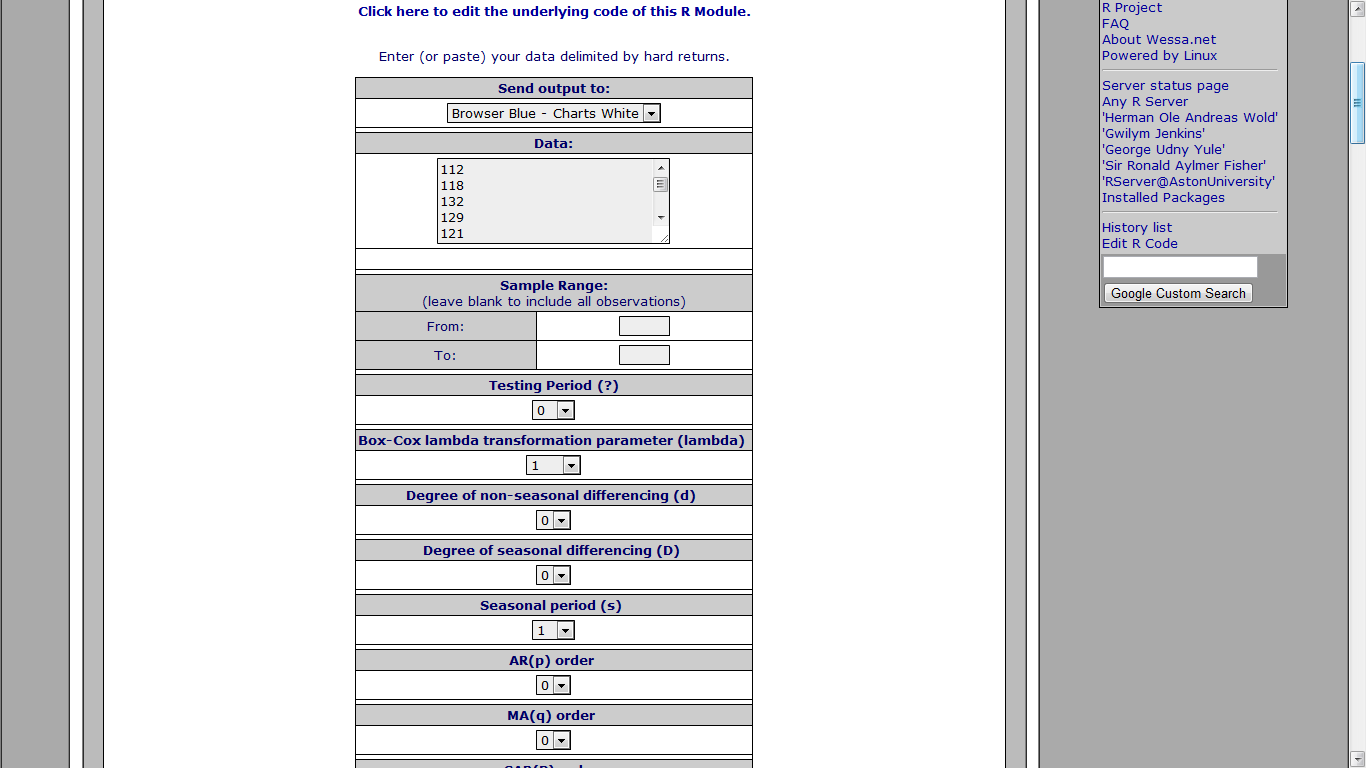
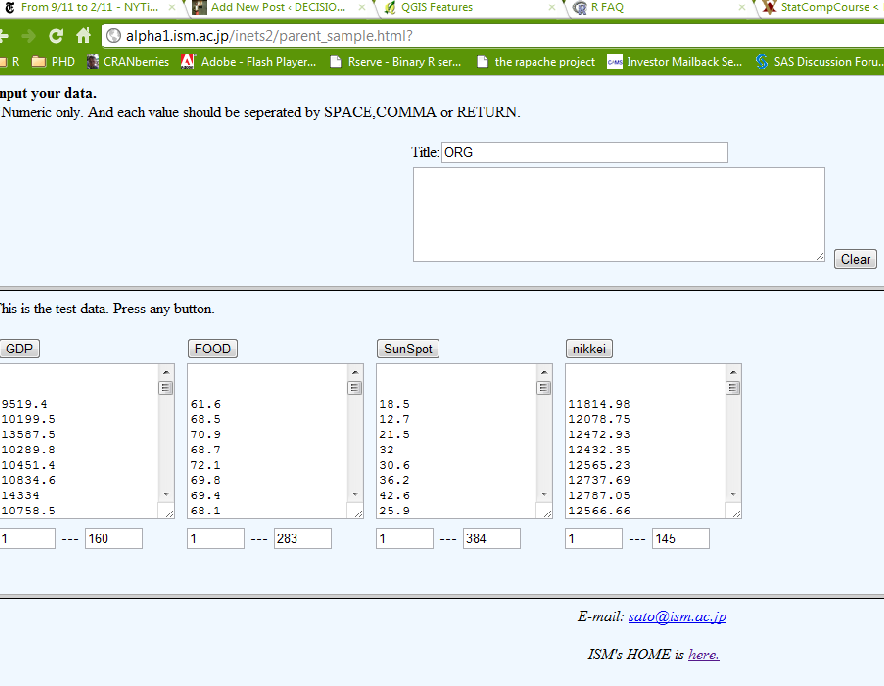
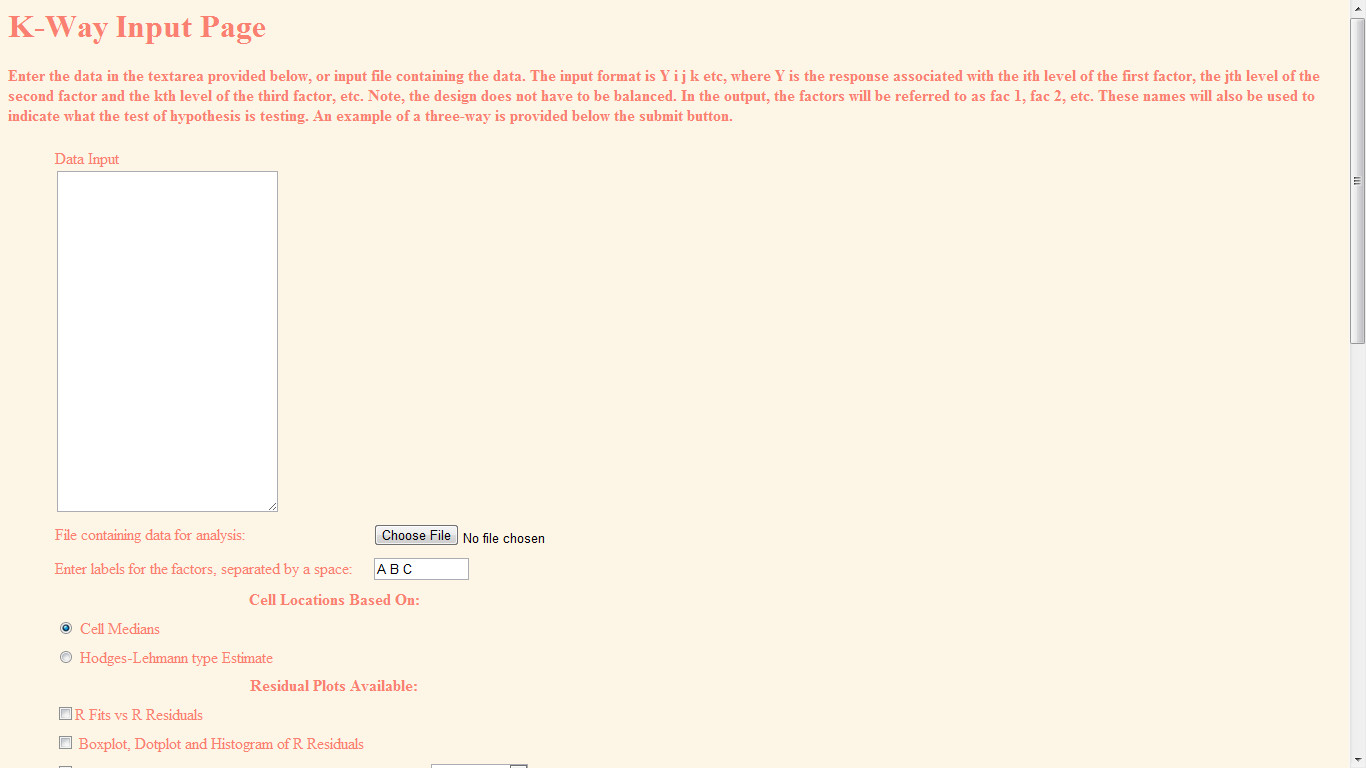
An impressive implementation of time series analysis based on R and Javascript. This web server creates separate browser windows for data entry, graphics, and procedure selection. These windows are dynamic. For example, after entering data there is no submit button to submit the data. The procedure selection window is used to start the analysis, which uses the current values in the data window.
The Document Foundation is happy to announce the release candidate of
LibreOffice 3.3.1. This release candidate is the first in a series of
frequent bugfix releases on top of our LibreOffice 3.3 product. Please
be aware that LibreOffice 3.3.1 RC1 is not yet ready for production
use, you should continue to use LibreOffice for that.
Writer is the word processor inside LibreOffice. Use it for everything, from dashing off a quick letter to producing an entire book with tables of contents, embedded illustrations, bibliographies and diagrams. The while-you-type auto-completion, auto-formatting and automatic spelling checking make difficult tasks easy (but are easy to disable if you prefer). Writer is powerful enough to tackle desktop publishing tasks such as creating multi-column newsletters and brochures. The only limit is your imagination.
Calc tames your numbers and helps with difficult decisions when you’re weighing the alternatives. Analyze your data with Calc and then use it to present your final output. Charts and analysis tools help bring transparency to your conclusions. A fully-integrated help system makes easier work of entering complex formulas. Add data from external databases such as SQL or Oracle, then sort and filter them to produce statistical analyses. Use the graphing functions to display large number of 2D and 3D graphics from 13 categories, including line, area, bar, pie, X-Y, and net – with the dozens of variations available, you’re sure to find one that suits your project.
Impress is the fastest and easiest way to create effective multimedia presentations. Stunning animation and sensational special effects help you convince your audience. Create presentations that look even more professional than the standard presentations you commonly see at work. Get your collegues’ and bosses’ attention by creating something a little bit different.
Draw lets you build diagrams and sketches from scratch. A picture is worth a thousand words, so why not try something simple with box and line diagrams? Or else go further and easily build dynamic 3D illustrations and special effects. It’s as simple or as powerful as you want it to be.
Base is the database front-end of the LibreOffice suite. With Base, you can seamlessly integrate your existing database structures into the other components of LibreOffice, or create an interface to use and administer your data as a stand-alone application. You can use imported and linked tables and queries from MySQL, PostgreSQL or Microsoft Access and many other data sources, or design your own with Base, to build powerful front-ends with sophisticated forms, reports and views. Support is built-in or easily addable for a very wide range of database products, notably the standardly-provided HSQL, MySQL, Adabas D, Microsoft Access and PostgreSQL.
Math is a simple equation editor that lets you lay-out and display your mathematical, chemical, electrical or scientific equations quickly in standard written notation. Even the most-complex calculations can be understandable when displayed correctly. E=mc2.
LibreOffice also comes configured with a PDF file creator, meaning you can distribute documents that you’re sure can be opened and read by users of almost any computing device or operating system.
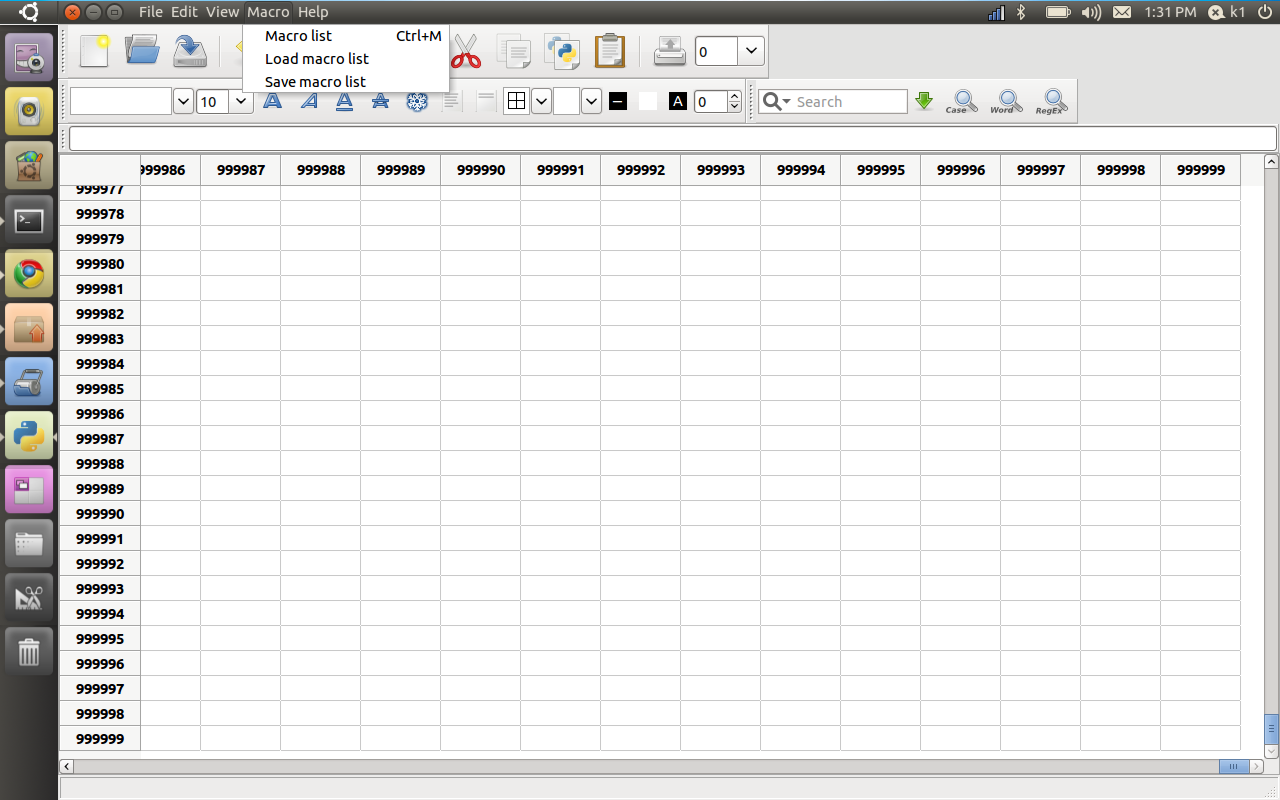
Just working with PySpread- and worked on a 1 million by 1 million spreadsheet- Python sure looks promising for the way ahead for stat computing ( you need to
Pyspread is a cross-platform Python spreadsheet application. It is based on and written in the programming language Python.
Instead of spreadsheet formulas, Python expressions are entered into the spreadsheet cells. Each expression returns a Python object that can be accessed from other cells. These objects can represent anything including lists or matrices.
features
Three dimensional grid with up to 85,899,345 rows and 14,316,555 columns (64 bit systems, depends on row height and column width). Note that a million cells require about 500 MB of memory.
Complex data types such as lists, trees or matrices within a single cell.
Macros for functionalities that are too complex for a single Python expression.
Python module access from each cell, which allows:
Fixed point decimal numbers for business calculations, (via the decimal module from the standard library)
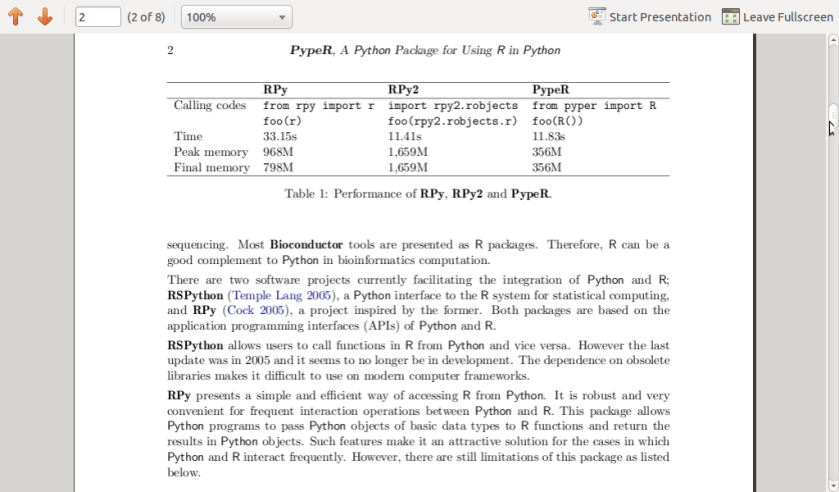
Advanced statistics including plotting functions (via RPy)
Much more via <your favourite module>.
CSV import and export
Clipboard access
warning
The concept of pyspread allows doing everything from each cell that a Python script can do. This powerful feature has its drawbacks. A spreadsheet may very well delete your hard drive or send your data via the Internet. Of course this is a non-issue if you sandbox properly or if you only use self developed spreadsheets.
Since this is not the case for everyone (see discussion at lwn.net), a GPG signature based trust model for spreadsheet files has been introduced. It ensures that only your own trusted files are executed on loading. Untrusted files are displayed in safe mode. You can approve a file manually. Inspect carefully.
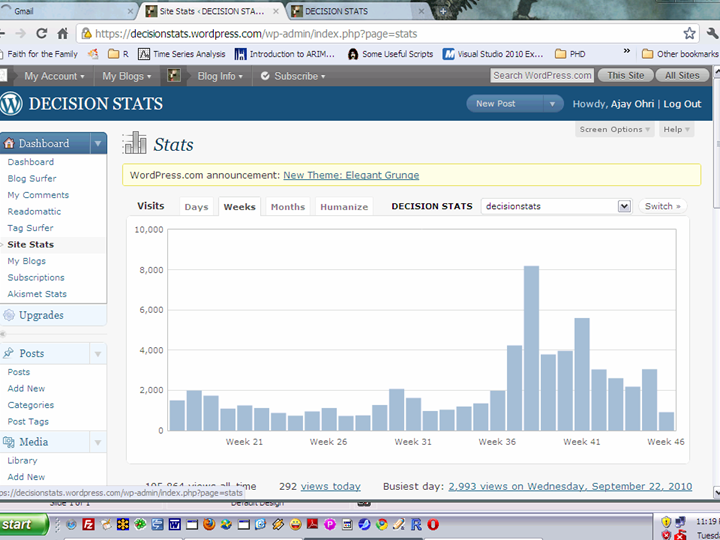
My annual traffic to this blog was almost 99,000 . Add in additional views on networking sites plus the 400 plus RSS readers- so I can say traffic was 1,20,000 for 2010. Nice. Thanks for reading and hope it was worth your time. (this is a long post and will take almost 440 secs to read but the summary is just given)
My intent is either to inform you, give something useful or atleast something interesting.
see below-
Jan
Feb
Mar
Apr
May
Jun
2010
6,311
4,701
4,922
5,463
6,493
4,271
Jul
Aug
Sep
Oct
Nov
Dec
Total
5,041
5,403
17,913
16,430
11,723
10,096
98,767
Sandro Saita from http://www.dataminingblog.com/ just named me for an award on his blog (but my surname is ohRi , Sandro left me without an R- What would I be without R :)) ).
Aw! I am touched. Google for “Data Mining Blog” and Sandro is the best that it is in data mining writing.
”
DMR People Award 2010
There are a lot of active people in the field of data mining. You can discuss with them on forums. You can read their blogs. You can also meet them in events such as PAW or KDD. Among the people I follow on a regular basis, I have elected:
Ajay Ori
He has been very active in 2010, especially on his blog . Good work Ajay and continue sharing your experience with us!”
What did I write in 2010- stuff.
What did you read on this blog- well thats the top posts list.
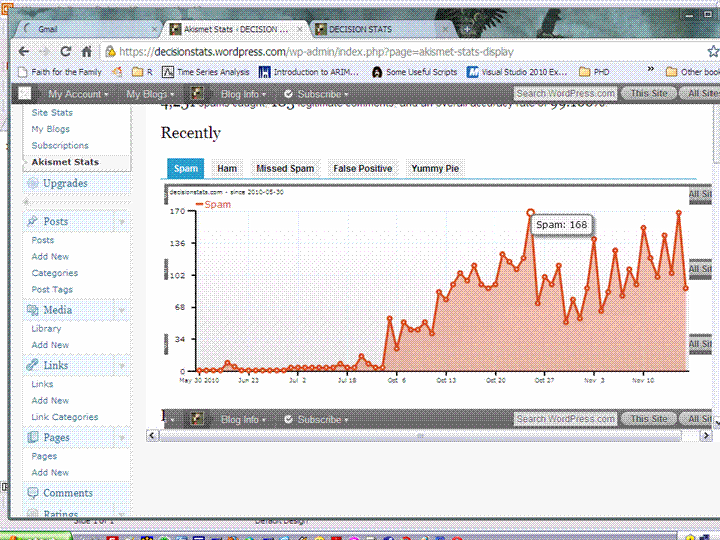
well I guess I owe Tal G for almost 9000 views ( incidentally I withdrew posting my blog from R- Bloggers and Analyticbridge blogs – due to SEO keyword reasons and some spam I was getting see (below))
Still reading this post- gosh let me sell you some advertising. It is only $100 a month (yes its a recession)
Advertisers are treated on First in -Last out (FILO)
I have been told I am obsessed with SEO , but I dont care much for search engines apart from Google, and yes SEO is an interesting science (they should really re name it GEO or Google Engine Optimization)
Apparently Hadley Wickham and Donald Farmer are big keywords for me so I should be more respectful I guess.
Search Terms for 365 days ending 2010-12-31 (Summarized)
2009-12-31 to Today
Search
Views
libre office
925
facebook analytics
798
test drive a chrome notebook
467
test drive a chrome notebook.
215
r gui
203
data mining
163
wps sas lawsuit
158
wordle.net
133
wps sas
123
google maps jet ski
123
test drive chrome notebook
96
sas wps
89
sas wps lawsuit
85
chrome notebook test drive
83
decision stats
83
best statistics software
74
hadley wickham
72
google maps jetski
72
libreoffice
70
doug savage
65
hive tutorial
58
funny india
56
spss certification
52
donald farmer microsoft
51
best statistical software
49
What about outgoing links? Apparently I need to find a way to ask Google to pay me for the free advertising I gave their chrome notebook launch. But since their search engine and browser is free to me, guess we are even steven.
Clicks for 365 days ending 2010-12-31 (Summarized)
Additional features in R over other analytical packages-
1) Source Code is given to ensure complete custom solution and embedding for a particular application. Open source code has an advantage that is extensively peer- reviewed in Journals and Scientific Literature. This means bugs will found, shared and corrected transparently.
2) Wide literature of training material in the form of books is available for the R analytical platform.
3) Extensively the best data visualization tools in analytical software (apart from Tableau Software ‘s latest version). The extensive data visualization available in R is of the form a variety of customizable graphs, as well as animation. The principal reason third-party software initially started creating interfaces to R is because the graphical library of packages in R is more advanced as well as rapidly getting more features by the day.
4) Free in upfront license cost for academics and thus budget friendly for small and large analytical teams.
5) Flexible programming for your data environment. This includes having packages that ensure compatibility with Java, Python and C++.
6) Easy migration from other analytical platforms to R Platform. It is relatively easy for a non R platform user to migrate to R platform and there is no danger of vendor lock-in due to the GPL nature of source code and open community.
Statistics are numbers that tell (descriptive), advise ( prescriptive) or forecast (predictive). Analytics is a decision-making help tool. Analytics on which no decision is to be made or is being considered can be classified as purely statistical and non analytical. Thus ease of making a correct decision separates a good analytical platform from a not so good analytical platform. The distinction is likely to be disputed by people of either background- and business analysis requires more emphasis on how practical or actionable the results are and less emphasis on the statistical metrics in a particular data analysis task. I believe one clear reason between business analytics is different from statistical analysis is the cost of perfect information (data costs in real world) and the opportunity cost of delayed and distorted decision-making.
Specific to the following domains R has the following costs and benefits
Business Analytics
R is free per license and for download
It is one of the few analytical platforms that work on Mac OS
It’s results are credibly established in both journals like Journal of Statistical Software and in the work at LinkedIn, Google and Facebook’s analytical teams.
It has open source code for customization as per GPL
It also has a flexible option for commercial vendors like Revolution Analytics (who support 64 bit windows) as well as bigger datasets
It has interfaces from almost all other analytical software including SAS,SPSS, JMP, Oracle Data Mining, Rapid Miner. Existing license holders can thus invoke and use R from within these software
Huge library of packages for regression, time series, finance and modeling
High quality data visualization packages
Data Mining
R as a computing platform is better suited to the needs of data mining as it has a vast array of packages covering standard regression, decision trees, association rules, cluster analysis, machine learning, neural networks as well as exotic specialized algorithms like those based on chaos models.
Flexibility in tweaking a standard algorithm by seeing the source code
The RATTLE GUI remains the standard GUI for Data Miners using R. It was created and developed in Australia.
Business Dashboards and Reporting
Business Dashboards and Reporting are an essential piece of Business Intelligence and Decision making systems in organizations. R offers data visualization through GGPLOT, and GUI like Deducer and Red-R can help even non R users create a metrics dashboard
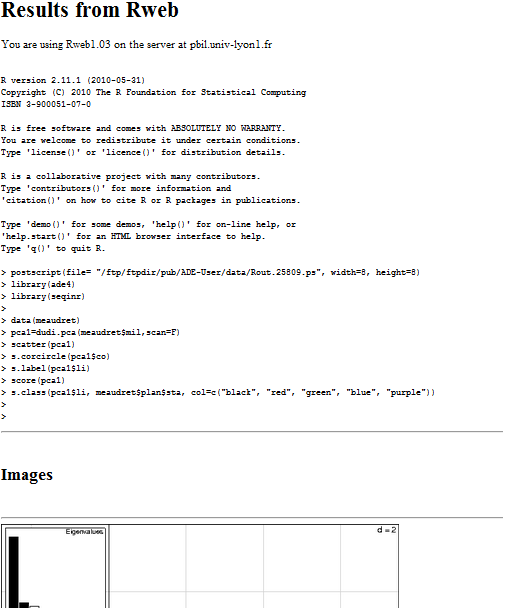
For online Dashboards- R has packages like RWeb, RServe and R Apache- which in combination with data visualization packages offer powerful dashboard capabilities.
R can be combined with MS Excel using the R Excel package – to enable R capabilities to be imported within Excel. Thus a MS Excel user with no knowledge of R can use the GUI within the R Excel plug-in to use powerful graphical and statistical capabilities.
Additional factors to consider in your R installation-
There are some more choices awaiting you now-
1) Licensing Choices-Academic Version or Free Version or Enterprise Version of R
2) Operating System Choices-Which Operating System to choose from? Unix, Windows or Mac OS.
3) Operating system sub choice- 32- bit or 64 bit.
4) Hardware choices-Cost -benefit trade-offs for additional hardware for R. Choices between local ,cluster and cloud computing.
5) Interface choices-Command Line versus GUI? Which GUI to choose as the default start-up option?
6) Software component choice- Which packages to install? There are almost 3000 packages, some of them are complimentary, some are dependent on each other, and almost all are free.
7) Additional Software choices- Which additional software do you need to achieve maximum accuracy, robustness and speed of computing- and how to use existing legacy software and hardware for best complementary results with R.
1) Licensing Choices-
You can choose between two kinds of R installations – one is free and open source from http://r-project.org The other R installation is commercial and is offered by many vendors including Revolution Analytics. However there are other commercial vendors too.
Windows remains the most widely used operating system on this planet. If you are experienced in Windows based computing and are active on analytical projects- it would not make sense for you to move to other operating systems. This is also based on the fact that compatibility problems are minimum for Microsoft Windows and the help is extensively documented. However there may be some R packages that would not function well under Windows- if that happens a multiple operating system is your next option.
Enterprise R from Revolution Analytics- Enterprise R from Revolution Analytics has a complete R Development environment for Windows including the use of code snippets to make programming faster. Revolution is also expected to make a GUI available by 2011. Revolution Analytics claims several enhancements for it’s version of R including the use of optimized libraries for faster performance.
MacOS
Reasons for choosing MacOS remains its considerable appeal in aesthetically designed software- but MacOS is not a standard Operating system for enterprise systems as well as statistical computing. However open source R claims to be quite optimized and it can be used for existing Mac users. However there seem to be no commercially available versions of R available as of now for this operating system.
Linux
Ubuntu
Red Hat Enterprise Linux
Other versions of Linux
Linux is considered a preferred operating system by R users due to it having the same open source credentials-much better fit for all R packages and it’s customizability for big data analytics.
Ubuntu Linux is recommended for people making the transition to Linux for the first time. Ubuntu Linux had an marketing agreement with revolution Analytics for an earlier version of Ubuntu- and many R packages can installed in a straightforward way as Ubuntu/Debian packages are available. Red Hat Enterprise Linux is officially supported by Revolution Analytics for it’s enterprise module. Other versions of Linux popular are Open SUSE.
Multiple operating systems-
Virtualization vs Dual Boot-
You can also choose between having a VMware VM Player for a virtual partition on your computers that is dedicated to R based computing or having operating system choice at the startup or booting of your computer. A software program called wubi helps with the dual installation of Linux and Windows.
64 bit vs 32 bit – Given a choice between 32 bit versus 64 bit versions of the same operating system like Linux Ubuntu, the 64 bit version would speed up processing by an approximate factor of 2. However you need to check whether your current hardware can support 64 bit operating systems and if so- you may want to ask your Information Technology manager to upgrade atleast some operating systems in your analytics work environment to 64 bit operating systems.
Hardware choices- At the time of writing this book, the dominant computing paradigm is workstation computing followed by server-client computing. However with the introduction of cloud computing, netbooks, tablet PCs, hardware choices are much more flexible in 2011 than just a couple of years back.
Hardware costs are a significant cost to an analytics environment and are also remarkably depreciated over a short period of time. You may thus examine your legacy hardware, and your future analytical computing needs- and accordingly decide between the various hardware options available for R.
Unlike other analytical software which can charge by number of processors, or server pricing being higher than workstation pricing and grid computing pricing extremely high if available- R is well suited for all kinds of hardware environment with flexible costs. Given the fact that R is memory intensive (it limits the size of data analyzed to the RAM size of the machine unless special formats and /or chunking is used)- it depends on size of datasets used and number of concurrent users analyzing the dataset. Thus the defining issue is not R but size of the data being analyzed.
Local Computing- This is meant to denote when the software is installed locally. For big data the data to be analyzed would be stored in the form of databases.
Server version- Revolution Analytics has differential pricing for server -client versions but for the open source version it is free and the same for Server or Workstation versions.
Workstation
Cloud Computing- Cloud computing is defined as the delivery of data, processing, systems via remote computers. It is similar to server-client computing but the remote server (also called cloud) has flexible computing in terms of number of processors, memory, and data storage. Cloud computing in the form of public cloud enables people to do analytical tasks on massive datasets without investing in permanent hardware or software as most public clouds are priced on pay per usage. The biggest cloud computing provider is Amazon and many other vendors provide services on top of it. Google is also coming for data storage in the form of clouds (Google Storage), as well as using machine learning in the form of API (Google Prediction API)
Amazon
Google
Cluster-Grid Computing/Parallel processing- In order to build a cluster, you would need the RMpi and the SNOW packages, among other packages that help with parallel processing.
How much resources
RAM-Hard Disk-Processors- for workstation computing
Instances or API calls for cloud computing
Interface Choices
Command Line
GUI
Web Interfaces
Software Component Choices
R dependencies
Packages to install
Recommended Packages
Additional software choices
Additional legacy software
Optimizing your R based computing
Code Editors
Code Analyzers
Libraries to speed up R
citation- R Development Core Team (2010). R: A language and environment for statistical computing. R Foundation for Statistical Computing,Vienna, Austria. ISBN 3-900051-07-0, URL http://www.R-project.org.
is it the russians doing a link spam. unlikely they dont bot against Akismet that much (as they fail)
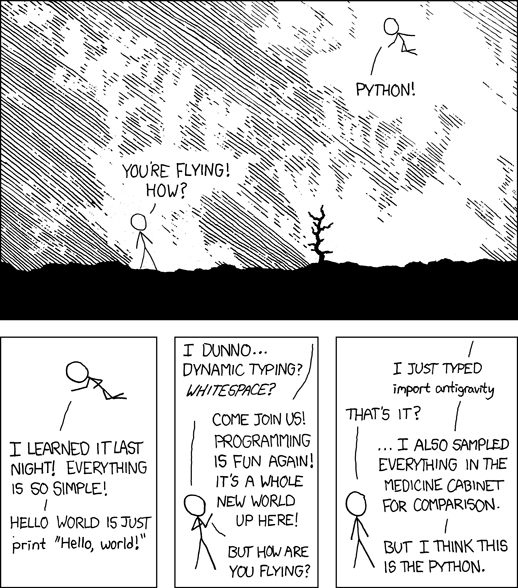
And Captcha can be failed by python (apparently. sigh)
Is there a co relation of certain tags of posts, and count of spam- hoping to distort say blogs’s search engine rankings for SAS WPS Lawsuit in Google or jet ski across pacific in Google.
Sigh- an old retired outlaw black hat is never kept in peace. Try doing a blog search for R in Google- Revo is now down to number 7 (which is hmm given Google Instant)
Of course I think too much about SEO, but I dont run CPC ads- I made much more money when traffic is low – say 5-10 small businesses needing to forecast their sales .
and enjoy your Thanksgiving. Remember the Indians bring the Turkeys.






 What does LibreOffice give you?


 r-bloggers.com
 Reddit
 Twitter
 Google
 en.wordpress.com
 xianblog.wordpress.com