PAWCON -This week in London

Watch out for the twitter hash news on PAWCON and the exciting agenda lined up. If your in the City- you may want to just drop in

http://www.predictiveanalyticsworld.com/london/2010/agenda.php#day1-7

Disclaimer- PAWCON has been a blog partner with Decisionstats (since the first PAWCON ). It is vendor neutral and features open source as well proprietary software, as well case studies from academia and Industry for a balanced view.


Little birdie told me some exciting product enhancements may be in the works including a not yet announced R plugin 😉 and the latest SAS product using embedded analytics and Dr Elder’s full day data mining workshop.

Citation-

http://www.predictiveanalyticsworld.com/london/2010/agenda.php#day1-7

Monday November 15, 2010
All conference sessions take place in Edward 5-7

8:00am-9:00am

Registration, Coffee and Danish
Room: Albert Suites


9:00am-9:50am

Keynote
Five Ways Predictive Analytics Cuts Enterprise Risk

All business is an exercise in risk management. All organizations would benefit from measuring, tracking and computing risk as a core process, much like insurance companies do.

Predictive analytics does the trick, one customer at a time. This technology is a data-driven means to compute the risk each customer will defect, not respond to an expensive mailer, consume a retention discount even if she were not going to leave in the first place, not be targeted for a telephone solicitation that would have landed a sale, commit fraud, or become a “loss customer” such as a bad debtor or an insurance policy-holder with high claims.

In this keynote session, Dr. Eric Siegel will reveal:

  • Five ways predictive analytics evolves your enterprise to reduce risk
  • Hidden sources of risk across operational functions
  • What every business should learn from insurance companies
  • How advancements have reversed the very meaning of fraud
  • Why “man + machine” teams are greater than the sum of their parts for
  • enterprise decision support


Speaker: Eric Siegel, Ph.D., Program Chair, Predictive Analytics World

Top of this page ] [ Agenda overview ]


IBM9:50am-10:10am

Platinum Sponsor Presentation
The Analytical Revolution

The algorithms at the heart of predictive analytics have been around for years – in some cases for decades. But now, as we see predictive analytics move to the mainstream and become a competitive necessity for organisations in all industries, the most crucial challenges are to ensure that results can be delivered to where they can make a direct impact on outcomes and business performance, and that the application of analytics can be scaled to the most demanding enterprise requirements.

This session will look at the obstacles to successfully applying analysis at the enterprise level, and how today’s approaches and technologies can enable the true “industrialisation” of predictive analytics.

Speaker: Colin Shearer, WW Industry Solutions Leader, IBM UK Ltd

Top of this page ] [ Agenda overview ]


Deloitte10:10am-10:20am

Gold Sponsor Presentation
How Predictive Analytics is Driving Business Value

Organisations are increasingly relying on analytics to make key business decisions. Today, technology advances and the increasing need to realise competitive advantage in the market place are driving predictive analytics from the domain of marketers and tactical one-off exercises to the point where analytics are being embedded within core business processes.

During this session, Richard will share some of the focus areas where Deloitte is driving business transformation through predictive analytics, including Workforce, Brand Equity and Reputational Risk, Customer Insight and Network Analytics.

Speaker: Richard Fayers, Senior Manager, Deloitte Analytical Insight

Top of this page ] [ Agenda overview ]


10:20am-10:45am

Break / Exhibits
Room: Albert Suites


10:45am-11:35am
Healthcare
Case Study: Life Line Screening
Taking CRM Global Through Predictive Analytics

While Life Line is successfully executing a US CRM roadmap, they are also beginning this same evolution abroad. They are beginning in the UK where Merkle procured data and built a response model that is pulling responses over 30% higher than competitors. This presentation will give an overview of the US CRM roadmap, and then focus on the beginning of their strategy abroad, focusing on the data procurement they could not get anywhere else but through Merkle and the successful modeling and analytics for the UK.

Speaker: Ozgur Dogan, VP, Quantitative Solutions Group, Merkle Inc.

Speaker: Trish Mathe, Life Line Screening

Top of this page ] [ Agenda overview ]


11:35am-12:25pm
Open Source Analytics; Healthcare
Case Study: A large health care organization
The Rise of Open Source Analytics: Lowering Costs While Improving Patient Care

Rapidminer and R were the number 1 and 2 in this years annual KDNuggets data mining tool usage poll, followed by Knime on place 4 and Weka on place 6. So what’s going on here? Are these open source tools really that good or is their popularity strongly correlated with lower acquisition costs alone? This session answers these questions based on a real world case for a large health care organization and explains the risks & benefits of using open source technology. The final part of the session explains how these tools stack up against their traditional, proprietary counterparts.

Speaker: Jos van Dongen, Associate & Principal, DeltIQ Group

Top of this page ] [ Agenda overview ]


12:25pm-1:25pm

Lunch / Exhibits
Room: Albert Suites


1:25pm-2:15pm
Keynote
Thought Leader:
Case Study: Yahoo! and other large on-line e-businesses
Search Marketing and Predictive Analytics: SEM, SEO and On-line Marketing Case Studies

Search Engine Marketing is a $15B industry in the U.S. growing to double that number over the next 3 years. Worldwide the SEM market was over $50B in 2010. Not only is this a fast growing area of marketing, but it is one that has significant implications for brand and direct marketing and is undergoing rapid change with emerging channels such as mobile and social. What is unique about this area of marketing is a singularly heavy dependence on analytics:


  • Large numbers of variables and options
  • Real-time auctions/bids and a need to adjust strategies in real-time
  • Difficult optimization problems on allocating spend across a huge number of keywords
  • Fast-changing competitive terrain and heavy competition on the obvious channels
  • Complicated interactions between various channels and a large choice of search keyword expansion possibilities
  • Profitability and ROI analysis that are complex and often challenging


The size of the industry, its growing importance in marketing, its upcoming role in Mobile Advertising, and its uniquely heavy reliance on analytics makes it particularly interesting as an area for predictive analytics applications. In this session, not only will hear about some of the latest strategies and techniques to optimize search, you will hear case studies that illustrate the important role of analytics from industry practitioners.

Speaker: Usama Fayyad, , Ph.D., CEO, Open Insights

Top of this page ] [ Agenda overview ]


SAS2:15pm-2:35pm

Platinum Sponsor Presentation
Creating a Model Factory Using in-Database Analytics

With the ever-increasing number of analytical models required to make fact-based decisions, as well as increasing audit compliance regulations, it is more important than ever that these models can be created, monitored, retuned and deployed as quickly and automatically as possible. This paper, using a case study from a major financial organisation, will show how organisations can build a model factory efficiently using the latest SAS technology that utilizes the power of in-database processing.

Speaker: John Spooner, Analytics Specialist, SAS (UK)

Top of this page ] [ Agenda overview ]


2:35pm-2:45pm

Session Break
Room: Albert Suites


2:45pm-3:35pm

Retail
Case Study: SABMiller
Predictive Analytics & Global Marketing Strategy

Over the last few years SABMiller plc, the second largest brewing company in the world operating in 70 countries, has been systematically segmenting its markets in different countries globally in order optimize their portfolio strategy & align it to their long term country specific growth strategy. This presentation talks about the overall methodology followed and the challenges that had to be overcome both from a technical as well as from a change management stand point in order to successfully implement a standard analytics approach to diverse markets and diverse business positions in a highly global setting.

The session explains how country specific growth strategies were converted to objective variables and consumption occasion segments were created that differentiated the market effectively by their growth potential. In addition to this the presentation will also provide a discussion on issues like:

  • The dilemmas of static vs. dynamic solutions and standardization vs. adaptable solutions
  • Challenges in acceptability, local capability development, overcoming implementation inertia, cost effectiveness, etc
  • The role that business partners at SAB and analytics service partners at AbsolutData together play in providing impactful and actionable solutions


Speaker: Anne Stephens, SABMiller plc

Speaker: Titir Pal, AbsolutData

Top of this page ] [ Agenda overview ]


3:35pm-4:25pm

Retail
Case Study: Overtoom Belgium
Increasing Marketing Relevance Through Personalized Targeting


Since many years, Overtoom Belgium – a leading B2B retailer and division of the French Manutan group – focuses on an extensive use of CRM. In this presentation, we demonstrate how Overtoom has integrated Predictive Analytics to optimize customer relationships. In this process, they employ analytics to develop answers to the key question: “which product should we offer to which customer via which channel”. We show how Overtoom gained a 10% revenue increase by replacing the existing segmentation scheme with accurate predictive response models. Additionally, we illustrate how Overtoom succeeds to deliver more relevant communications by offering personalized promotional content to every single customer, and how these personalized offers positively impact Overtoom’s conversion rates.

Speaker: Dr. Geert Verstraeten, Python Predictions

Top of this page ] [ Agenda overview ]


4:25pm-4:50pm

Break / Exhibits
Room: Albert Suites


4:50pm-5:40pm
Uplift Modelling:
Case Study: Lloyds TSB General Insurance & US Bank
Uplift Modelling: You Should Not Only Measure But Model Incremental Response

Most marketing analysts understand that measuring the impact of a marketing campaign requires a valid control group so that uplift (incremental response) can be reported. However, it is much less widely understood that the targeting models used almost everywhere do not attempt to optimize that incremental measure. That requires an uplift model.

This session will explain why a switch to uplift modelling is needed, illustrate what can and does go wrong when they are not used and the hugely positive impact they can have when used effectively. It will also discuss a range of approaches to building and assessing uplift models, from simple basic adjustments to existing modelling processes through to full-blown uplift modelling.

The talk will use Lloyds TSB General Insurance & US Bank as a case study and also illustrate real-world results from other companies and sectors.


Speaker: Nicholas Radcliffe, Founder and Director, Stochastic Solutions

Top of this page ] [ Agenda overview ]


5:40pm-6:30pm

Consumer services
Case Study: Canadian Automobile Association and other B2C examples
The Diminishing Marginal Returns of Variable Creation in Predictive Analytics Solutions


Variable Creation is the key to success in any predictive analytics exercise. Many different approaches are adopted during this process, yet there are diminishing marginal returns as the number of variables increase. Our organization conducted a case study on four existing clients to explore this so-called diminishing impact of variable creation on predictive analytics solutions. Existing predictive analytics solutions were built using our traditional variable creation process. Yet, presuming that we could exponentially increase the number of variables, we wanted to determine if this added significant benefit to the existing solution.

Speaker: Richard Boire, BoireFillerGroup

Top of this page ] [ Agenda overview ]


6:30pm-7:30pm

Reception / Exhibits
Room: Albert Suites


Tuesday November 16, 2010
All conference sessions take place in Edward 5-7

8:00am-9:00am

Registration, Coffee and Danish
Room: Albert Suites


9:00am-9:55am
Keynote
Multiple Case Studies: Anheuser-Busch, Disney, HP, HSBC, Pfizer, and others
The High ROI of Data Mining for Innovative Organizations

Data mining and advanced analytics can enhance your bottom line in three basic ways, by 1) streamlining a process, 2) eliminating the bad, or 3) highlighting the good. In rare situations, a fourth way – creating something new – is possible. But modern organizations are so effective at their core tasks that data mining usually results in an iterative, rather than transformative, improvement. Still, the impact can be dramatic.

Dr. Elder will share the story (problem, solution, and effect) of nine projects conducted over the last decade for some of America’s most innovative agencies and corporations:

    Streamline:

  • Cross-selling for HSBC
  • Image recognition for Anheuser-Busch
  • Biometric identification for Lumidigm (for Disney)
  • Optimal decisioning for Peregrine Systems (now part of Hewlett-Packard)
  • Quick decisions for the Social Security Administration
    Eliminate Bad:

  • Tax fraud detection for the IRS
  • Warranty Fraud detection for Hewlett-Packard
    Highlight Good:

  • Sector trading for WestWind Foundation
  • Drug efficacy discovery for Pharmacia & UpJohn (now Pfizer)

Moderator: Eric Siegel, Program Chair, Predictive Analytics World

Speaker: John Elder, Ph.D., Elder Research, Inc.

Also see Dr. Elder’s full-day workshop


Top of this page ] [ Agenda overview ]


9:55am-10:30am

Break / Exhibits
Room: Albert Suites


10:30am-11:20am
Telecommunications
Case Study: Leading Telecommunications Operator
Predictive Analytics and Efficient Fact-based Marketing

The presentation describes what are the major topics and issues when you introduce predictive analytics and how to build a Fact-Based marketing environment. The introduced tools and methodologies proved to be highly efficient in terms of improving the overall direct marketing activity and customer contact operations for the involved companies. Generally, the introduced approaches have great potential for organizations with large customer bases like Mobile Operators, Internet Giants, Media Companies, or Retail Chains.

Main Introduced Solutions:-Automated Serial Production of Predictive Models for Campaign Targeting-Automated Campaign Measurements and Tracking Solutions-Precise Product Added Value Evaluation.

Speaker: Tamer Keshi, Ph.D., Long-term contractor, T-Mobile

Speaker: Beata Kovacs, International Head of CRM Solutions, Deutsche Telekom

Top of this page ] [ Agenda overview ]


11:20am-11:25am

Session Changeover


11:25am-12:15pm
Thought Leader
Nine Laws of Data Mining

Data mining is the predictive core of predictive analytics, a business process that finds useful patterns in data through the use of business knowledge. The industry standard CRISP-DM methodology describes the process, but does not explain why the process takes the form that it does. I present nine “laws of data mining”, useful maxims for data miners, with explanations that reveal the reasons behind the surface properties of the data mining process. The nine laws have implications for predictive analytics applications: how and why it works so well, which ambitions could succeed, and which must fail.


Speaker: Tom Khabaza, khabaza.com


Top of this page ] [ Agenda overview ]


12:15pm-1:30pm

Lunch / Exhibits
Room: Albert Suites


1:30pm-2:25pm
Expert Panel: Kaboom! Predictive Analytics Hits the Mainstream

Predictive analytics has taken off, across industry sectors and across applications in marketing, fraud detection, credit scoring and beyond. Where exactly are we in the process of crossing the chasm toward pervasive deployment, and how can we ensure progress keeps up the pace and stays on target?

This expert panel will address:

  • How much of predictive analytics’ potential has been fully realized?
  • Where are the outstanding opportunities with greatest potential?
  • What are the greatest challenges faced by the industry in achieving wide scale adoption?
  • How are these challenges best overcome?


Panelist: John Elder, Ph.D., Elder Research, Inc.

Panelist: Colin Shearer, WW Industry Solutions Leader, IBM UK Ltd

Panelist: Udo Sglavo, Global Analytic Solutions Manager, SAS

Panel moderator: Eric Siegel, Ph.D., Program Chair, Predictive Analytics World


2:25pm-2:30pm

Session Changeover


2:30pm-3:20pm
Crowdsourcing Data Mining
Case Study: University of Melbourne, Chessmetrics
Prediction Competitions: Far More Than Just a Bit of Fun

Data modelling competitions allow companies and researchers to post a problem and have it scrutinised by the world’s best data scientists. There are an infinite number of techniques that can be applied to any modelling task but it is impossible to know at the outset which will be most effective. By exposing the problem to a wide audience, competitions are a cost effective way to reach the frontier of what is possible from a given dataset. The power of competitions is neatly illustrated by the results of a recent bioinformatics competition hosted by Kaggle. It required participants to pick markers in HIV’s genetic sequence that coincide with changes in the severity of infection. Within a week and a half, the best entry had already outdone the best methods in the scientific literature. This presentation will cover how competitions typically work, some case studies and the types of business modelling challenges that the Kaggle platform can address.

Speaker: Anthony Goldbloom, Kaggle Pty Ltd

Top of this page ] [ Agenda overview ]


3:20pm-3:50pm

Breaks /Exhibits
Room: Albert Suites


3:50pm-4:40pm
Human Resources; e-Commerce
Case Study: Naukri.com, Jeevansathi.com
Increasing Marketing ROI and Efficiency of Candidate-Search with Predictive Analytics

InfoEdge, India’s largest and most profitable online firm with a bouquet of internet properties has been Google’s biggest customer in India. Our team used predictive modeling to double our profits across multiple fronts. For Naukri.com, India’s number 1 job portal, predictive models target jobseekers most relevant to the recruiter. Analytical insights provided a deeper understanding of recruiter behaviour and informed a redesign of this product’s recruiter search functionality. This session will describe how we did it, and also reveal how Jeevansathi.com, India’s 2nd-largest matrimony portal, targets the acquisition of consumers in the market for marriage.


Speaker: Suvomoy Sarkar, Chief Analytics Officer, HT Media & Info Edge India (parent company of the two companies above)


Top of this page ] [ Agenda overview ]


4:40pm-5:00pm
Closing Remarks

Speaker: Eric Siegel, Ph.D., Program Chair, Predictive Analytics World

Top of this page ] [ Agenda overview ]


Wednesday November 17, 2010

Full-day Workshop
The Best and the Worst of Predictive Analytics:
Predictive Modeling Methods and Common Data Mining Mistakes

Click here for the detailed workshop description

  • Workshop starts at 9:00am
  • First AM Break from 10:00 – 10:15
  • Second AM Break from 11:15 – 11:30
  • Lunch from 12:30 – 1:15pm
  • First PM Break: 2:00 – 2:15
  • Second PM Break: 3:15 – 3:30
  • Workshop ends at 4:30pm

Speaker: John Elder, Ph.D., CEO and Founder, Elder Research, Inc.


Cloud Computing with R

Illusion of Depth and Space (4/22) - Rotating ...
Image by Dominic's pics via Flickr

Here is a short list of resources and material I put together as starting points for R and Cloud Computing It’s a bit messy but overall should serve quite comprehensively.

Cloud computing is a commonly used expression to imply a generational change in computing from desktop-servers to remote and massive computing connections,shared computers, enabled by high bandwidth across the internet.

As per the National Institute of Standards and Technology Definition,
Cloud computing is a model for enabling convenient, on-demand network access to a shared pool of configurable computing resources (e.g., networks, servers, storage, applications, and services) that can be rapidly provisioned and released with minimal management effort or service provider interaction.

(Citation: The NIST Definition of Cloud Computing

Authors: Peter Mell and Tim Grance
Version 15, 10-7-09
National Institute of Standards and Technology, Information Technology Laboratory
http://csrc.nist.gov/groups/SNS/cloud-computing/cloud-def-v15.doc)

R is an integrated suite of software facilities for data manipulation, calculation and graphical display.

From http://cran.r-project.org/doc/FAQ/R-FAQ.html#R-Web-Interfaces

R Web Interfaces

Rweb is developed and maintained by Jeff Banfield. The Rweb Home Page provides access to all three versions of Rweb—a simple text entry form that returns output and graphs, a more sophisticated JavaScript version that provides a multiple window environment, and a set of point and click modules that are useful for introductory statistics courses and require no knowledge of the R language. All of the Rweb versions can analyze Web accessible datasets if a URL is provided.
The paper “Rweb: Web-based Statistical Analysis”, providing a detailed explanation of the different versions of Rweb and an overview of how Rweb works, was published in the Journal of Statistical Software (http://www.jstatsoft.org/v04/i01/).

Ulf Bartel has developed R-Online, a simple on-line programming environment for R which intends to make the first steps in statistical programming with R (especially with time series) as easy as possible. There is no need for a local installation since the only requirement for the user is a JavaScript capable browser. See http://osvisions.com/r-online/ for more information.

Rcgi is a CGI WWW interface to R by MJ Ray. It had the ability to use “embedded code”: you could mix user input and code, allowing the HTMLauthor to do anything from load in data sets to enter most of the commands for users without writing CGI scripts. Graphical output was possible in PostScript or GIF formats and the executed code was presented to the user for revision. However, it is not clear if the project is still active.

Currently, a modified version of Rcgi by Mai Zhou (actually, two versions: one with (bitmap) graphics and one without) as well as the original code are available from http://www.ms.uky.edu/~statweb/.

CGI-based web access to R is also provided at http://hermes.sdu.dk/cgi-bin/go/. There are many additional examples of web interfaces to R which basically allow to submit R code to a remote server, see for example the collection of links available from http://biostat.mc.vanderbilt.edu/twiki/bin/view/Main/StatCompCourse.

David Firth has written CGIwithR, an R add-on package available from CRAN. It provides some simple extensions to R to facilitate running R scripts through the CGI interface to a web server, and allows submission of data using both GET and POST methods. It is easily installed using Apache under Linux and in principle should run on any platform that supports R and a web server provided that the installer has the necessary security permissions. David’s paper “CGIwithR: Facilities for Processing Web Forms Using R” was published in the Journal of Statistical Software (http://www.jstatsoft.org/v08/i10/). The package is now maintained by Duncan Temple Lang and has a web page athttp://www.omegahat.org/CGIwithR/.

Rpad, developed and actively maintained by Tom Short, provides a sophisticated environment which combines some of the features of the previous approaches with quite a bit of JavaScript, allowing for a GUI-like behavior (with sortable tables, clickable graphics, editable output), etc.
Jeff Horner is working on the R/Apache Integration Project which embeds the R interpreter inside Apache 2 (and beyond). A tutorial and presentation are available from the project web page at http://biostat.mc.vanderbilt.edu/twiki/bin/view/Main/RApacheProject.

Rserve is a project actively developed by Simon Urbanek. It implements a TCP/IP server which allows other programs to use facilities of R. Clients are available from the web site for Java and C++ (and could be written for other languages that support TCP/IP sockets).

OpenStatServer is being developed by a team lead by Greg Warnes; it aims “to provide clean access to computational modules defined in a variety of computational environments (R, SAS, Matlab, etc) via a single well-defined client interface” and to turn computational services into web services.

Two projects use PHP to provide a web interface to R. R_PHP_Online by Steve Chen (though it is unclear if this project is still active) is somewhat similar to the above Rcgi and Rweb. R-php is actively developed by Alfredo Pontillo and Angelo Mineo and provides both a web interface to R and a set of pre-specified analyses that need no R code input.

webbioc is “an integrated web interface for doing microarray analysis using several of the Bioconductor packages” and is designed to be installed at local sites as a shared computing resource.

Rwui is a web application to create user-friendly web interfaces for R scripts. All code for the web interface is created automatically. There is no need for the user to do any extra scripting or learn any new scripting techniques. Rwui can also be found at http://rwui.cryst.bbk.ac.uk.

Finally, the R.rsp package by Henrik Bengtsson introduces “R Server Pages”. Analogous to Java Server Pages, an R server page is typically HTMLwith embedded R code that gets evaluated when the page is requested. The package includes an internal cross-platform HTTP server implemented in Tcl, so provides a good framework for including web-based user interfaces in packages. The approach is similar to the use of the brew package withRapache with the advantage of cross-platform support and easy installation.

Also additional R Cloud Computing Use Cases
http://wwwdev.ebi.ac.uk/Tools/rcloud/

ArrayExpress R/Bioconductor Workbench

Remote access to R/Bioconductor on EBI’s 64-bit Linux Cluster

Start the workbench by downloading the package for your operating system (Macintosh or Windows), or via Java Web Start, and you will get access to an instance of R running on one of EBI’s powerful machines. You can install additional packages, upload your own data, work with graphics and collaborate with colleagues, all as if you are running R locally, but unlimited by your machine’s memory, processor or data storage capacity.

  • Most up-to-date R version built for multicore CPUs
  • Access to all Bioconductor packages
  • Access to our computing infrastructure
  • Fast access to data stored in EBI’s repositories (e.g., public microarray data in ArrayExpress)

Using R Google Docs
http://www.omegahat.org/RGoogleDocs/run.pdf
It uses the XML and RCurl packages and illustrates that it is relatively quick and easy
to use their primitives to interact with Web services.

Using R with Amazon
Citation
http://rgrossman.com/2009/05/17/running-r-on-amazons-ec2/

Amazon’s EC2 is a type of cloud that provides on demand computing infrastructures called an Amazon Machine Images or AMIs. In general, these types of cloud provide several benefits:

  • Simple and convenient to use. An AMI contains your applications, libraries, data and all associated configuration settings. You simply access it. You don’t need to configure it. This applies not only to applications like R, but also can include any third-party data that you require.
  • On-demand availability. AMIs are available over the Internet whenever you need them. You can configure the AMIs yourself without involving the service provider. You don’t need to order any hardware and set it up.
  • Elastic access. With elastic access, you can rapidly provision and access the additional resources you need. Again, no human intervention from the service provider is required. This type of elastic capacity can be used to handle surge requirements when you might need many machines for a short time in order to complete a computation.
  • Pay per use. The cost of 1 AMI for 100 hours and 100 AMI for 1 hour is the same. With pay per use pricing, which is sometimes called utility pricing, you simply pay for the resources that you use.

Connecting to R on Amazon EC2- Detailed tutorials
Ubuntu Linux version
https://decisionstats.com/2010/09/25/running-r-on-amazon-ec2/
and Windows R version
https://decisionstats.com/2010/10/02/running-r-on-amazon-ec2-windows/

Connecting R to Data on Google Storage and Computing on Google Prediction API
https://github.com/onertipaday/predictionapirwrapper
R wrapper for working with Google Prediction API

This package consists in a bunch of functions allowing the user to test Google Prediction API from R.
It requires the user to have access to both Google Storage for Developers and Google Prediction API:
see
http://code.google.com/apis/storage/ and http://code.google.com/apis/predict/ for details.

Example usage:

#This example requires you had previously created a bucket named data_language on your Google Storage and you had uploaded a CSV file named language_id.txt (your data) into this bucket – see for details
library(predictionapirwrapper)

and Elastic R for Cloud Computing
http://user2010.org/tutorials/Chine.html

Abstract

Elastic-R is a new portal built using the Biocep-R platform. It enables statisticians, computational scientists, financial analysts, educators and students to use cloud resources seamlessly; to work with R engines and use their full capabilities from within simple browsers; to collaborate, share and reuse functions, algorithms, user interfaces, R sessions, servers; and to perform elastic distributed computing with any number of virtual machines to solve computationally intensive problems.
Also see Karim Chine’s http://biocep-distrib.r-forge.r-project.org/

R for Salesforce.com

At the point of writing this, there seem to be zero R based apps on Salesforce.com This could be a big opportunity for developers as both Apex and R have similar structures Developers could write free code in R and charge for their translated version in Apex on Salesforce.com

Force.com and Salesforce have many (1009) apps at
http://sites.force.com/appexchange/home for cloud computing for
businesses, but very few forecasting and statistical simulation apps.

Example of Monte Carlo based app is here
http://sites.force.com/appexchange/listingDetail?listingId=a0N300000016cT9EAI#

These are like iPhone apps except meant for business purposes (I am
unaware if any university is offering salesforce.com integration
though google apps and amazon related research seems to be on)

Force.com uses a language called Apex  and you can see
http://wiki.developerforce.com/index.php/App_Logic and
http://wiki.developerforce.com/index.php/An_Introduction_to_Formulas
Apex is similar to R in that is OOPs

SAS Institute has an existing product for taking in Salesforce.com data.

A new SAS data surveyor is
available to access data from the Customer Relationship Management
(CRM) software vendor Salesforce.com. at
http://support.sas.com/documentation/cdl/en/whatsnew/62580/HTML/default/viewer.htm#datasurveyorwhatsnew902.htm)

Personal Note-Mentioning SAS in an email to a R list is a big no-no in terms of getting a response and love. Same for being careless about which R help list to email (like R devel or R packages or R help)

For python based cloud see http://pi-cloud.com

Here comes PySpread- 85,899,345 rows and 14,316,555 columns

A Bold GNU Head
Image via Wikipedia

Whats new/ One more open source analytics package. Built like a spreadsheet with an ability to import a million cells-

From http://pyspread.sourceforge.net/index.html

about Pyspread is a cross-platform Python spreadsheet application. It is based on and written in the programming language Python.

Instead of spreadsheet formulas, Python expressions are entered into the spreadsheet cells. Each expression returns a Python object that can be accessed from other cells. These objects can represent anything including lists or matrices.

Pyspread screenshot
features In pyspread, cells expect Python expressions and return Python objects. Therefore, complex data types such as lists, trees or matrices can be handled within a single cell. Macros can be used for functions that are too complex for a single expression.

Since Python modules can be easily used without external scripts, arbitrary size rational numbers (via gmpy), fixed point decimal numbers for business calculations, (via the decimal module from the standard library) and advanced statistics including plotting functions (via RPy) can be used in the spreadsheet. Everything is directly available from each cell. Just use the grid

Data can be imported and exported using csv files or the clipboard. Other forms of data exchange is possible using external Python modules.

In  order to simplify sparse matrix editing, pyspread features a three dimensional grid that can be sized up to 85,899,345 rows and 14,316,555 columns (64 bit-systems, depends on row height and column width). Note that importing a million cells requires about 500 MB of memory.

The concept of pyspread allows doing everything from each cell that a Python script can do. This may very well include deleting your hard drive or sending your data via the Internet. Of course this is a non-issue if you sandbox properly or if you only use self developed spreadsheets. Since this is not the case for everyone (see the discussion at lwn.net), a GPG signature based trust model for spreadsheet files has been introduced. It ensures that only your own trusted files are executed on loading. Untrusted files are displayed in safe mode. You can trust a file manually. Inspect carefully.

Pyspread screenshot

requirements Pyspread runs on Linux, Windows and *nix platforms with GTK+ support. There are reports that it works with MacOS X as well. If you would like to contribute by testing on OS X please contact me.

Dependencies

Highly recommended for full functionality

  • PyMe >=0.8.1, Note for Windows™ users: If you want to use signatures without compiling PyMe try out Gpg4win.
  • gmpy >=1.1.0 and
  • rpy >=1.0.3.
maturity Pyspread is in early Beta release. This means that the core functionality is fully implemented but the program needs testing and polish.

and from the wiki

http://sourceforge.net/apps/mediawiki/pyspread/index.php?title=Main_Page

a spreadsheet with more powerful functions and data structures that are accessible inside each cell. Something like Python that empowers you to do things quickly. And yes, it should be free and it should run on Linux as well as on Windows. I looked around and found nothing that suited me. Therefore, I started pyspread.

Concept

  • Each cell accepts any input that works in a Python command line.
  • The inputs are parsed and evaluated by Python’s eval command.
  • The result objects are accessible via a 3D numpy object array.
  • String representations of the result objects are displayed in the cells.

Benefits

  • Each cell returns a Python object. This object can be anything including arrays and third party library objects.
  • Generator expressions can be used efficiently for data manipulation.
  • Efficient numpy slicing is used.
  • numpy methods are accessible for the data.

Installation

  1. Download the pyspread tarball or zip and unzip at a convenient place
  2. In case you do not have it already get and install Python, wxpython and numpy
If you want the examples to work, install gmpy, R and rpy
Really do check the version requirements that are mentioned on http://pyspread.sf.net
  1. Get install privileges (e.g. become root)
  2. Change into the directory and type
python setup.py install
Windows: Replace “python” with your Python interpreter (absolute path)
  1. Become normal user again
  2. Start pyspread by typing
pyspread
  1. Enjoy

Links

Next on Spreadsheet wishlist-

a MSI bundle /Windows Self Installer which has all dependencies bundled in it-linking to PostGresSQL 😉 etc

way to go Mr Martin Manns

mmanns < at > gmx < dot > net

Open Source's worst enemy is itself not Microsoft/SAS/SAP/Oracle

The decision of quality open source makers to offer their software at bargain basement prices even to enterprise customers who are used to pay prices many times more-pricing is the reason open source software is taking a long time to command respect in enterprise software.

I hate to be the messenger who brings the bad news to my open source brethren-

but their worst nightmare is not the actions of their proprietary competitors like Oracle, SAP, SAS, Microsoft ( they hate each other even more than open source )

nor the collective marketing tactics which are textbook like (but referred as Fear Uncertainty Doubt by those outside that golden quartet)- it is their own communities and their own cheap pricing.

It is community action which prevents them from offering their software by ridiculously low bargain basement prices. James Dixon, head geek and founder at Pentaho has a point when he says traditional metrics like revenue need o be adjusted for this impact in his article at http://jamesdixon.wordpress.com/2010/11/02/comparing-open-source-and-proprietary-software-markets/

But James, why offer software to enterprise customers at one tenth the next competitor- one reason is open source companies more often than not compete more with their free community version software than with big proprietary packages.

Communities including academics are used to free- hey how about paying say 1$ for each download.

There are two million R users- if say even 50 % of them  paid 1 $ as a lifetime license fee- you could sponsor enough new packages than twenty years of Google Summer of Code does right now.

Secondly, this pricing can easily be adjusted by shifting the licensing to say free for businesses less than 2 people (even for the enhanced corporate software version not just the plain vanilla community software thus further increasing the spread of the plain vanilla versions)- for businesses from 10 to 20 people offer a six month trial rather than one month trial.

– but adjust the pricing to much more realistic levels compared to competing software. Make enterprise software pay a real value.

That’s the only way to earn respect. as well as a few dollars more.

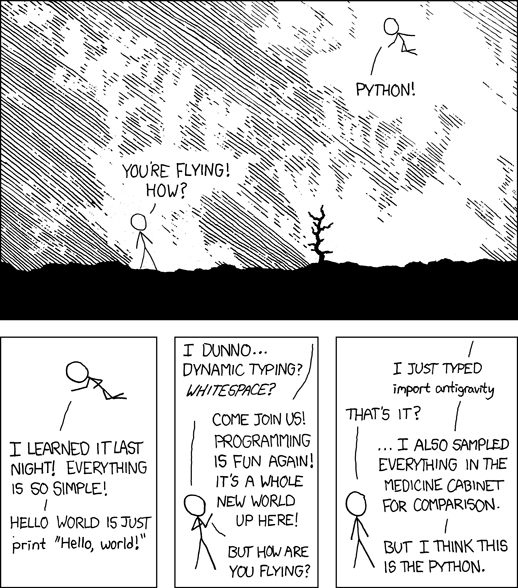
As for SAS, it is time it started ridiculing Python now that it has accepted R.

Python is even MORE powerful than R in some use cases for stat computing

Dixon’s Pentaho and the Jaspersoft/ Revolution combo are nice _ I tested both Jasper and Pentaho thanks to these remarks this week 🙂  (see slides at http://www.jaspersoft.com/sites/default/files/downloads/events/Analytics%20-Jaspersoft-SEP2010.pdf or http://www.revolutionanalytics.com/news-events/free-webinars/2010/deploying-r/index.php )

Pentaho and Jasper do give good great graphics in BI (Graphical display in BI is not a SAS forte though probably I dont know how much they cross sell JMP to BI customers- probably too much JMP is another division syndrome there)

Going Deap : Algols in Python

Logo of PyPy
Image via Wikipedia

Here is an important new step in Python- the established statistical programming language (used to be really pushed by SPSS in pre-IBM days and the rPy package integrates R and Python).

Well the news  ( http://www.kdnuggets.com/2010/10/eap-evolutionary-algorithms-in-python.html ) is the release of Distributed Evolutionary Algorithms in Python. If your understanding of modeling means running regression and iterating it- you may need to read some more.  If you have felt frustrated at lack of parallelization in statistical software as well as your own hardware constraints- well go DEAP (and for corporate types the licensing is

http://www.gnu.org/licenses/lgpl.html ).

http://code.google.com/p/deap/

DEAP

DEAP is intended to be an easy to use distributed evolutionary algorithm library in the Python language. Its two main components are modular and can be used separately. The first module is a Distributed Task Manager (DTM), which is intended to run on cluster of computers. The second part is the Evolutionary Algorithms in Python (EAP) framework.

DTM

DTM is a distributed task manager that is able to spread workload over a buch of computers using a TCP or a MPI connection.

DTM include the following features:


EAP

Features

EAP includes the following features:

  • Genetic algorithm using any imaginable representation
    • List, Array, Set, Dictionary, Tree, …
  • Genetic programing using prefix trees
    • Loosely typed, Strongly typed
    • Automatically defined functions (new v0.6)
  • Evolution strategies (including CMA-ES)
  • Multi-objective optimisation (NSGA-II, SPEA-II)
  • Parallelization of the evaluations (and maybe more) (requires python2.6 and preferably python2.7) (new v0.6)
  • Genealogy of an evolution (that is compatible with NetworkX) (new v0.6)
  • Hall of Fame of the best individuals that lived in the population (new v0.5)
  • Milestones that take snapshot of a system regularly (new v0.5)


Documentation

See the eap user’s guide for EAP 0.6 documentation.

Requirement

The most basic features of EAP requires Python2.5 (we simply do not offer support for 2.4). In order to use multiprocessing you will need Python2.6 and to be able to combine the toolbox and the multiprocessing module Python2.7 is needed for its support to pickle partial functions.

Projects using EAP

If you want your project listed here, simply send us a link and a brief description and we’ll be glad to add it.

and from the wordpress.com blog (funny how people like code.google.com but not blogger.google.com anymore) at http://deapdev.wordpress.com/

EAP is part of the DEAP project, that also includes some facilities for the automatic distribution and parallelization of tasks over a cluster of computers. The D part of DEAP, called DTM, is under intense development and currently available as an alpha version. DTM currently provides two and a half ways to distribute workload on a cluster or LAN of workstations, based on MPI and TCP communication managers.

This public release (version 0.6) is more complete and simpler than ever. It includes Genetic Algorithms using any imaginable representation, Genetic Programming with strongly and loosely typed trees in addition to automatically defined functions, Evolution Strategies (including Covariance Matrix Adaptation), multiobjective optimization techniques (NSGA-II and SPEA2), easy parallelization of algorithms and much more like milestones, genealogy, etc.

We are impatient to hear your feedback and comments on that system at .

Best,

François-Michel De Rainville
Félix-Antoine Fortin
Marc-André Gardner
Christian Gagné
Marc Parizeau

Laboratoire de vision et systèmes numériques
Département de génie électrique et génie informatique
Université Laval
Quebec City (Quebec), Canada

and if you are new to Python -sigh here are some statistical things (read ad-van-cED analytics using Python) by a slideshare from Visual numerics (pre Rogue Wave acquisition)

Also see,

http://code.google.com/p/deap/wiki/SimpleExample


Analytics and Journals

Some good journals for reading on analytics-

1) JSS

http://www.jstatsoft.org/

present research that demonstrates the joint evolution of computational and statistical methods and techniques.  Implementations can use languages such as C, C++, S, Fortran, Java, PHP, Python and Ruby or environments such as Mathematica, MATLAB, R, S-PLUS, SAS, Stata, and XLISP-STAT.

There are currently 370 articles, 23 code snippets, 86 book reviews, 4 software reviews, and 7 special volumes in archives

2) R Journal

http://journal.r-project.org/

The  Journal

3) Pharma Programming

http://maney.co.uk/index.php/journals/pha/

Pharmaceutical Programming is the official journal of the Pharmaceutical Users Software Exchange (PhUSE), a non-profit membership society with the objective of educating programmers and their managers working in the pharmaceutical industry. Available both in print and online, Pharmaceutical Programming is an international journal with focus on programming in the regulated environment of the pharmaceutical and life sciences industry.

4) SAS Papers – User Groups

http://www.lexjansen.com/

4569 SAS papers presented
at SGF/SUGI 1996-2010.
1343 SAS papers presented
at PharmaSUG 2000-2010.
1810 SAS papers presented
at NESUG 1997-2009.
1191 SAS papers presented
at SESUG 1999-2009.
463 SAS papers presented
at PhUSE 2005-2009.
787 SAS papers presented
at WUSS 2003-2009.
337 SAS papers presented
at MWSUG 2001, 2004-2009.
188 SAS papers presented
at PNWSUG 2004-2009.
246 SAS papers presented
at SCSUG 2003-2007, 2009.
221 SAS papers related to CDISC.
Easy access to the CDISC Forum.

5) http://analyticsmagazine.com/

Magazine by http://www.informs.org/

6) Data Mining Journals

Academic Journals

Journals relevant to Data Mining

Interview –Jon Peck SPSS

JonPeck


I was in the middle of interviewing people as well as helping the good people in my new role as a community evangelist at Smart Data Collective when I got a LinkedIn Request to join the SDC group  from Jon Peck .

SPSS Inc. is a leading worldwide provider of predictive analytics software and solutions. Founded in 1968, today SPSS has more than 250,000 customers worldwide, served by more than 1,200 employees in 60 countries .Now Jon is a legendary SPSS figure and a great teacher in this field .I asked him for an interview he readily agreed.

Jon Peck is a Principal Software Engineer and Technical Advisor at SPSS. He has been working with SPSS since 1983  and in the interview he talks from the breadth of his perspective and experience on things in analytics and at SPSS .

Ajay – Describe your career journey from college to today. What advice would you give to young students seeking to be hedge fund managers rather than scientists.  What are the basic things that a science education can help students with , in your opinion ?

Jon– After graduating from college with a B.A. in math, I earned a Ph. D in Economics, specializing in econometrics, and taught at a top American university for 13 years in the Economics and Statistics Departments and the School of Organization and Management.  Working in an academic environment all that time was a great opportunity to grow intellectually.  I was increasingly drawn to computing and eventually decided to join a statistical software company.  There were only two substantial ones at the time.  After a lot of thought, I joined SPSS as it seemed to be the more interesting place and one where I would be able to work in a wider variety of areas.  That was over 25 years ago!  Now I have some opportunities to teach and speak again as well as working in development, which I enjoy a lot.

I still believe in getting a broad liberal arts education along with as much quantitative training as possible.  Being able to work in very different areas has been a big asset for me.  Most people will have multiple careers, so preparing broadly is the most important career thing you can do.  As for hedge fund jobs if there are any left, I’d say not to be starry-eyed about the money.  If you don’t choose a career that really interests you, you won’t be very successful anyway. Do what you love subject to earning a living.

Math and scientific reasoning skills are preparation for working in many areas as well as being helpful in making the many decisions with quantitative aspects in life.  Math, especially, provides a foundation useful in many areas.  The recently announced program in the UK to improve general understanding of probability illustrates some practical value.

Ajay- What are SPSS’s contribution to Open Source software . What ,if you can disclose are any plans for further increasing that involvement.

Jon-  I wish I could talk about SPSS future plans, but I can’t.  However, the company is committed to continuing its efforts in Python and R.  By opening up the SPSS technology with these open source technologies, we are able to expand what we and our users can do.  At the same time, we can make R more attractive through nicer output and simpler syntax and taking away much of the pain.  One of the things I love about this approach is how quickly and easily new things can be produced and distributed this way compared to the traditional development cycle.  I wrote about productivity and Python recently on my blog at insideout.spss.com.

Ajay – How happy is the SPSS developer community with Python . Are there any other languages that you are considering in the future.

Jon- Many in the SPSS user community were more used to packaged procedures than to programming (except in the area of data transformations).  So Python, first, and then R were a shock.  But the benefits are so large that we have had an excellent response to both the Python and R technologies.  Some have mastered the technology and have been very successful and have made contributions back to the SPSS community.  Others are consumers of this technology, especially through our custom dialogs and extension commands that eliminate the need to learn Python or R in order to use programs in these languages.  Python is an outstanding language.  It is easy to get started with it, but it has very sophisticated features.  It has fewer dark corners than any other language I know.  While there are a few other more popular languages, Python popularity has been steadily growing, especially in the scientific and statistical communities.  But we already have support for three high-level languages, and if there is enough demand, we’ll do more.

Some of our partners prefer to use the lower-level C language interfaces we offer.  That’s fine, too.  We’re not Python zealots (well, maybe, I am).  Python, as a scripting language, isn’t as fast as a compiled language.  For many purposes this does not matter, and Python itself is written in C.  I recently wrote a Python module for TURF analysis.  The computations are simple but computationally explosive, so I was worried that it would be too slow to be useful.   It turned out to be pretty fast because of the way I could use some of Python’s built-in data structures and algorithms.  And the popular numPy and SciPy scientific and numerical libraries are written in C.

Users who would not think of themselves as developers sometimes find that a small Python effort can automate manual work with big time and accuracy improvements.  I got a note recently from a user who said, "I got it to work, and this is FANTASTIC! It will save me a lot of time in my survey analysis work."

Ajay- What are the areas where SPSS is not a good fit for using. What areas suit SPSS software the most compared to other solutions.

Jon- SPSS Statistics, the product,  is not a database.  Our strength is in applying analytical methods to data for model building, prediction, and insight.  Although SPSS Statistics is used in a wide variety of areas, we focus first on people data and think of that first when planning and designing new features.  SPSS Statistics and other SPSS products all work well with databases, and we have solutions for deploying analytics into production systems, but we’re not going to do your payroll.  One thing that was a surprise to me a few years ago is that we have a significant number of users who use SPSS Statistics as a basic reporting product but don’t do any inferential statistics.  They find that they can do customized reporting often using the Custom Tables module very quickly.  With Version 17, they can also do fancier and dynamic output formatting without resorting to script writing or manual editing, which is proving very attractive.

Ajay- Are there any plans for SPSS to use Software as a Service Model . Any plans to use advances in remote and cloud computing for SPSS ?

Jon- We are certainly looking at cloud computing.  The biggest challenge is being able to put things in the cloud that will be robust and reliable.

Ajay- What are SPSS’s Asia plans ? Which
country has the maximum penetration of SPSS in terms of usage.

Jon- SPSS, the company, has long been strong in Japan, and Taiwan, and Korea is also strong.  China is increasingly important, of course.  We have a large data center in Singapore.  Although India has a strong, long, history in statistical methodology, it is a much less well-developed market for us.  We have a presence there, but I don’t know the numbers. (Ajay – SPSS has been one of my first experiences in statistical software when I came up with it at my business school in 2001. In India SPSS has been very active with academia licensing and it introduced us to the nice and easy menu driven features of SPSS.)

Biography – Jon earned his Ph. D. from Yale University and taught econometrics and statistics there for 13 years before joining SPSS.

Jon joined the SPSS company in 1983 and worked on many aspects of the very first SPSS DOS product, including writing the first C code that SPSS ever shipped. Among the features he has designed are OMS (the Output Management System), the Visual Bander, Define Variable Properties, ALTER TYPE, Unicode support, and the Date and Time Wizard. Jon is the author of many of the modules on Developer Central. He is an active cyclist and hiker.

Jon Peck blogs on  SPSS Inside-Out.