A workshop on using R for Predictive Modeling, by the Director, Non Clinical Stats, Pfizer. Interesting Bay Area Event- part of next edition of Predictive Analytics World
Sunday, March 13, 2011 in San Francisco
R for Predictive Modeling:
A Hands-On Introduction
Intended Audience: Practitioners who wish to learn how to execute on predictive analytics by way of the R language; anyone who wants “to turn ideas into software, quickly and faithfully.”
Knowledge Level: Either hands-on experience with predictive modeling (without R) or hands-on familiarity with any programming language (other than R) is sufficient background and preparation to participate in this workshop.
Workshop Description
This one-day session provides a hands-on introduction to R, the well-known open-source platform for data analysis. Real examples are employed in order to methodically expose attendees to best practices driving R and its rich set of predictive modeling packages, providing hands-on experience and know-how. R is compared to other data analysis platforms, and common pitfalls in using R are addressed.
The instructor, a leading R developer and the creator of CARET, a core R package that streamlines the process for creating predictive models, will guide attendees on hands-on execution with R, covering:
A working knowledge of the R system
The strengths and limitations of the R language
Preparing data with R, including splitting, resampling and variable creation
Developing predictive models with R, including decision trees, support vector machines and ensemble methods
Visualization: Exploratory Data Analysis (EDA), and tools that persuade
Evaluating predictive models, including viewing lift curves, variable importance and avoiding overfitting
Hardware: Bring Your Own Laptop
Each workshop participant is required to bring their own laptop running Windows or OS X. The software used during this training program, R, is free and readily available for download.
Attendees receive an electronic copy of the course materials and related R code at the conclusion of the workshop.
Max Kuhn, Director, Nonclinical Statistics, Pfizer
Max Kuhn is a Director of Nonclinical Statistics at Pfizer Global R&D in Connecticut. He has been apply models in the pharmaceutical industries for over 15 years.
He is a leading R developer and the author of several R packages including the CARET package that provides a simple and consistent interface to over 100 predictive models available in R.
Mr. Kuhn has taught courses on modeling within Pfizer and externally, including a class for the India Ministry of Information Technology.
Additional features in R over other analytical packages-
1) Source Code is given to ensure complete custom solution and embedding for a particular application. Open source code has an advantage that is extensively peer- reviewed in Journals and Scientific Literature. This means bugs will found, shared and corrected transparently.
2) Wide literature of training material in the form of books is available for the R analytical platform.
3) Extensively the best data visualization tools in analytical software (apart from Tableau Software ‘s latest version). The extensive data visualization available in R is of the form a variety of customizable graphs, as well as animation. The principal reason third-party software initially started creating interfaces to R is because the graphical library of packages in R is more advanced as well as rapidly getting more features by the day.
4) Free in upfront license cost for academics and thus budget friendly for small and large analytical teams.
5) Flexible programming for your data environment. This includes having packages that ensure compatibility with Java, Python and C++.
6) Easy migration from other analytical platforms to R Platform. It is relatively easy for a non R platform user to migrate to R platform and there is no danger of vendor lock-in due to the GPL nature of source code and open community.
Statistics are numbers that tell (descriptive), advise ( prescriptive) or forecast (predictive). Analytics is a decision-making help tool. Analytics on which no decision is to be made or is being considered can be classified as purely statistical and non analytical. Thus ease of making a correct decision separates a good analytical platform from a not so good analytical platform. The distinction is likely to be disputed by people of either background- and business analysis requires more emphasis on how practical or actionable the results are and less emphasis on the statistical metrics in a particular data analysis task. I believe one clear reason between business analytics is different from statistical analysis is the cost of perfect information (data costs in real world) and the opportunity cost of delayed and distorted decision-making.
Specific to the following domains R has the following costs and benefits
Business Analytics
R is free per license and for download
It is one of the few analytical platforms that work on Mac OS
It’s results are credibly established in both journals like Journal of Statistical Software and in the work at LinkedIn, Google and Facebook’s analytical teams.
It has open source code for customization as per GPL
It also has a flexible option for commercial vendors like Revolution Analytics (who support 64 bit windows) as well as bigger datasets
It has interfaces from almost all other analytical software including SAS,SPSS, JMP, Oracle Data Mining, Rapid Miner. Existing license holders can thus invoke and use R from within these software
Huge library of packages for regression, time series, finance and modeling
High quality data visualization packages
Data Mining
R as a computing platform is better suited to the needs of data mining as it has a vast array of packages covering standard regression, decision trees, association rules, cluster analysis, machine learning, neural networks as well as exotic specialized algorithms like those based on chaos models.
Flexibility in tweaking a standard algorithm by seeing the source code
The RATTLE GUI remains the standard GUI for Data Miners using R. It was created and developed in Australia.
Business Dashboards and Reporting
Business Dashboards and Reporting are an essential piece of Business Intelligence and Decision making systems in organizations. R offers data visualization through GGPLOT, and GUI like Deducer and Red-R can help even non R users create a metrics dashboard
For online Dashboards- R has packages like RWeb, RServe and R Apache- which in combination with data visualization packages offer powerful dashboard capabilities.
R can be combined with MS Excel using the R Excel package – to enable R capabilities to be imported within Excel. Thus a MS Excel user with no knowledge of R can use the GUI within the R Excel plug-in to use powerful graphical and statistical capabilities.
Additional factors to consider in your R installation-
There are some more choices awaiting you now-
1) Licensing Choices-Academic Version or Free Version or Enterprise Version of R
2) Operating System Choices-Which Operating System to choose from? Unix, Windows or Mac OS.
3) Operating system sub choice- 32- bit or 64 bit.
4) Hardware choices-Cost -benefit trade-offs for additional hardware for R. Choices between local ,cluster and cloud computing.
5) Interface choices-Command Line versus GUI? Which GUI to choose as the default start-up option?
6) Software component choice- Which packages to install? There are almost 3000 packages, some of them are complimentary, some are dependent on each other, and almost all are free.
7) Additional Software choices- Which additional software do you need to achieve maximum accuracy, robustness and speed of computing- and how to use existing legacy software and hardware for best complementary results with R.
1) Licensing Choices-
You can choose between two kinds of R installations – one is free and open source from http://r-project.org The other R installation is commercial and is offered by many vendors including Revolution Analytics. However there are other commercial vendors too.
Windows remains the most widely used operating system on this planet. If you are experienced in Windows based computing and are active on analytical projects- it would not make sense for you to move to other operating systems. This is also based on the fact that compatibility problems are minimum for Microsoft Windows and the help is extensively documented. However there may be some R packages that would not function well under Windows- if that happens a multiple operating system is your next option.
Enterprise R from Revolution Analytics- Enterprise R from Revolution Analytics has a complete R Development environment for Windows including the use of code snippets to make programming faster. Revolution is also expected to make a GUI available by 2011. Revolution Analytics claims several enhancements for it’s version of R including the use of optimized libraries for faster performance.
MacOS
Reasons for choosing MacOS remains its considerable appeal in aesthetically designed software- but MacOS is not a standard Operating system for enterprise systems as well as statistical computing. However open source R claims to be quite optimized and it can be used for existing Mac users. However there seem to be no commercially available versions of R available as of now for this operating system.
Linux
Ubuntu
Red Hat Enterprise Linux
Other versions of Linux
Linux is considered a preferred operating system by R users due to it having the same open source credentials-much better fit for all R packages and it’s customizability for big data analytics.
Ubuntu Linux is recommended for people making the transition to Linux for the first time. Ubuntu Linux had an marketing agreement with revolution Analytics for an earlier version of Ubuntu- and many R packages can installed in a straightforward way as Ubuntu/Debian packages are available. Red Hat Enterprise Linux is officially supported by Revolution Analytics for it’s enterprise module. Other versions of Linux popular are Open SUSE.
Multiple operating systems-
Virtualization vs Dual Boot-
You can also choose between having a VMware VM Player for a virtual partition on your computers that is dedicated to R based computing or having operating system choice at the startup or booting of your computer. A software program called wubi helps with the dual installation of Linux and Windows.
64 bit vs 32 bit – Given a choice between 32 bit versus 64 bit versions of the same operating system like Linux Ubuntu, the 64 bit version would speed up processing by an approximate factor of 2. However you need to check whether your current hardware can support 64 bit operating systems and if so- you may want to ask your Information Technology manager to upgrade atleast some operating systems in your analytics work environment to 64 bit operating systems.
Hardware choices- At the time of writing this book, the dominant computing paradigm is workstation computing followed by server-client computing. However with the introduction of cloud computing, netbooks, tablet PCs, hardware choices are much more flexible in 2011 than just a couple of years back.
Hardware costs are a significant cost to an analytics environment and are also remarkably depreciated over a short period of time. You may thus examine your legacy hardware, and your future analytical computing needs- and accordingly decide between the various hardware options available for R.
Unlike other analytical software which can charge by number of processors, or server pricing being higher than workstation pricing and grid computing pricing extremely high if available- R is well suited for all kinds of hardware environment with flexible costs. Given the fact that R is memory intensive (it limits the size of data analyzed to the RAM size of the machine unless special formats and /or chunking is used)- it depends on size of datasets used and number of concurrent users analyzing the dataset. Thus the defining issue is not R but size of the data being analyzed.
Local Computing- This is meant to denote when the software is installed locally. For big data the data to be analyzed would be stored in the form of databases.
Server version- Revolution Analytics has differential pricing for server -client versions but for the open source version it is free and the same for Server or Workstation versions.
Workstation
Cloud Computing- Cloud computing is defined as the delivery of data, processing, systems via remote computers. It is similar to server-client computing but the remote server (also called cloud) has flexible computing in terms of number of processors, memory, and data storage. Cloud computing in the form of public cloud enables people to do analytical tasks on massive datasets without investing in permanent hardware or software as most public clouds are priced on pay per usage. The biggest cloud computing provider is Amazon and many other vendors provide services on top of it. Google is also coming for data storage in the form of clouds (Google Storage), as well as using machine learning in the form of API (Google Prediction API)
Amazon
Google
Cluster-Grid Computing/Parallel processing- In order to build a cluster, you would need the RMpi and the SNOW packages, among other packages that help with parallel processing.
How much resources
RAM-Hard Disk-Processors- for workstation computing
Instances or API calls for cloud computing
Interface Choices
Command Line
GUI
Web Interfaces
Software Component Choices
R dependencies
Packages to install
Recommended Packages
Additional software choices
Additional legacy software
Optimizing your R based computing
Code Editors
Code Analyzers
Libraries to speed up R
citation- R Development Core Team (2010). R: A language and environment for statistical computing. R Foundation for Statistical Computing,Vienna, Austria. ISBN 3-900051-07-0, URL http://www.R-project.org.
The term quantitative refers to a type of information based in quantities or else quantifiable data (objective properties) —as opposed to qualitative information which deals with apparent qualities (subjective properties)
Fear, uncertainty, and doubt (FUD) is a tactic of rhetoric and fallacy used in sales, marketing, public relations,[1][2]politics and propaganda. FUD is generally a strategic attempt to influence public perception by disseminating negative and dubious/false information designed to undermine the credibility of their beliefs.
Tal G, creator of the rbloggers.com website, has created a new blog aggregator for SAS language users at http://sas-x.com/
With almost 26 blogs joining there (I suspect many more should join , it seems like a good website to use for analytics users and students. My favorite SAS Blog is http://statcompute.spaces.live.com/ – its pure code- little anything else.
Ubuntu has a slight glitch plus workaround for installing the RCurl package on which the Google Prediction API is dependent- you need to first install this Ubuntu package for RCurl to install libcurl4-gnutls-dev
Once you install that using Synaptic,
Simply start R
2) Install Packages rjson and Rcurl using install.packages and choosing CRAN
6) Uploading data to Google Storage using the GUI (rather than gs util)
Just go to https://sandbox.google.com/storage/
and thats the Google Storage manager
Notes on Training Data-
Use a csv file
The first column is the score column (like 1,0 or prediction score)
There are no headers- so delete headers from data file and move the dependent variable to the first column (Note I used data from the kaggle contest for R package recommendation at
Once you type in the basic syntax, the first time it will ask for your Google Credentials (email and password)
It then starts showing you time elapsed for training.
Now you can disconnect and go off (actually I got disconnected by accident before coming back in a say 5 minutes so this is the part where I think this is what happened is why it happened, dont blame me, test it for yourself) –
and when you come back (hopefully before token expires) you can see status of your request (see below)
> library(rjson)
> library(RCurl)
Loading required package: bitops
> library(googlepredictionapi)
> my.model <- PredictionApiTrain(data="gs://numtraindata/training_data")
The request for training has sent, now trying to check if training is completed
Training on numtraindata/training_data: time:2.09 seconds
Training on numtraindata/training_data: time:7.00 seconds
7)
Note I changed the format from the URL where my data is located- simply go to your Google Storage Manager and right click on the file name for link address ( https://sandbox.google.com/storage/numtraindata/training_data.csv)
to gs://numtraindata/training_data (that kind of helps in any syntax error)
## Load googlepredictionapi and dependent libraries
library(rjson)
library(RCurl)
library(googlepredictionapi)

## Make a training call to the Prediction API against data in the Google Storage.
## Replace MYBUCKET and MYDATA with your data.
my.model <- PredictionApiTrain(data="gs://MYBUCKET/MYDATA")

## Alternatively, make a training call against training data stored locally as a CSV file.
## Replace MYPATH and MYFILE with your data.
my.model <- PredictionApiTrain(data="MYPATH/MYFILE.csv")
At the time of writing my data was still getting trained, so I will keep you posted on what happens.
Tableau which has been making waves recntly with its great new data visualization tool announced a partner with my old friends at AsterData. Its really cool piece of data vis and very very fast on the desktop- so I can imagine what speed it can help with AsterData’s MPP Row and Column Zingbang AND Parallel Analytical Functions
Tableau and AsterData also share the common Stanfordian connection (but it seems software is divided quite equally between Stanford, Hardvard Dropouts and North Carolina )
It remains to be seen in this announcement how much each company can leverage the partnership or whether it turns like the SAS Institute- AsterData partnership last year or whether it is just to announce connectors in their software to talk to each other.
AsterData remains the guys with the potential but I would be wrong to say MapReduce–SQL is as hot in December 2010 as it was in June 2009- and the elephant in the room would be Hadoop. That and Google’s continued shyness from encashing its principal comptency of handling Big Data (but hush – I signed a NDA with the Google Prediction API– so things maaaay change very rapidly on ahem that cloud)
Disclaimer- AsterData was my internship sponsor during my winter training while at Univ of Tenn.
Using WP- Stats I set about answering this question-
What search keywords lead here-
Clearly Michael Jackson is down this year
And R GUI, Data Mining is up.
How does that affect my writing- given I get almost 250 visitors by search engines alone daily- assume I write nothing on this blog from now on.
It doesnt- I still write what ever code or poem that comes to my mind. So it is hurtful people misunderstimate the effort in writing and jump to conclusions (esp if I write about a company- I am not on payroll of that company- just like if I write about a poem- I am not a full time poet)
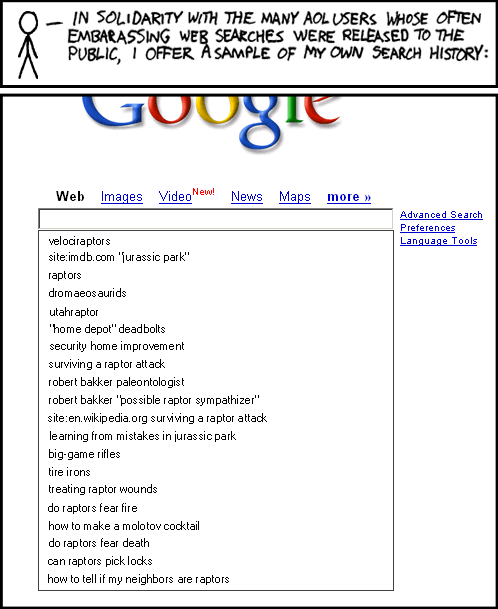
Over to xkcd
All Time (for Decisionstats.Wordpress.com)
Search
Views
libre office
818
facebook analytics
806
michael jackson history
240
wps sas lawsuit
180
r gui
168
wps sas
154
wordle.net
118
sas wps
116
decision stats
110
sas wps lawsuit
100
google maps jet ski
94
data mining
88
doug savage
72
hive tutorial
63
spss certification
63
hadley wickham
63
google maps jetski
62
sas sues wps
60
decisionstats
58
donald farmer microsoft
45
libreoffice
44
wps statistics
44
best statistics software
42
r gui ubuntu
41
rstat
37
tamilnadu advanced technical training institute tatti