I had actually unsub’ed from his feed. Now I know why. How you’re doing with the Yahoo Pipes app?
Methinks he has some sort of clinical compulsive condition given how every single post has to include a reference that his facvourite software company from NC, and/or members of their management team.
ha! yeah that would be good signaling. Not sure how common it is, but I use it mostly for spam bots. I actually have only blocked 2 warm blooded humans (counting Ajay’s multiple accts as one person)
Here is an interview with James Dixon the founder of Pentaho, self confessed Chief Geek and CTO. Pentaho has been growing very rapidly and it makes open source Business Intelligence solutions- basically the biggest chunk of enterprise software market currently.
Ajay- How would you describe Pentaho as a BI product for someone who is completely used to traditional BI vendors (read non open source). Do the Oracle lawsuits over Java bother you from a business perspective?
The Oracle/Java issue does not bother me much. There are a lot of software companies dependent on Java. If Oracle abandons Java a lot resources will suddenly focus on OpenJDK. It would be good for OpenJDK and might be the best thing for Java in the long term.
Ajay- What parts of Pentaho’s technology do you personally like the best as having an advantage over other similar proprietary packages.
Describe the latest Pentaho for Hadoop offering and Hadoop/HIVE ‘s advantage over say Map Reduce and SQL.
James- The coolest thing is that everything is pluggable:
* ETL: New data transformation steps can be added. New orchestration controls (job entries) can be added. New perspectives can be added to the design UI. New data sources and destinations can be added.
* Reporting: New content types and report objects can be added. New data sources can be added.
* BI Server: Every factory, engine, and layer can be extended or swapped out via configuration. BI components can be added. New visualizations can be added.
This means it is very easy for Pentaho, partners, customers, and community member to extend our software to do new things.
In addition every engine and component can be fully embedded into a desktop or web-based application. I made a youtube video about our philosophy: http://www.youtube.com/watch?v=uMyR-In5nKE
Our Hadoop offerings allow ETL developers to work in a familiar graphical design environment, instead of having to code MapReduce jobs in Java or Python.
90% of the Hadoop use cases we hear about are transformation/reporting/analysis of structured/semi-structured data, so an ETL tool is perfect for these situations.
Using Pentaho Data Integration reduces implementation and maintenance costs significantly. The fact that our ETL engine is Java and is embeddable means that we can deploy the engine to the Hadoop data nodes and transform the data within the nodes.
Ajay- Do you think the combination of recession, outsourcing,cost cutting, and unemployment are a suitable environment for companies to cut technology costs by going out of their usual vendor lists and try open source for a change /test projects.
Jamie- Absolutely. Pentaho grew (downloads, installations, revenue) throughout the recession. We are on target to do 250% of what we did last year, while the established vendors are flat in terms of new license revenue.
Ajay- How would you compare the user interface of reports using Pentaho versus other reporting software. Please feel free to be as specific.
James- We have all of the everyday, standard reporting features covered.
Over the years the old tools, like Crystal Reports, have become bloated and complicated.
We don’t aim to have 100% of their features, because we’d end us just as complicated.
The 80:20 rule applies here. 80% of the time people only use 20% of their features.
We aim for 80% feature parity, which should cover 95-99% of typical use cases.
Ajay- Could you describe the Pentaho integration with R as well as your relationship with Weka. Jaspersoft already has a partnership with Revolution Analytics for RevoDeployR (R on a web server)-
Any R plans for Pentaho as well?
James- The feature set of R and Weka overlap to a small extent – both of them include basic statistical functions. Weka is focused on predictive models and machine learning, whereas R is focused on a full suite of statistical models. The creator and main Weka developer is a Pentaho employee. We have integrated R into our ETL tool. (makes me happy 🙂 )
(probably not a good time to ask if SAS integration is done as well for a big chunk of legacy base SAS/ WPS users)
About-
As “Chief Geek” (CTO) at Pentaho, James Dixon is responsible for Pentaho’s architecture and technology roadmap. James has over 15 years of professional experience in software architecture, development and systems consulting. Prior to Pentaho, James held key technical roles at AppSource Corporation (acquired by Arbor Software which later merged into Hyperion Solutions) and Keyola (acquired by Lawson Software). Earlier in his career, James was a technology consultant working with large and small firms to deliver the benefits of innovative technology in real-world environments.
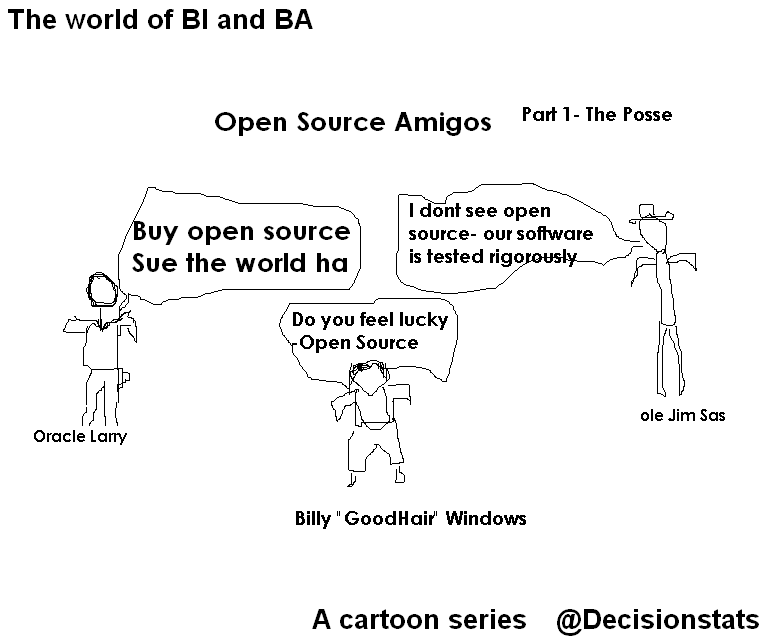
Ok I promised a weekly cartoon on Friday but it’s Saturday. Last week we spoofed Larry Ellison , Jim Goodnight and Bill Gates– people who created billions of taxes for the economy but would be regarded as evil by some open source guys- though they may have created more jobs for more families than the whole Federal Reserve Bank did in 2008-10. Jobs are necessary for families. Period.
In Part 2- we see Open Source is actually older than Stallman (yes people are older than Stallman) – in fact open source has been around for far more time than even
Jim Goodnight’s current age- which can be revealed by using proc goodnight options=all.
(note – it would be interesting to do a proc freq on all procs say used say on SAS On Demand)
Any thing else is not needed for a entry level job for a fresh grad student or job for a veteran re-trained worker.
Just like society needs science and commerce as twin pillars, analytics needs SAS (great Marketing) and R (great research) for expanding the pie of analytics which is woefully underutilized and stupidly overcapitalized by jazzy-copy-paste-data-from-query- software disguised as “intelligent software”. R has no certification and no formal training for jobs (as yet) though this should change. SAS looks great (still) for getting jobs for grad students. R looks great (yup) for getting research jobs probably not corporate analytics jobs ?What do you think?
Here is a short list of resources and material I put together as starting points for R and Cloud Computing It’s a bit messy but overall should serve quite comprehensively.
Cloud computing is a commonly used expression to imply a generational change in computing from desktop-servers to remote and massive computing connections,shared computers, enabled by high bandwidth across the internet.
As per the National Institute of Standards and Technology Definition,
Cloud computing is a model for enabling convenient, on-demand network access to a shared pool of configurable computing resources (e.g., networks, servers, storage, applications, and services) that can be rapidly provisioned and released with minimal management effort or service provider interaction.
Rweb is developed and maintained by Jeff Banfield. The Rweb Home Page provides access to all three versions of Rweb—a simple text entry form that returns output and graphs, a more sophisticated JavaScript version that provides a multiple window environment, and a set of point and click modules that are useful for introductory statistics courses and require no knowledge of the R language. All of the Rweb versions can analyze Web accessible datasets if a URL is provided.
The paper “Rweb: Web-based Statistical Analysis”, providing a detailed explanation of the different versions of Rweb and an overview of how Rweb works, was published in the Journal of Statistical Software (http://www.jstatsoft.org/v04/i01/).
Ulf Bartel has developed R-Online, a simple on-line programming environment for R which intends to make the first steps in statistical programming with R (especially with time series) as easy as possible. There is no need for a local installation since the only requirement for the user is a JavaScript capable browser. See http://osvisions.com/r-online/ for more information.
Rcgi is a CGI WWW interface to R by MJ Ray. It had the ability to use “embedded code”: you could mix user input and code, allowing the HTMLauthor to do anything from load in data sets to enter most of the commands for users without writing CGI scripts. Graphical output was possible in PostScript or GIF formats and the executed code was presented to the user for revision. However, it is not clear if the project is still active.
Currently, a modified version of Rcgi by Mai Zhou (actually, two versions: one with (bitmap) graphics and one without) as well as the original code are available from http://www.ms.uky.edu/~statweb/.
David Firth has written CGIwithR, an R add-on package available from CRAN. It provides some simple extensions to R to facilitate running R scripts through the CGI interface to a web server, and allows submission of data using both GET and POST methods. It is easily installed using Apache under Linux and in principle should run on any platform that supports R and a web server provided that the installer has the necessary security permissions. David’s paper “CGIwithR: Facilities for Processing Web Forms Using R” was published in the Journal of Statistical Software (http://www.jstatsoft.org/v08/i10/). The package is now maintained by Duncan Temple Lang and has a web page athttp://www.omegahat.org/CGIwithR/.
Rpad, developed and actively maintained by Tom Short, provides a sophisticated environment which combines some of the features of the previous approaches with quite a bit of JavaScript, allowing for a GUI-like behavior (with sortable tables, clickable graphics, editable output), etc.
Jeff Horner is working on the R/Apache Integration Project which embeds the R interpreter inside Apache 2 (and beyond). A tutorial and presentation are available from the project web page at http://biostat.mc.vanderbilt.edu/twiki/bin/view/Main/RApacheProject.
Rserve is a project actively developed by Simon Urbanek. It implements a TCP/IP server which allows other programs to use facilities of R. Clients are available from the web site for Java and C++ (and could be written for other languages that support TCP/IP sockets).
OpenStatServer is being developed by a team lead by Greg Warnes; it aims “to provide clean access to computational modules defined in a variety of computational environments (R, SAS, Matlab, etc) via a single well-defined client interface” and to turn computational services into web services.
Two projects use PHP to provide a web interface to R. R_PHP_Online by Steve Chen (though it is unclear if this project is still active) is somewhat similar to the above Rcgi and Rweb. R-php is actively developed by Alfredo Pontillo and Angelo Mineo and provides both a web interface to R and a set of pre-specified analyses that need no R code input.
webbioc is “an integrated web interface for doing microarray analysis using several of the Bioconductor packages” and is designed to be installed at local sites as a shared computing resource.
Rwui is a web application to create user-friendly web interfaces for R scripts. All code for the web interface is created automatically. There is no need for the user to do any extra scripting or learn any new scripting techniques. Rwui can also be found at http://rwui.cryst.bbk.ac.uk.
Finally, the R.rsp package by Henrik Bengtsson introduces “R Server Pages”. Analogous to Java Server Pages, an R server page is typically HTMLwith embedded R code that gets evaluated when the page is requested. The package includes an internal cross-platform HTTP server implemented in Tcl, so provides a good framework for including web-based user interfaces in packages. The approach is similar to the use of the brew package withRapache with the advantage of cross-platform support and easy installation.
Remote access to R/Bioconductor on EBI’s 64-bit Linux Cluster
Start the workbench by downloading the package for your operating system (Macintosh or Windows), or via Java Web Start, and you will get access to an instance of R running on one of EBI’s powerful machines. You can install additional packages, upload your own data, work with graphics and collaborate with colleagues, all as if you are running R locally, but unlimited by your machine’s memory, processor or data storage capacity.
Most up-to-date R version built for multicore CPUs
Access to all Bioconductor packages
Access to our computing infrastructure
Fast access to data stored in EBI’s repositories (e.g., public microarray data in ArrayExpress)
Using R Google Docs http://www.omegahat.org/RGoogleDocs/run.pdf
It uses the XML and RCurl packages and illustrates that it is relatively quick and easy
to use their primitives to interact with Web services.
Amazon’s EC2 is a type of cloud that provides on demand computing infrastructures called an Amazon Machine Images or AMIs. In general, these types of cloud provide several benefits:
Simple and convenient to use. An AMI contains your applications, libraries, data and all associated configuration settings. You simply access it. You don’t need to configure it. This applies not only to applications like R, but also can include any third-party data that you require.
On-demand availability. AMIs are available over the Internet whenever you need them. You can configure the AMIs yourself without involving the service provider. You don’t need to order any hardware and set it up.
Elastic access. With elastic access, you can rapidly provision and access the additional resources you need. Again, no human intervention from the service provider is required. This type of elastic capacity can be used to handle surge requirements when you might need many machines for a short time in order to complete a computation.
Pay per use. The cost of 1 AMI for 100 hours and 100 AMI for 1 hour is the same. With pay per use pricing, which is sometimes called utility pricing, you simply pay for the resources that you use.
#This example requires you had previously created a bucket named data_language on your Google Storage and you had uploaded a CSV file named language_id.txt (your data) into this bucket – see for details
library(predictionapirwrapper)
Elastic-R is a new portal built using the Biocep-R platform. It enables statisticians, computational scientists, financial analysts, educators and students to use cloud resources seamlessly; to work with R engines and use their full capabilities from within simple browsers; to collaborate, share and reuse functions, algorithms, user interfaces, R sessions, servers; and to perform elastic distributed computing with any number of virtual machines to solve computationally intensive problems.
Also see Karim Chine’s http://biocep-distrib.r-forge.r-project.org/
R for Salesforce.com
At the point of writing this, there seem to be zero R based apps on Salesforce.com This could be a big opportunity for developers as both Apex and R have similar structures Developers could write free code in R and charge for their translated version in Apex on Salesforce.com
Force.com and Salesforce have many (1009) apps at http://sites.force.com/appexchange/home for cloud computing for
businesses, but very few forecasting and statistical simulation apps.
These are like iPhone apps except meant for business purposes (I am
unaware if any university is offering salesforce.com integration
though google apps and amazon related research seems to be on)
Personal Note-Mentioning SAS in an email to a R list is a big no-no in terms of getting a response and love. Same for being careless about which R help list to email (like R devel or R packages or R help)
Tableau was named by Software Magazine as the fastest growing software company in the $10 million to $30 million range in the world, and the second fastest growing software company worldwide overall. The ranking stems from the publication’s 28th annual Software 500 ranking of the world’s largest software service providers.
“We’re growing fast because the market is starving for easy-to-use products that deliver rapid-fire business intelligence to everyone. Our customers want ways to unlock their databases and produce engaging reports and dashboards,” said Christian Chabot CEO and co-founder of Tableau.
Put together an Academy-Award winning professor from the nation’s most prestigious university, a savvy business leader with a passion for data, and a brilliant computer scientist. Add in one of the most challenging problems in software – making databases and spreadsheets understandable to ordinary people. You have just recreated the fundamental ingredients for Tableau.
The catalyst? A Department of Defense (DOD) project aimed at increasing people’s ability to analyze information and brought to famed Stanford professor, Pat Hanrahan. A founding member of Pixar and later its chief architect for RenderMan, Pat invented the technology that changed the world of animated film. If you know Buzz and Woody of “Toy Story”, you have Pat to thank.
Under Pat’s leadership, a team of Stanford Ph.D.s got together just down the hall from the Google folks. Pat and Chris Stolte, the brilliant computer scientist, realized that data visualization could produce large gains in people’s ability to understand information. Rather than analyzing data in text form and then creating visualizations of those findings, Pat and Chris invented a technology called VizQL™ by which visualization is part of the journey and not just the destination. Fast analytics and visualization for everyone was born.
While satisfying the DOD project, Pat and Chris met Christian Chabot, a former data analyst who turned into Jello when he saw what had been invented. The three formed a company and spun out of Stanford like so many before them (Yahoo, Google, VMWare, SUN). With Christian on board as CEO, Tableau rapidly hit one success after another: its first customer (now Tableau’s VP, Operations, Tom Walker), an OEM deal with Hyperion (now Oracle), funding from New Enterprise Associates, a PC Magazine award for “Product of the Year” just one year after launch, and now over 50,000 people in 50+ countries benefiting from the breakthrough.
and now a demo I ran on the Kaggle contest data (it is a csv dataset with 95000 rows)
I found Tableau works extremely good at pivoting data and visualizing it -almost like Excel on Steroids. Download the free version here ( I dont know about an academic program (see links below) but software is not expensive at all)
The Professional Edition is a visual analysis and reporting solution for data stored in MS SQL Server, MS Analysis Services, Oracle, IBM DB2, Netezza, Hyperion Essbase, Teradata, Vertica, MySQL, PostgreSQL, Firebird, Excel, MS Access or Text Files. Available via download.
Tableau Server enables users of Tableau Desktop Professional to publish workbooks and visualizations to a server where users with web browsers can access and interact with the results. Available via download.
* Price is per Named User and includes one year of maintenance (upgrades and support). Products are made available as a download immediately after purchase. You may revisit the download site at any time during your current maintenance period to access the latest releases.


 - Rotating ...")


