Some ways to test and use cloud computing for free for yourself-
- Windows Azure
- Amazon Ec2
- Google Storage
The folks at Microsoft Azure announced a 90 day free trial Continue reading “Cloud Computing by Windows , Amazon and Google for free”

Some ways to test and use cloud computing for free for yourself-
The folks at Microsoft Azure announced a 90 day free trial Continue reading “Cloud Computing by Windows , Amazon and Google for free”
Here is an interview with Mike Boyarski , Director Product Marketing at Jaspersoft
.
the largest BI community with over 14 million downloads, nearly 230,000 registered members, representing over 175,000 production deployments, 14,000 customers, across 100 countries.

Here is an excellent example of how websites should help rather than hinder new customers take a demo of the software without being overwhelmed by sweet talking marketing guys who dont know the difference between heteroskedasticity, probability, odds and likelihood.
It is made by Zementis (Dr Michael Zeller has been a frequent guest here) and Revolution Analytics is still the best shot in Enterprise software for #Rstats
Now if only Revo could get into the lucrative Department of Energy or Department of Defense business- they could change the world AND earn some more revenue than they have been doing. But seriously.
Check out http://deployr.revolutionanalytics.com/zementis/ and play with it. or better still mash it with some data viz and ROC curves.- or extend it with some APIS 😉


Okay, through the weekend I created a website for a few of my favourite things.
It’s on at https://rforanalytics.wordpress.com/

I dont trust anyone not using atleast one R GUI. Here’s a list of the top 10.
Here is a list of top 5 code enhancers,editors in R
A list of companies and software making (and) selling R software (and) services. Hint- it is almost 5 (unless I missed someone)
R’s famous graphing capabilities and equally famous learning curve can be made a bit more humane- using some of these resources.
Because that’s what I do (all I do as per my cat) , and I am pretty good at it.
R can be used successfully from a lot of analytical software including some surprising ones praising the great 3000 packages library.
(to be continued- as I find more stuff I will keep it there, some ideas- database access from R, prominent R consultants, prominent R packages, famous R interviewees 😉 )
ps- The quote from Jerry Rubin seems funny for a while. I turn 34 this year.

http://www.libreoffice.org/features/
WRITER is the word processor inside LibreOffice. Use it for everything, from dashing off a quick letter to producing an entire book with tables of contents, embedded illustrations, bibliographies and diagrams. The while-you-type auto-completion, auto-formatting and automatic spelling checking make difficult tasks easy (but are easy to disable if you prefer). Writer is powerful enough to tackle desktop publishing tasks such as creating multi-column newsletters and brochures. The only limit is your imagination.
CALC tames your numbers and helps with difficult decisions when you’re weighing the alternatives. Analyze your data with Calc and then use it to present your final output. Charts and analysis tools help bring transparency to your conclusions. A fully-integrated help system makes easier work of entering complex formulas. Add data from external databases such as SQL or Oracle, then sort and filter them to produce statistical analyses. Use the graphing functions to display large number of 2D and 3D graphics from 13 categories, including line, area, bar, pie, X-Y, and net – with the dozens of variations available, you’re sure to find one that suits your project.
IMPRESS is the fastest and easiest way to create effective multimedia presentations. Stunning animation and sensational special effects help you convince your audience. Create presentations that look even more professional than the standard presentations you commonly see at work. Get your collegues’ and bosses’ attention by creating something a little bit different.
DRAW lets you build diagrams and sketches from scratch. A picture is worth a thousand words, so why not try something simple with box and line diagrams? Or else go further and easily build dynamic 3D illustrations and special effects. It’s as simple or as powerful as you want it to be.
BASE is the database front-end of the LibreOffice suite. With Base, you can seamlessly integrate into your existing database structures. Based on imported and linked tables and queries from MySQL, PostgreSQL or Microsoft Access and many other data sources, you can build powerful databases containing forms, reports, views and queries. Full integration is possible with the in-built HSQL database.
MATH is a simple equation editor that lets you lay-out and display your mathematical, chemical, electrical or scientific equations quickly in standard written notation. Even the most-complex calculations can be understandable when displayed correctly. E=mc2
Open Documentation just announced release candidate 3 of Libre office.
New Features-
http://www.libreoffice.org/download/new-features/


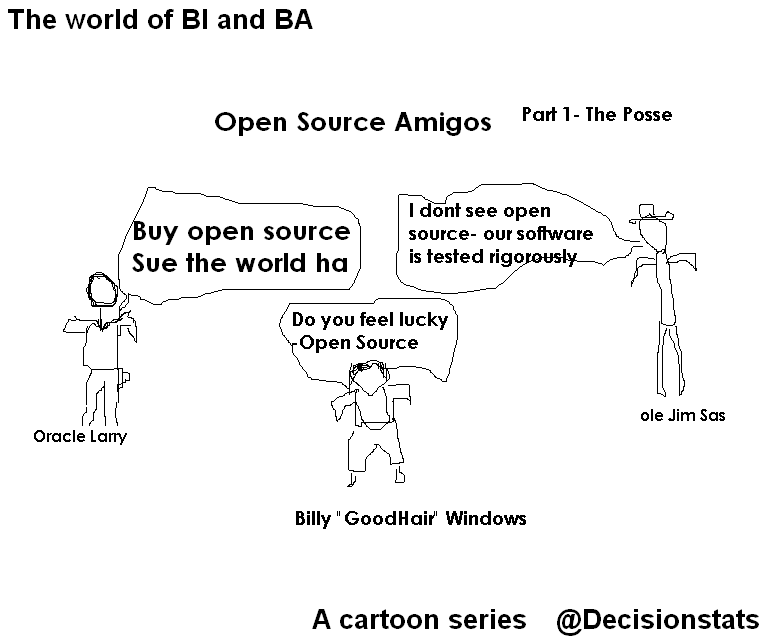
Ok I promised a weekly cartoon on Friday but it’s Saturday.
Last week we spoofed Larry Ellison , Jim Goodnight and Bill Gates– people who created billions of taxes for the economy but would be regarded as evil by some open source guys- though they may have created more jobs for more families than the whole Federal Reserve Bank did in 2008-10. Jobs are necessary for families. Period.
You can review it here https://decisionstats.com/wp-content/uploads/2010/11/os1.png
In Part 2- we see Open Source is actually older than Stallman (yes people are older than Stallman) – in fact open source has been around for far more time than even
Jim Goodnight’s current age- which can be revealed by using proc goodnight options=all.


If you use Windows for your stats computing and your data is in a database (probably true for almost all corporate business analysts) R 2.12 has provided a unique procedural hitch for you NO BINARIES for packages used till now to read from these databases.
The Readme notes of the release say-
Packages related to many database system must be linked to the exact
version of the database system the user has installed, hence it does
not make sense to provide binaries for packages
	RMySQL, ROracle, ROracleUI, RPostgreSQL
although it is possible to install such packages from sources by
	install.packages('packagename', type='source')
after reading the manual 'R Installation and Administration'.
So how to connect to Databases if the Windows Binary is not available-
So how to connect to PostgreSQL and MySQL databases.
For Postgres databases-
You can update your PostgreSQL databases here-
http://www.postgresql.org/download/windows
Fortunately the RpgSQL package is still available for PostgreSQL
library(RpgSQL)

#creating a connection
con <- dbConnect(pgSQL(), user = "postgres", password = "XXXX",dbname="postgres")

#writing a table from a R Dataset
dbWriteTable(con, "BOD", BOD)

# table names are lower cased unless double quoted. Here we write a Select SQL query
dbGetQuery(con, 'select * from "BOD"')

#disconnecting the connection
dbDisconnect(con)
You can also use RODBC package for connecting to your PostgreSQL database but you need to configure your ODBC connections in
Windows Start Panel-
Settings-Control Panel-
Administrative Tools-Data Sources (ODBC)
You should probably see something like this screenshot.

Coming back to R and noting the name of my PostgreSQL DSN from above screenshot-( If not there just click on add-scroll to appropriate database -here PostgreSQL and click on Finish- add in the default values for your database or your own created database values-see screenshot for help with other configuring- and remember to click Test below to check if username and password are working, port is correct etc.

so once the DSN is probably setup in the ODBC (frightening terminology is part of databases)- you can go to R to connect using RODBC package
#loading RODBC

library(RODBC)

#creating a Database connection
# for username,password,database name and DSN name

chan=odbcConnect("PostgreSQL35W","postgres;Password=X;Database=postgres")

#to list all table names

sqlTables(chan)
TABLE_QUALIFIER TABLE_OWNER TABLE_NAME TABLE_TYPE REMARKS
1       postgres      public        bod      TABLE
 2        postgres      public  database1      TABLE
 3        postgres      public         tt      TABLE
Now for MySQL databases it is exactly the same code except we download and install the ODBC driver from http://www.mysql.com/downloads/connector/odbc/
and then we run the same configuring DSN as we did for postgreSQL.
After that we use RODBC in pretty much the same way except changing for the default username and password for MySQL and changing the DSN name for the previous step.
channel <- odbcConnect("mysql","jasperdb;Password=XXX;Database=Test")
test2=sqlQuery(channel,"select * from jiuser")
test2
 id  username tenantId   fullname emailAddress  password externallyDefined enabled previousPasswordChangeTime1  1   jasperadmin        1 Jasper Administrator           NA 349AFAADD5C5A2BD477309618DC              NA    01
2  2       joe1ser        1             Joe User           NA                 4DD8128D07A               NA    01
odbcClose(channel)While using RODBC for all databases is a welcome step, perhaps the change release notes for Window Users of R may need to be more substantiative than one given for R 2.12.2
