Complex Event Processing- SASE Language

Logo of the anti-RFID campaign by German priva...
Image via Wikipedia

Complex Event Processing (CEP- not to be confused by Circular Probability Error) is defined processing many events happening across all the layers of an organization, identifying the most meaningful events within the event cloud, analyzing their impact, and taking subsequent action in real time.

Software supporting CEP are-

Oracle http://www.oracle.com/us/technologies/soa/service-oriented-architecture-066455.html

Oracle CEP is a Java application server for the development and deployment of high-performance event driven applications. It can detect patterns in the flow of events and message payloads, often based on filtering, correlation, and aggregation across event sources, and includes industry leading temporal and ordering capabilities. It supports ultra-high throughput (1 million/sec++) and microsecond latency.

Tibco is also trying to get into this market (it claims to have a 40 % market share in the public CEP market 😉 though probably they have not measured the DoE and DoD as worthy of market share yet

– see webcast by TIBCO ‘s head here http://www.tibco.com/products/business-optimization/complex-event-processing/default.jsp

and product info here-http://www.tibco.com/products/business-optimization/complex-event-processing/businessevents/default.jsp

TIBCO is the undisputed leader in complex event processing (CEP) software with over 40 percent market share, according to a recent IDC Study.

A good explanation of how social media itself can be used as an analogy for CEP is given in this SAS Global Paper

http://support.sas.com/resources/papers/proceedings10/040-2010.pdf

You can see a report on Predictive Analytics and Data Mining  in q1 2010 also from SAS’s website  at –http://www.sas.com/news/analysts/forresterwave-predictive-analytics-dm-104388-0210.pdf

A very good explanation on architecture involved is given by SAS CTO Keith Collins here on SAS’s Knowledge Exchange site,

http://www.sas.com/knowledge-exchange/risk/four-ways-divide-conquer.html

What it is: Methods 1 through 3 look at historical data and traditional architectures with information stored in the warehouse. In this environment, it often takes months of data cleansing and preparation to get the data ready to analyze. Now, what if you want to make a decision or determine the effect of an action in real time, as a sale is made, for instance, or at a specific step in the manufacturing process. With streaming data architectures, you can look at data in the present and make immediate decisions. The larger flood of data coming from smart phones, online transactions and smart-grid houses will continue to increase the amount of data that you might want to analyze but not keep. Real-time streaming, complex event processing (CEP) and analytics will all come together here to let you decide on the fly which data is worth keeping and which data to analyze in real time and then discard.

When you use it: Radio-frequency identification (RFID) offers a good user case for this type of architecture. RFID tags provide a lot of information, but unless the state of the item changes, you don’t need to keep warehousing the data about that object every day. You only keep data when it moves through the door and out of the warehouse.

The same concept applies to a customer who does the same thing over and over. You don’t need to keep storing data for analysis on a regular pattern, but if they change that pattern, you might want to start paying attention.

Figure  4: Traditional architecture vs. streaming architecture

Figure 4: Traditional architecture vs. streaming architecture


In academia  here is something called SASE Language

  • A rich declarative event language
  • Formal semantics of the event language
  • Theorectical underpinnings of CEP
  • An efficient automata-based implementation

http://sase.cs.umass.edu/

and

http://avid.cs.umass.edu/sase/index.php?page=navleft_1col

Financial Services

The query below retrieves the total trading volume of Google stocks in the 4 hour period after some bad news occurred.

PATTERN SEQ(News a, Stock+ b[ ])WHERE   [symbol]    AND	a.type = 'bad'    AND	b[i].symbol = 'GOOG' WITHIN  4 hoursHAVING  b[b.LEN].volume < 80%*b[1].volumeRETURN  sum(b[ ].volume)

The next query reports a one-hour period in which the price of a stock increased from 10 to 20 and its trading volume stayed relatively stable.

PATTERN	SEQ(Stock+ a[])WHERE 	 [symbol]   AND	  a[1].price = 10   AND	  a[i].price > a[i-1].price   AND	  a[a.LEN].price = 20            WITHIN  1 hourHAVING	avg(a[].volume) ≥ a[1].volumeRETURN	a[1].symbol, a[].price

The third query detects a more complex trend: in an hour, the volume of a stock started high, but after a period of price increasing or staying relatively stable, the volume plummeted.

PATTERN SEQ(Stock+ a[], Stock b)WHERE 	 [symbol]   AND	  a[1].volume > 1000   AND	  a[i].price > avg(a[…i-1].price))   AND	  b.volume < 80% * a[a.LEN].volume           WITHIN  1 hourRETURN	a[1].symbol, a[].(price,volume), b.(price,volume)

(note from Ajay-


I was not really happy about the depth of resources on CEP available online- there seem to be missing bits and pieces in both open source, academic and corporate information- one reason for this is the obvious military dual use of this technology- like feeds from Satellite, Audio Scans, etc)

Tale of Two Analytical Interfaces

Occam’s razor (or Ockham’s razor[1]) is often expressed in Latin as the lex parsimoniae(translating to the law of parsimonylaw of economy or law of succinctness). The principle is popularly summarized as “the simplest explanation is more likely the correct one.

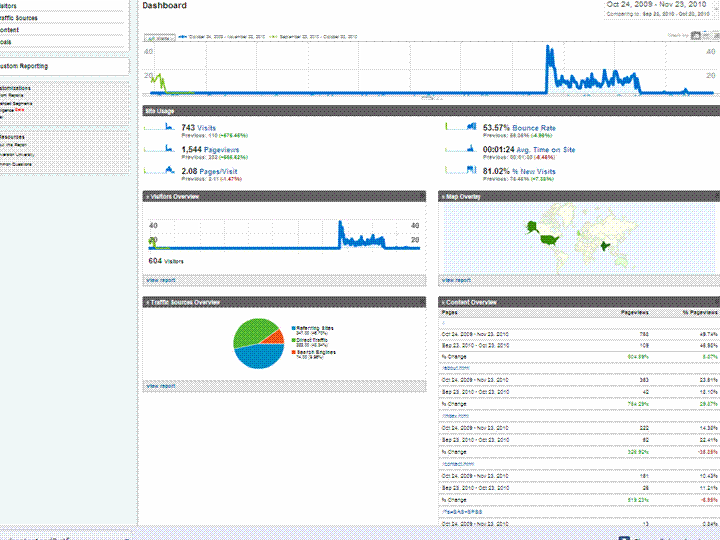
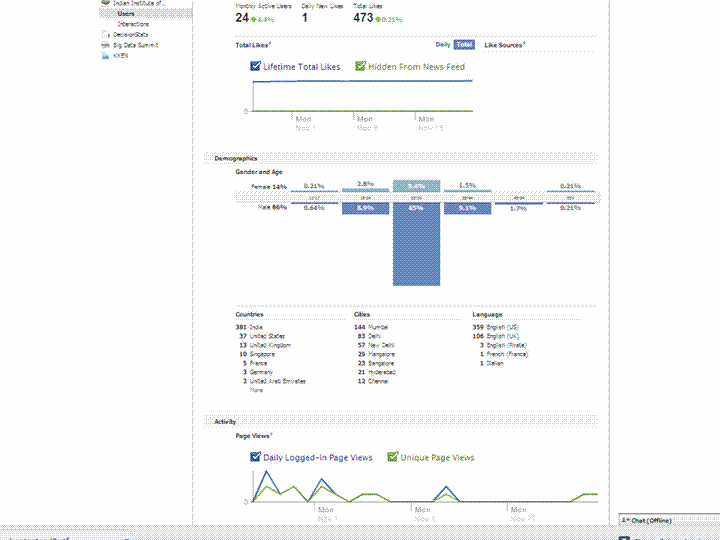
Using a simple screenshot- you can see Facebook Analytics for a Facebook page is simpler at explaining who is coming to visit rather than Google Analytics Dashboard (which has not seen the attention of a Visual UI or Graphic Redesign)

And if Facebook is going to take over the internet, well it is definitely giving better analytics in the process. What do you think?

Which Interface is simpler- and gives you better targeting. Ignore the numbers and just see the metrics measured and the way they are presented. Coincidently R is used at Facebook a lot (which has given the jjplot package)- and Google has NOT INVESTED MAJOR MONEY in creating Premium R Packages or Big Data Packages. I am talking investment at the scale Google is known for- not measly meetups.

(the summer of code dont count- it is for students mostly)

(but thanks for the Pizza G Men- and maybe revise that GA interface by putting a razor to some metrics)

GA vs Facebook Analytics


Who searches for this Blog?

Statue of Michael Jackson in Eindhoven, the Ne...
Image via Wikipedia

Using WP- Stats I set about answering this question-

What search keywords lead here-

Clearly Michael Jackson is down this year

And R GUI, Data Mining is up.

How does that affect my writing- given I get almost 250 visitors by search engines alone daily- assume I write nothing on this blog from now on.

It doesnt- I still write what ever code or poem that comes to my mind. So it is hurtful people misunderstimate the effort in writing and jump to conclusions (esp if I write about a company- I am not on payroll of that company- just like if  I write about a poem- I am not a full time poet)

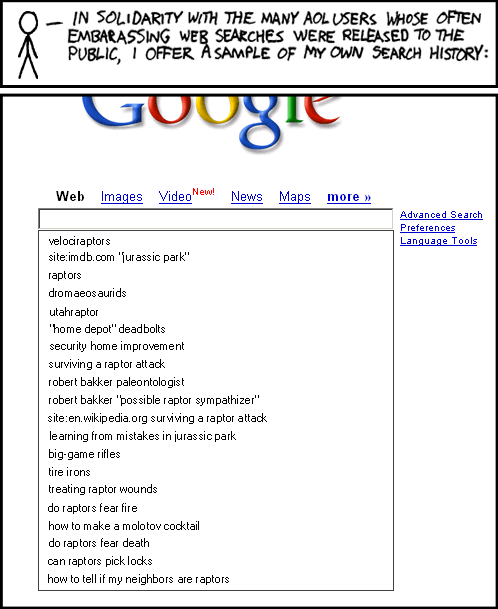
Over to xkcd

All Time (for Decisionstats.Wordpress.com)

Search Views
libre office 818
facebook analytics 806
michael jackson history 240
wps sas lawsuit 180
r gui 168
wps sas 154
wordle.net 118
sas wps 116
decision stats 110
sas wps lawsuit 100
google maps jet ski 94
data mining 88
doug savage 72
hive tutorial 63
spss certification 63
hadley wickham 63
google maps jetski 62
sas sues wps 60
decisionstats 58
donald farmer microsoft 45
libreoffice 44
wps statistics 44
best statistics software 42
r gui ubuntu 41
rstat 37
tamilnadu advanced technical training institute tatti 37

YTD

2009-11-24 to Today

Search Views
libre office 818
facebook analytics 781
wps sas lawsuit 170
r gui 164
wps sas 125
wordle.net 118
sas wps 101
sas wps lawsuit 95
google maps jet ski 94
data mining 86
decision stats 82
doug savage 63
hadley wickham 63
google maps jetski 62
hive tutorial 56
donald farmer microsoft 45

Google Street View shows Gladiators fighting

Go to http://goo.gl/maps/vFZP

Click on Street View -Rotate till you  find the gladiators


1. Go to Google maps.

2. Go to 35 Sampsonia Way, Pittsburgh Pennsylvania.

3. Click street view.

4. Turn the view around.

Another breach of gladiator privacy by Google. Hrrumph.

Nice BI Tutorials

Tutorials screenshot.
Image via Wikipedia

Here is a set of very nice, screenshot enabled tutorials from SAP BI. They are a bit outdated (3 years old) but most of it is quite relevant- especially from a Tutorial Design Perspective –

Most people would rather see screenshot based step by step powerpoints, than cluttered or clever presentations , or even videos that force you to sit like a TV zombie. Unfortunately most tutorial presentations I see especially for BI are either slides with one or two points, that abruptly shift to “concepts” or videos that are atleast more than 10 minutes long. That works fine for scripting tutorials or hands on workshops, but cannot be reproduced for later instances of study.

The mode of tutorials especially for GUI software can vary, it may be Slideshare, Scribd, Google Presentation,Microsoft Powerpoint but a step by step screenshot by screenshot tutorial is much better for understanding than commando line jargon/ Youtub   Videos presentations, or Powerpoint with Points.

Have a look at these SAP BI 7 slideshares

and

Speaking of BI, the R Package called Brew is going to brew up something special especially combined with R Apache. However I wish R Apache, or R Web, or RServe had step by step install screenshot tutorials to increase their usage in Business Intelligence.

I tried searching for JMP GUI Tutorials too, but I believe putting all your content behind a registration wall is not so great. Do a Pareto Analysis of your training material, surely you can share a couple more tutorials without registration. It also will help new wanna-migrate users to get a test and feel for the installation complexities as well as final report GUI.


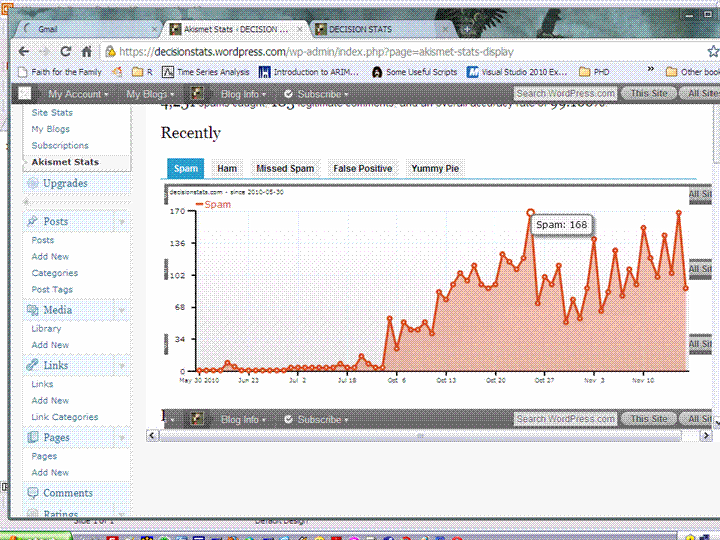
Zen and the art of applying T tests to Spam Data

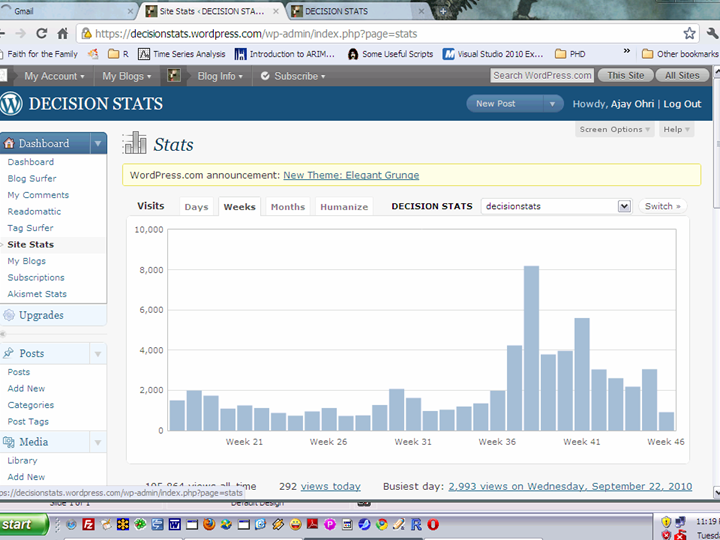
Decisionstats traffic seemed up mmm but Spam is way way up

Whos spamming my dear bloggie

hmm

is it the russians doing a link spam. unlikely they dont bot against Akismet that much (as they fail)

And Captcha can be failed by python (apparently. sigh)

Is there a co relation of certain tags of posts, and count of spam- hoping to distort say blogs’s search engine rankings for SAS WPS Lawsuit in Google or jet ski across  pacific in Google.

Sigh- an old retired outlaw black hat is never kept in peace. Try doing a blog search for R in Google- Revo  is now down to number 7 (which is hmm given Google Instant)

Of course I think too much about SEO, but I dont run CPC ads- I made much more money when traffic is low – say 5-10 small businesses needing to forecast their sales .

and enjoy your Thanksgiving. Remember the Indians bring the Turkeys.


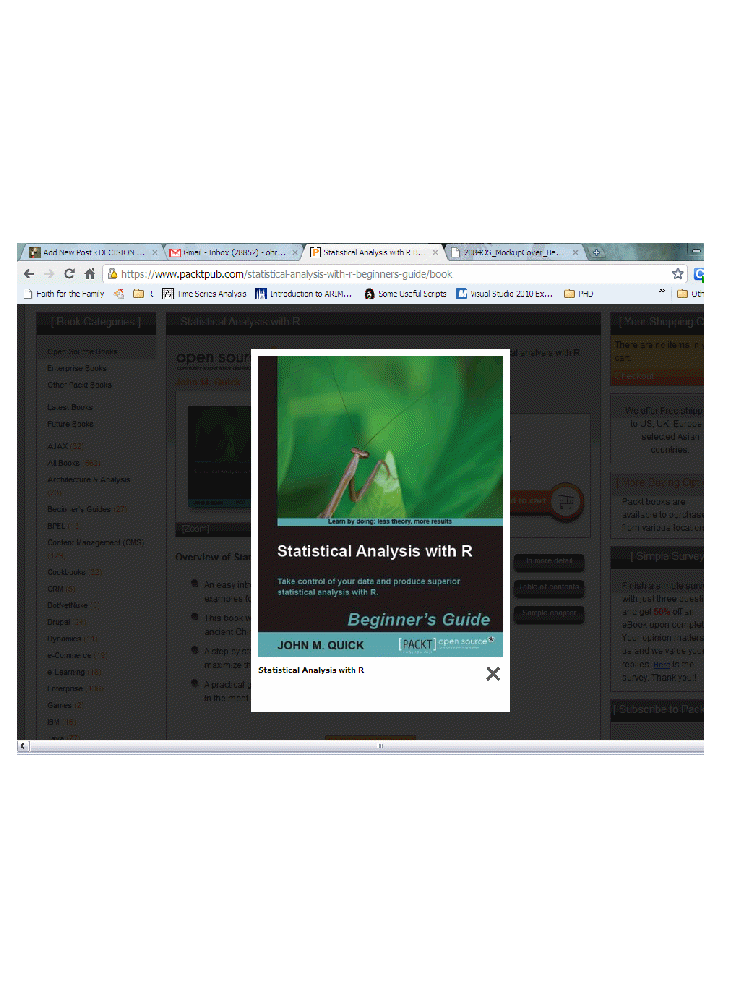
Statistical Analysis with R- by John M Quick

I was asked to be a techie reviewe for John M Quick’s new R book “Statistical Analysis with R” from Packt Publishing some months ago-(very much to my surprise I confess)-

I agreed- and technical reviewer work does take time- its like being a mid wife and there is whole team trying to get the book to birth.

Statistical Analysis with R- is a Beginner’s Guide so has nice screenshots, simple case studies, and quizzes to check recall of student/ reader. I remember struggling with the official “beginner’s guide to R” so this one is different in that it presents a story of a Chinese Army and how to use R to plan resources to fight the battle. It’s recommended especially for undergraduate courses- R need not be an elitist language- and given my experience with Asian programming acumen – I am sure it is a matter of time before high schools in India teach basic R in final years ( I learnt quite a shit load of quantum physics as compulsory topics in Indian high schools- but I guess we didnt have Jersey Shore things to do)

Congrats to author Mr John M Quick- he is doing his educational Phd from ASU- and I am sure both he and his approach to making education simple informative and fun will go places.

Only bad thing- The Name Statistical Analysis with R has atleast three other books , but I guess Google will catch up to it.

This book is here-https://www.packtpub.com/statistical-analysis-with-r-beginners-guide/book