Libre Office

Some ambiguity about Libre Office and why it needed to change from Open Office- just when Open Office seemed so threatening on the desktop

FROM- http://www.documentfoundation.org/faq/

Q: So is this a breakaway project?

A: Not at all. The Document Foundation will continue to be focused on developing, supporting, and promoting the same software, and it’s very much business as usual. We are simply moving to a new and more appropriate organisational model for the next decade – a logical development from Sun’s inspirational launch a decade ago.

Q: Why are you calling yourselves “The Document Foundation”?

A: For ten years we have used the same name – “OpenOffice.org” – for both the Community and the software. We’ve decided it removes ambiguity to have a different name for the two, so the Community is now “The Document Foundation”, and the software “LibreOffice”. Note: there are other examples of this usage in the free software community – e.g. the Mozilla Foundation with the Firefox browser.

Q: Does this mean you intend to develop other pieces of software?

A: We would like to have that possibility open to us in the future…

Q: And why are you calling the software “LibreOffice” instead of “OpenOffice.org”?

A: The OpenOffice.org trademark is owned by Oracle Corporation. Our hope is that Oracle will donate this to the Foundation, along with the other assets it holds in trust for the Community, in due course, once legal etc issues are resolved. However, we need to continue work in the meantime – hence “LibreOffice” (“free office”).

Q: Why are you building a new web infrastructure?

A: Since Oracle’s takeover of Sun Microsystems, the Community has been under “notice to quit” from our previous Collabnet infrastructure. With today’s announcement of a Foundation, we now have an entity which can own our emerging new infrastructure.

Q: What does this announcement mean to other derivatives of OpenOffice.org?

A: We want The Document Foundation to be open to code contributions from as many people as possible. We are delighted to announce that the enhancements produced by the Go-OOo team will be merged into LibreOffice, effective immediately. We hope that others will follow suit.

Q: What difference will this make to the commercial products produced by Oracle Corporation, IBM, Novell, Red Flag, etc?

A: The Document Foundation cannot answer for other bodies. However, there is nothing in the licence arrangements to stop companies continuing to release commercial derivatives of LibreOffice. The new Foundation will also mean companies can contribute funds or resources without worries that they may be helping a commercial competitor.

Q: What difference will The Document Foundation make to developers?

A: The Document Foundation sets out deliberately to be as developer friendly as possible. We do not demand that contributors share their copyright with us. People will gain status in our community based on peer evaluation of their contributions – not by who their employer is.

Q: What difference will The Document Foundation make to users of LibreOffice?

A: LibreOffice is The Document Foundation’s reason for existence. We do not have and will not have a commercial product which receives preferential treatment. We only have one focus – delivering the best free office suite for our users – LibreOffice.

—————————————————————————————————-

Non Microsoft and Non Oracle vendors are indeed going to find it useful the possiblities of bundling a free Libre Office that reduces the total cost of ownership for analytics software. Right now, some of the best free advertising for Microsoft OS and Office is done by enterprise software vendors who create Windows Only Products and enable MS Office integration better than  Open Office integration. This is done citing user demand- but it is a chicken egg dilemma- as functionality leads to enhanced demand. Microsoft on the other hand is aware of this dependence and has made SQL Server and SQL Analytics (besides investing in analytics startups like Revolution Analytics) along with it’s own infrastructure -Azure Cloud Platform/EC2 instances.

BI Software

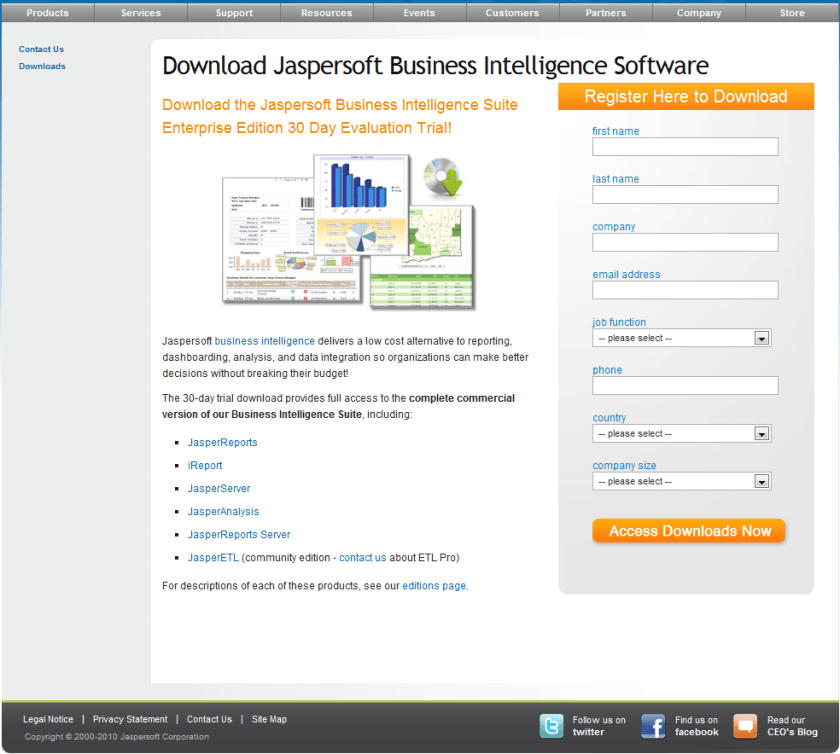
Here is the brand new release from Jaspersoft at a groovy price of 9000$. Somebody stop these guys!

It’s a great company to watch for buyouts as well- given their expertise in REPORTING and clientele- especially for anyone looking to im prove thier standing in both open source world and reporting software branding.

From AOL owned Arrogantion’s site http://www.crunchbase.com/company/jaspersoft


Total $24.5M
Series D, 8/07 1
Scale Venture Partners
SAP Ventures
Doll Capital Management
Partech International
Morgenthaler Ventures
$12M
Unattributed, 12/08 2
Adams Street Partners
Red Hat
Morgenthaler Ventures
Doll Capital Management
Partech International


The news-

Announcing JasperReports Server Professional

More Resources

Webinar: Introducing JasperReports Server Professional

Thursday October 14

In this live webinar, learn how a new solution from Jaspersoft combines the world’s favorite reporting server with powerful, mature report server functionality—for about 80% less.

  • Date: Thu, Oct 14
  • Time: 10:00 AM PDT
  • Duration: 60 minutes

The World’s Most Powerful and Affordable Reporting Server

Limited Time Introductory Offer: Starting from $9,000 (restrictions apply)

JasperReports Server is the recommended product for organizations requiring an affordable reporting solution for interactive, operational, and production-based reporting. Deployed as a standalone reporting server or integrated inside another application, JasperReports Server is a flexible, powerful, interactive reporting environment for small or large enterprises.

Powered by the world’s most popular reporting tools in JasperReports and iReport, developers and users can take advantage of more interactivity, security, and scheduling of their reports.

Key Benefits:

  • Affordable: Unlimited reports for unlimited users starting at $9,000
  • Powerful: Report scheduling and distribution to 1,000s of users on a single server
  • Flexible: Web service architecture simplifies application integration
  • Secure: Centralized repository authenticates report access
  • Interactive: Easy to interact, self-serve parameterized-based reports
  • Visual appeal: Flash-based charts and maps engage users and enhance applications
  • Open: Access to any data source including relational, XML, Hibernate, EJB, POJO, and custom


Speaking of videos -here is a great video on BI from good ol Tennessee-a great 27 min tutorial on BI for newbies


Revolution R for Linux

Screenshot of the Redhat Enterprise Linux Desktop
Image via Wikipedia

New software just released from the guys in California (@RevolutionR) so if you are a Linux user and have academic credentials you can download it for free  (@Cmastication doesnt), you can test it to see what the big fuss is all about (also see http://www.revolutionanalytics.com/why-revolution-r/benchmarks.php) –

Revolution Analytics has just released Revolution R Enterprise 4.0.1 for Red Hat Enterprise Linux, a significant step forward in enterprise data analytics. Revolution R Enterprise 4.0.1 is built on R 2.11.1, the latest release of the open-source environment for data analysis and graphics. Also available is the initial release of our deployment server solution, RevoDeployR 1.0, designed to help you deliver R analytics via the Web. And coming soon to Linux: RevoScaleR, a new package for fast and efficient multi-core processing of large data sets.

As a registered user of the Academic version of Revolution R Enterprise for Linux, you can take advantage of these improvements by downloading and installing Revolution R Enterprise 4.0.1 today. You can install Revolution R Enterprise 4.0.1 side-by-side with your existing Revolution R Enterprise installations; there is no need to uninstall previous versions.

Download Information

The following information is all you will need to download and install the Academic Edition.

Supported Platforms:

Revolution R Enterprise Academic edition and RevoDeployR are supported on Red Hat® Enterprise Linux® 5.4 or greater (64-bit processors).

Approximately 300MB free disk space is required for a full install of Revolution R Enterprise. We recommend at least 1GB of RAM to use Revolution R Enterprise.

For the full list of system requirements for RevoDeployR, refer to the RevoDeployR™ Installation Guide for Red Hat® Enterprise Linux®.

Download Links:

You will first need to download the Revolution R Enterprise installer.

Installation Instructions for Revolution R Enterprise Academic Edition

After downloading the installer, do the following to install the software:

  • Log in as root if you have not already.
  • Change directory to the directory containing the downloaded installer.
  • Unpack the installer using the following command:
    tar -xzf Revo-Ent-4.0.1-RHEL5-desktop.tar.gz
  • Change directory to the RevolutionR_4.0.1 directory created.
  • Run the installer by typing ./install.py and following the on-screen prompts.

Getting Started with the Revolution R Enterprise

After you have installed the software, launch Revolution R Enterprise by typing Revo64 at the shell prompt.

Documentation is available in the form of PDF documents installed as part of the Revolution R Enterprise distribution. Type Revo.home(“doc”) at the R prompt to locate the directory containing the manuals Getting Started with Revolution R (RevoMan.pdf) and the ParallelR User’s Guide(parRman.pdf).

Installation Instructions for RevoDeployR (and RServe)

After downloading the RevoDeployR distribution, use the following steps to install the software:

Note: These instructions are for an automatic install.  For more details or for manual install instructions, refer to RevoDeployR_Installation_Instructions_for_RedHat.pdf.

  1. Log into the operating system as root.
    su –
  2. Change directory to the directory containing the downloaded distribution for RevoDeployR and RServe.
  3. Unzip the contents of the RevoDeployR tar file. At prompt, type:
    tar -xzf deployrRedHat.tar.gz
  4. Change directories. At the prompt, type:
    cd installFiles
  5. Launch the automated installation script and follow the on-screen prompts. At the prompt, type:
    ./installRedHat.sh
    Note: Red Hat installs MySQL without a password.

Getting Started with RevoDeployR

After installing RevoDeployR, you will be directed to the RevoDeployR landing page. The landing page has links to documentation, the RevoDeployR management console, the API Explorer development tool, and sample code.

Support

For help installing this Academic Edition, please email support@revolutionanalytics.com

Also interestingly some benchmarks on Revolution R vs R.

http://www.revolutionanalytics.com/why-revolution-r/benchmarks.php

R-25 Benchmarks

The simple R-benchmark-25.R test script is a quick-running survey of general R performance. The Community-developed test consists of three sets of small benchmarks, referred to in the script as Matrix Calculation, Matrix Functions, and Program Control.

R-25 Matrix Calculation R-25 Matrix Functions R-Matrix Program Control
R-25 Benchmarks Base R 2.9.2 Revolution R (1-core) Revolution R (4-core) Speedup (4 core)
Matrix Calculation 34 sec 6.6 sec 4.4 sec 7.7x
Matrix Functions 20 sec 4.4 sec 2.1 sec 9.5x
Program Control 4.7 sec 4 sec 4.2 sec Not Appreciable

Speedup = Slower time / Faster Time – 1   Test descriptions available at http://r.research.att.com/benchmarks

Additional Benchmarks

Revolution Analytics has created its own tests to simulate common real-world computations.  Their descriptions are explained below.

Matrix Multiply Cholesky Factorization
Singular Value Decomposition Principal Component Analysis Linear Discriminant Analysis
Linear Algebra Computation Base R 2.9.2 Revolution R (1-core) Revolution R (4-core) Speedup (4 core)
Matrix Multiply 243 sec 22 sec 5.9 sec 41x
Cholesky Factorization 23 sec 3.8 sec 1.1 sec 21x
Singular Value Decomposition 62 sec 13 sec 4.9 sec 12.6x
Principal Components Analysis 237 sec 41 sec 15.6 sec 15.2x
Linear Discriminant Analysis 142 sec 49 sec 32.0 sec 4.4x

Speedup = Slower time / Faster Time – 1

Matrix Multiply

This routine creates a random uniform 10,000 x 5,000 matrix A, and then times the computation of the matrix product transpose(A) * A.

set.seed (1)
m <- 10000
n <-  5000
A <- matrix (runif (m*n),m,n)
system.time (B <- crossprod(A))

The system will respond with a message in this format:

User   system elapsed
37.22    0.40   9.68

The “elapsed” times indicate total wall-clock time to run the timed code.

The table above reflects the elapsed time for this and the other benchmark tests. The test system was an INTEL® Xeon® 8-core CPU (model X55600) at 2.5 GHz with 18 GB system RAM running Windows Server 2008 operating system. For the Revolution R benchmarks, the computations were limited to 1 core and 4 cores by calling setMKLthreads(1) and setMKLthreads(4) respectively. Note that Revolution R performs very well even in single-threaded tests: this is a result of the optimized algorithms in the Intel MKL library linked to Revolution R. The slight greater than linear speedup may be due to the greater total cache available to all CPU cores, or simply better OS CPU scheduling–no attempt was made to pin execution threads to physical cores. Consult Revolution R’s documentation to learn how to run benchmarks that use less cores than your hardware offers.

Cholesky Factorization

The Cholesky matrix factorization may be used to compute the solution of linear systems of equations with a symmetric positive definite coefficient matrix, to compute correlated sets of pseudo-random numbers, and other tasks. We re-use the matrix B computed in the example above:

system.time (C <- chol(B))

Singular Value Decomposition with Applications

The Singular Value Decomposition (SVD) is a numerically-stable and very useful matrix decompisition. The SVD is often used to compute Principal Components and Linear Discriminant Analysis.

# Singular Value Deomposition
m <- 10000
n <- 2000
A <- matrix (runif (m*n),m,n)
system.time (S <- svd (A,nu=0,nv=0))

# Principal Components Analysis
m <- 10000
n <- 2000
A <- matrix (runif (m*n),m,n)
system.time (P <- prcomp(A))

# Linear Discriminant Analysis
require (‘MASS’)
g <- 5
k <- round (m/2)
A <- data.frame (A, fac=sample (LETTERS[1:g],m,replace=TRUE))
train <- sample(1:m, k)
system.time (L <- lda(fac ~., data=A, prior=rep(1,g)/g, subset=train))

The auto-suggest link/tags for WP.com blogs

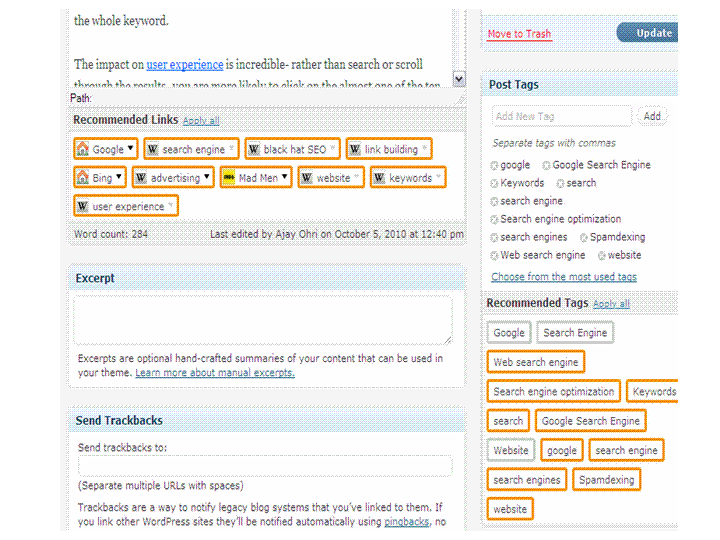
WordPress.com blogs have a great new option for generating tags, and links and thus improving their search engine optimization for posts.

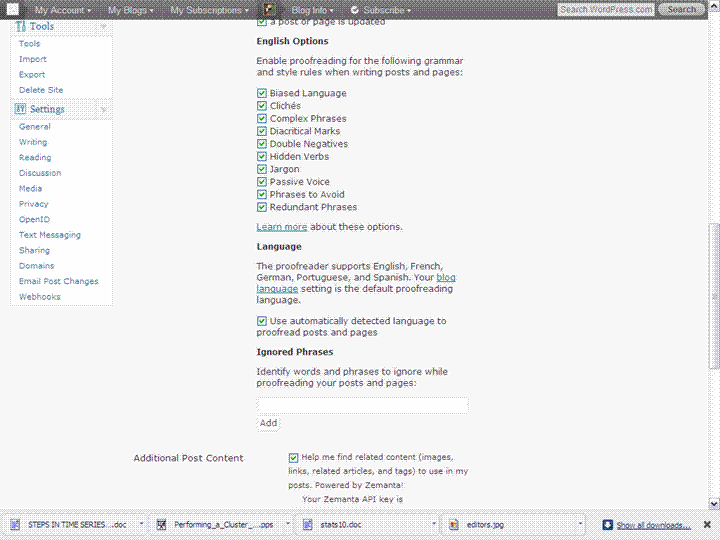
Just go to Users-Personal Settings- and check the options shown. Thats it every time you write a post it suggests links and tags. Links are helpful for your readers (like Wikipedia links to understand dense technical jargon, or associated websites). Tags help to classify your contents so that all visitors to the web site including spiders ,search engines and your readers can search it better.

The bad thing is I need to go back to all 1025 posts on this site and auto generate tags for the archives ! Oh well. Great collaboration between zementa and Automattic for this new feature.

Customizing your R software startup

Customizing your R software startup helps you do the following.
Thus it helps you to boot up R faster.
It automatically loads packages that you use regularly (like a R GUI -Deducer, Rattle or R Commander), set a CRAN mirror that you mostly use or is nearest for downloading new packages, and set some optional parameters.

Everytime you start R Instead of doing this , loading same R packages, setting a CRAN mirror,setting some new functions- the user needs to do this just once by customizing the R Profile SITE file.

This is done by editing the $R_HOME/etc/Renviron file for globally setting a default or the .Renviron file that is created in your home directory for a shared system.

There are two special functions you can customize in these files.
.First( ) will be run at the start of the R session and
.Last( ) will be run when the R session is shutting down.

When R starts up, it loads the .Rprofile file in your home directory and executes the .First() function.

Where is the R Profile file?
It is located in the \etc folder of your R folder- folder you installed R in.
In Windows the folder will be of the format -”C:\Program Files\R\R-x.ab.c\etc”
where x.ab.c will be the R version number (like 2.11.1)
Example
.First <- function(){
library(rattle)
rattle()
cat(“\nHello World”, date(), “\n”)
}

will automatically start the Rattle GUI for data mining and print Hello World with the date in your session.

You can also modify the Rcmd_environ file in the same \etc folder if you are particular on your settings

## Default browser
R_BROWSER=${R_BROWSER-‘C:\Documents and Settings\abc\Local Settings\Application Data\Google\Chrome\Application\chrome.exe} ## Default editor EDITOR=${EDITOR-${notepad++}}

will change the default Web browser to Chrome and the default editor to Notepad++ which is an enhanced Code Editor.

Interview Michael J. A. Berry Data Miners, Inc

Here is an interview with noted Data Mining practitioner Michael Berry, author of seminal books in data mining, noted trainer and consultantmjab picture

Ajay- Your famous book “Data Mining Techniques: For Marketing, Sales, and Customer Relationship Management” came out in 2004, and an update is being planned for 2011. What are the various new data mining techniques and their application that you intend to talk about in that book.

Michael- Each time we do a revision, it feels like writing a whole new book. The first edition came out in 1997 and it is hard to believe how much the world has changed since then. I’m currently spending most of my time in the on-line retailing world. The things I worry about today–improving recommendations for cross-sell and up-sell,and search engine optimization–wouldn’t have even made sense to me back then. And the data sizes that are routine today were beyond the capacity of the most powerful super computers of the nineties. But, if possible, Gordon and I have changed even more than the data mining landscape. What has changed us is experience. We learned an awful lot between the first and second editions, and I think we’ve learned even more between the second and third.

One consequence is that we now have to discipline ourselves to avoid making the book too heavy to lift. For the first edition, we could write everything we knew (and arguably, a bit more!); now we have to remind ourselves that our intended audience is still the same–intelligent laymen with a practical interest in getting more information out of data. Not statisticians. Not computer scientists. Not academic researchers. Although we welcome all readers, we are primarily writing for someone who works in a marketing department and has a title with the word “analyst” or “analytics” in it. We have relaxed our “no equations” rule slightly for cases when the equations really do make things easier to explain, but the core explanations are still in words and pictures.

The third edition completes a transition that was already happening in the second edition. We have fully embraced standard statistical modeling techniques as full-fledged components of the data miner’s toolkit. In the first edition, it seemed important to make a distinction between old, dull, statistics, and new, cool, data mining. By the second edition, we realized that didn’t really make sense, but remnants of that attitude persisted. The third edition rectifies this. There is a chapter on statistical modeling techniques that explains linear and logistic regression, naive Bayes models, and more. There is also a brand new chapter on text mining, a curious omission from previous editions.

There is also a lot more material on data preparation. Three whole chapters are devoted to various aspects of data preparation. The first focuses on creating customer signatures. The second is focused on using derived variables to bring information to the surface, and the third deals with data reduction techniques such as principal components. Since this is where we spend the greatest part of our time in our work, it seemed important to spend more time on these subjects in the book as well.

Some of the chapters have been beefed up a bit. The neural network chapter now includes radial basis functions in addition to multi-layer perceptrons. The clustering chapter has been split into two chapters to accommodate new material on soft clustering, self-organizing maps, and more. The survival analysis chapter is much improved and includes material on some of our recent application of survival analysis methods to forecasting. The genetic algorithms chapter now includes a discussion of swarm intelligence.

Ajay- Describe your early career and how you came into Data Mining as a profession. What do you think of various universities now offering MS in Analytics. How do you balance your own teaching experience with your consulting projects at The Data Miners.

Michael- I fell into data mining quite by accident. I guess I always had a latent interest in the topic. As a high school and college student, I was a fan of Martin Gardner‘s mathematical games in in Scientific American. One of my favorite things he wrote about was a game called New Eleusis in which one players, God, makes up a rule to govern how cards can be played (“an even card must be followed by a red card”, say) and the other players have to figure out the rule by watching what plays are allowed by God and which ones are rejected. Just for my own amusement, I wrote a computer program to play the game and presented it at the IJCAI conference in, I think, 1981.

That paper became a chapter in a book on computer game playing–so my first book was about finding patterns in data. Aside from that, my interest in finding patterns in data lay dormant for years. At Thinking Machines, I was in the compiler group. In particular, I was responsible for the run-time system of the first Fortran Compiler for the CM-2 and I represented Thinking Machines at the Fortran 8X (later Fortran-90) standards meetings.

What changed my direction was that Thinking Machines got an export license to sell our first machine overseas. The machine went to a research lab just outside of Paris. The connection machine was so hard to program, that if you bought one, you got an applications engineer to go along with it. None of the applications engineers wanted to go live in Paris for a few months, but I did.

Paris was a lot of fun, and so, I discovered, was actually working on applications. When I came back to the states, I stuck with that applied focus and my next assignment was to spend a couple of years at Epsilon, (then a subsidiary of American Express) working on a database marketing system that stored all the “records of charge” for American Express card members. The purpose of the system was to pick ads to go in the billing envelope. I also worked on some more general purpose data mining software for the CM-5.

When Thinking Machines folded, I had the opportunity to open a Cambridge office for a Virginia-based consulting company called MRJ that had been a major channel for placing Connection Machines in various government agencies. The new group at MRJ was focused on data mining applications in the commercial market. At least, that was the idea. It turned out that they were more interested in data warehousing projects, so after a while we parted company.

That led to the formation of Data Miners. My two partners in Data Miners, Gordon Linoff and Brij Masand, share the Thinking Machines background.

To tell the truth, I really don’t know much about the university programs in data mining that have started to crop up. I’ve visited the one at NC State, but not any of the others.

I myself teach a class in “Marketing Analytics” at the Carroll School of Management at Boston College. It is an elective part of the MBA program there. I also teach short classes for corporations on their sites and at various conferences.

Ajay- At the previous Predictive Analytics World, you took a session on Forecasting and Predicting Subsciber levels (http://www.predictiveanalyticsworld.com/dc/2009/agenda.php#day2-6) .

It seems inability to forecast is a problem many many companies face today. What do you think are the top 5 principles of business forecasting which companies need to follow.

Michael- I don’t think I can come up with five. Our approach to forecasting is essentially simulation. We try to model the underlying processes and then turn the crank to see what happens. If there is a principal behind that, I guess it is to approach a forecast from the bottom up rather than treating aggregate numbers as a time series.

Ajay- You often partner your talks with SAS Institute, and your blog at http://blog.data-miners.com/ sometimes contain SAS code as well. What particular features of the SAS software do you like. Do you use just the Enterprise Miner or other modules as well for Survival Analysis or Forecasting.

Michael- Our first data mining class used SGI’s Mineset for the hands-on examples. Later we developed versions using Clementine, Quadstone, and SAS Enterprise Miner. Then, market forces took hold. We don’t market our classes ourselves, we depend on others to market them and then share in the revenue.

SAS turned out to be much better at marketing our classes than the other companies, so over time we stopped updating the other versions. An odd thing about our relationship with SAS is that it is only with the education group. They let us use Enterprise Miner to develop course materials, but we are explicitly forbidden to use it in our consulting work. As a consequence, we don’t use it much outside of the classroom.

Ajay- Also any other software you use (apart from SQL and J)

Michael- We try to fit in with whatever environment our client has set up. That almost always is SQL-based (Teradata, Oracle, SQL Server, . . .). Often SAS Stat is also available and sometimes Enterprise Miner.

We run into SPSS, Statistica, Angoss, and other tools as well. We tend to work in big data environments so we’ve also had occasion to use Ab Initio and, more recently, Hadoop. I expect to be seeing more of that.

Biography-

Together with his colleague, Gordon Linoff, Michael Berry is author of some of the most widely read and respected books on data mining. These best sellers in the field have been translated into many languages. Michael is an active practitioner of data mining. His books reflect many years of practical, hands-on experience down in the data mines.

Data Mining Techniques cover

Data Mining Techniques for Marketing, Sales and Customer Relationship Management

by Michael J. A. Berry and Gordon S. Linoff
copyright 2004 by John Wiley & Sons
ISB

Mining the Web cover

Mining the Web

by Michael J.A. Berry and Gordon S. Linoff
copyright 2002 by John Wiley & Sons
ISBN 0-471-41609-6

Non-English editions available in Traditional Chinese and Simplified Chinese

This book looks at the new opportunities and challenges for data mining that have been created by the web. The book demonstrates how to apply data mining to specific types of online businesses, such as auction sites, B2B trading exchanges, click-and-mortar retailers, subscription sites, and online retailers of digital content.

Mastering Data Mining

by Michael J.A. Berry and Gordon S. Linoff
copyright 2000 by John Wiley & Sons
ISBN 0-471-33123-6

Non-English editions available in JapaneseItalianTraditional Chinese , and Simplified Chinese

A case study-based guide to applying data mining techniques for solving practical business problems. These “warts and all” case studies are drawn directly from consulting engagements performed by the authors.

A data mining educator as well as a consultant, Michael is in demand as a keynote speaker and seminar leader in the area of data mining generally and the application of data mining to customer relationship management in particular.

Prior to founding Data Miners in December, 1997, Michael spent 8 years at Thinking Machines Corporation. There he specialized in the application of massively parallel supercomputing techniques to business and marketing applications, including one of the largest database marketing systems of the time.

Clustering Business Analysts and Industry Analysts

In my interactions with the world at large (mostly online) in the ways of data, statistics and analytics- I come across people who like to call themselves analysts.

As per me, there are 4 kinds of analysts principally,

1) Corporate Analysts- They work for a particular software company. As per them their product is great and infallible, their code has no bugs, and last zillion customer case studies all got a big benefit by buying their software.

They are very good at writing software code themselves, unfortunately this expertise is restricted to Microsoft Outlook (emails) and MS Powerpoint ( presentations). No they are more like salesmen than analysts, but as Arthur Miller said ” All salesmen (person) are dreamers. When the dream dies, the salesman (person) dies (read transfers to bigger job at a rival company)

2) Third -Party Independent Analsyst- The main reason they are third party is they can not be tolerated in a normal corporate culture, their spouse can barely stand them for more than 2 hours a day, and their Intelligence is not matched by their emotional maturity. Alas, after turning independent analysts, they realize they are actually more dependent to people than before, and they quickly polish their behaviour to praise who ever is sponsoring their webinar,  white paper , newsletter, or flying them to junkets. They are more of boutique consultants, but they used to be quite nifty at writing code, when younger, so they call themselves independent and “Noted Industry Analyst”

3) Researcher Analysts- They mostly scrape info from press releases which are mostly written by a hapless overworked communications team thrown at a task at last moment. They get into one hour call with who ever is the press or industry/analyst  relations honcho is- turn the press release into bullet points, and publish on the blog. They call this as research Analysts and give it away for free (but actually couldnt get anyone to pay for it for last 4 years). Couldnt write code if their life depended on it, but usually will find transformation and expert somehwere in their resume/about me web page. May have co -authored a book, which would have gotten them a F for plagiarism had they submitted it as a thesis.

4) Analytical Analysts- They are mostly buried deep within organizational bureaucracies if corporate, or within partnerships if they are independent. Understand coding, innovation (or creativity). Not very aggressive at networking unless provoked by an absolute idiot belonging to first three classes of industry analyst. Prefer to read Atlas Shrugged than argue on business semantics.

Next time you see an industry expert- you know which cluster to classify them 😉

Image Citation-

http://gapingvoidgallery.com/