RWui :Creating R Web Interfaces on the go

Here is a great R application created by http://sysbio.mrc-bsu.cam.ac.uk

R Wui for creating R Web Interfaces

its been there for some time now- but presumably R Apache is more well known.

From-

http://sysbio.mrc-bsu.cam.ac.uk/Rwui/tutorial/Rwui_Rnews_final.pdf

The web application Rwui is used to create web interfaces  for running R scripts. All the code is generated automatically so that a fully functional web interface for an R script can be downloaded and up and running in a matter of minutes.

Rwui is aimed at R script writers who have scripts that they want people unversed in R to use. The script writer uses Rwui to create a web application that will run their R script. Rwui allows the script writer to do this without them having to do any web application programming, because Rwui generates all the code for them.

The script writer designs the web application to run their R script by entering information on a sequence of web pages. The script writer then downloads the application they have created and installs it on their own server.

http://sysbio.mrc-bsu.cam.ac.uk/Rwui/tutorial/Technical_Report.pdf

Features of web applications created by Rwui

  1. Whole range of input items available if required – text boxes, checkboxes, file upload etc.
  2. Facility for uploading of an arbitrary number of files (for example, microarray replicates).
  3. Facility for grouping uploaded files (for example, into ‘Diseased’ and ‘Control’ microarray data files).
  4. Results files displayed on results page and available for download.
  5. Results files can be e-mailed to the user.
  6. Interactive results files using image maps.
  7. Repeat analyses with different parameters and data files – new results added to results list, as a link to the corresponding results page.
  8. Real time progress information (text or graphical) displayed when running the application.

Requirements

In order to use the completed web applications created by Rwui you will need:

  1. A Java webserver such as Tomcat version 5.5 or later.
  2. Java version 1.5
  3. R – a version compatible with your R script(s).

Using Rwui

Using Rwui to create a web application for an R script simply involves:

  1. Entering details about your Rscript on a sequence of web pages.
  2. Rwui is quite flexible so you can backtrack, edit and insert, as you design your application.
  3. Rwui then generates the web application, which is Java based and platform independent.
  4. The application can be downloaded either as a .zip or .tgz file.
  5. Unpacked, the download contains all the source code and a .war file.
  6. Once the .war file is copied to the Tomcat webapps directory, the application is ready to use.
  7. Application details are saved in an ‘application definition file’ for reuse and modification.
Interested-
go click and check out a new web app from http://sysbio.mrc-bsu.cam.ac.uk/Rwui/ in a matter of minutes
Also see

American Decline- Why outsourcing doesnt make sense

Bureau of Labor Statistics logo RGB colors.
Image via Wikipedia

Here is a celebrated graphic from an American journalist using U.S. Department of Labor’s Bureau of Labor Statistics. It is a good example of using time as a dimension for animation- and heat maps for geography enabled visualizations.

————————–According to the U.S. Department of Labor’s Bureau of Labor Statistics, there are nearly 31 million people currently unemployed — that’s including those involuntarily working part time and those who want a job, but have given up on trying to find one. In the face of the worst economic upheaval since the Great Depression, millions of Americans are hurting. “The Decline: The Geography of a Recession,” as created by labor writer LaToya Egwuekwe, serves as a vivid representation of just how much. Watch the deteriorating transformation of the U.S. economy from January 2007 — approximately one year before the start of the recession — to the most recent unemployment data available today. Original link: http://www.latoyaegwuekwe.com/geographyofarecession.html. For more information, email latoya.egwuekwe@yahoo.com

————————————————————————————-


31 million unemployed- Does a US corporation seriously think that it can build everything OUTSIDE America and SELL INSIDE America. or who think it is okay intellectual property continues to be stolen as long as labor is cheap.

Shame on you if you outsourced your neighbour’s jobs- or would rather hire in a geography where they steal your intellectual property.


This Christmastime – May the Ghost of  the Unemployed Family Christmases visit you in your sleep instead.

Brief Interview Timo Elliott

Here is a brief interview with Timo Elliott.Timo Elliott is a 19-year veteran of SAP Business Objects.

Ajay- What are the top 5 events in Business Integration and Data Visualization services you saw in 2010 and what are the top three trends you see in these in 2011.


Timo-

Top five events in 2010:

(1) Back to strong market growth. IT spending plummeted last year (BI continued to grow, but more slowly than previous years). This year, organizations reopened their wallets and funded new analytics initiatives — all the signs indicate that BI market growth will be double that of 2009.

(2) The launch of the iPad. Mobile BI has been around for years, but the iPad opened the floodgates of organizations taking a serious look at mobile analytics — and the easy-to-use, executive-friendly iPad dashboards have considerably raised the profile of analytics projects inside organizations.

(3) Data warehousing got exciting again. Decades of incremental improvements (column databases, massively parallel processing, appliances, in-memory processing…) all came together with robust commercial offers that challenged existing data storage and calculation methods. And new “NoSQL” approaches, designed for the new problems of massive amounts of less-structured web data, started moving into the mainstream.

(4) The end of Google Wave, the start of social BI.Google Wave was launched as a rethink of how we could bring together email, instant messaging, and social networks. While Google decided to close down the technology this year, it has left its mark, notably by influencing the future of “social BI”, with several major vendors bringing out commercial products this year.

(5) The start of the big BI merge. While several small independent BI vendors reported strong growth, the major trend of the year was consolidation and integration: the BI megavendors (SAP, Oracle, IBM, Microsoft) increased their market share (sometimes by acquiring smaller vendors, e.g. IBM/SPSS and SAP/Sybase) and integrated analytics with their existing products, blurring the line between BI and other technology areas.

Top three trends next year:

(1) Analytics, reinvented. New DW techniques make it possible to do sub-second, interactive analytics directly against row-level operational data. Now BI processes and interfaces need to be rethought and redesigned to make best use of this — notably by blurring the distinctions between the “design” and “consumption” phases of BI.

(2) Corporate and personal BI come together. The ability to mix corporate and personal data for quick, pragmatic analysis is a common business need. The typical solution to the problem — extracting and combining the data into a local data store (either Excel or a departmental data mart) — pleases users, but introduces duplication and extra costs and makes a mockery of information governance. 2011 will see the rise of systems that let individuals and departments load their data into personal spaces in the corporate environment, allowing pragmatic analytic flexibility without compromising security and governance.

(3) The next generation of business applications. Where are the business applications designed to support what people really do all day, such as implementing this year’s strategy, launching new products, or acquiring another company? 2011 will see the first prototypes of people-focused, flexible, information-centric, and collaborative applications, bringing together the best of business intelligence, “enterprise 2.0”, and existing operational applications.

And one that should happen, but probably won’t:

(4) Intelligence = Information + PEOPLE. Successful analytics isn’t about technology — it’s about people, process, and culture. The biggest trend in 2011 should be organizations spending the majority of their efforts on user adoption rather than technical implementation.                 About- http://timoelliott.com/blog/about

Timo Elliott is a 19-year veteran of SAP BusinessObjects, and has spent the last twenty years working with customers around the world on information strategy.

He works closely with SAP research and innovation centers around the world to evangelize new technology prototypes.

His popular Business Analytics and SAPWeb20 blogs track innovation in analytics and social media, including topics such as augmented corporate reality, collaborative decision-making, and social network analysis.

His PowerPoint Twitter Tools lets presenters see and react to tweets in real time, embedded directly within their slides.

A popular and engaging speaker, Elliott presents regularly to IT and business audiences at international conferences, on subjects such as why BI projects fail and what to do about it, and the intersection of BI and enterprise 2.0.

Prior to Business Objects, Elliott was a computer consultant in Hong Kong and led analytics projects for Shell in New Zealand. He holds a first-class honors degree in Economics with Statistics from Bristol University, England. He blogs on http://timoelliott.com/blog/ (one of the best designed blogs in BI) . You can see more about him personal web site here and photo/sketch blog here. You should follow Timo at http://twitter.com/timoelliott

Art Credit- Timo Elliott

Related Articles

Why social media is an one way street- cant close accounts

Update to https://decisionstats.com/2010/11/24/deleting-twitter-facebooklinkedin-accepting-life/

You cant DELETE a Facebook Account- it gets deactivated NOT DELETED.

You have to delete photo albums one by one, but if you have a folder like profile photos or wall photos or mobile uploads  (you cant delete these folders you have to delete those photos one by one)

So I had to delete 1100 friends, delete all Facebook Pages I created, and then download the account- (photos) which were now a more easy to download zip file of 92 mb. And I deleted all the 250+ Likes I had given to things I had flippantly liked- it was horrifying because if you accumulate all that info- it basically gives you a big lead in estimating my psychological profile- and thats not stuff I want to be used for selling.

Then I deactivated it- no like Lord Voldermort’s horcruxes you cant delete it all.

and Facebook shows you ads even if you clean your profile and your friends and can longer see any preference for any product.

Facebook treats data like prisoners – even if you are released they WILL maintain your record.

20 years later they would be able to blackmail all the people  of all countries in the WORLD- by that much info.

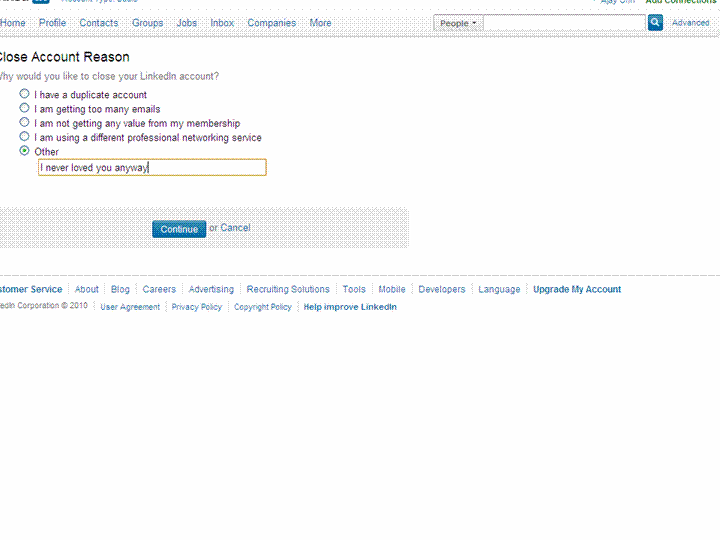
And Linkedin is still getting deleted- I got this email from them-

basically if you have an active group for whom you are the only owner you cant delete yourself- you have to delete the group or find another owner.

Sigh!

If it took me 2 days to download all my info, and wipe my social media for just 3 yrs of using it (albiet at an expert enough level to act as a social media consultant to some companies)- I am not sure what today’s generation of young people who jump to twitter and Facebook at early ages would face after say 5-10 years of data is collected on them. Lots of Ads I guess!

Who searches for this Blog?

Statue of Michael Jackson in Eindhoven, the Ne...
Image via Wikipedia

Using WP- Stats I set about answering this question-

What search keywords lead here-

Clearly Michael Jackson is down this year

And R GUI, Data Mining is up.

How does that affect my writing- given I get almost 250 visitors by search engines alone daily- assume I write nothing on this blog from now on.

It doesnt- I still write what ever code or poem that comes to my mind. So it is hurtful people misunderstimate the effort in writing and jump to conclusions (esp if I write about a company- I am not on payroll of that company- just like if  I write about a poem- I am not a full time poet)

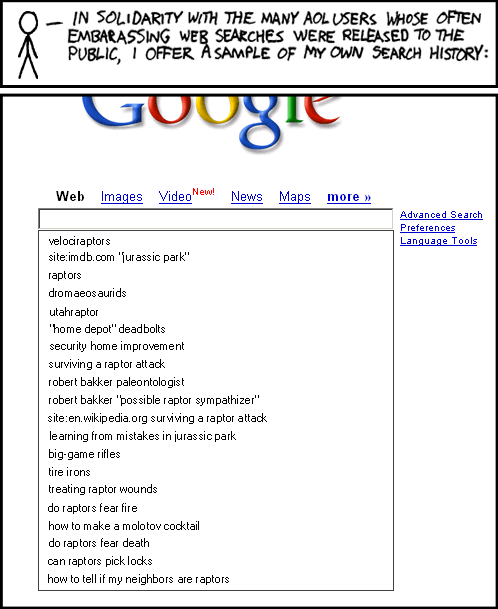
Over to xkcd

All Time (for Decisionstats.Wordpress.com)

Search Views
libre office 818
facebook analytics 806
michael jackson history 240
wps sas lawsuit 180
r gui 168
wps sas 154
wordle.net 118
sas wps 116
decision stats 110
sas wps lawsuit 100
google maps jet ski 94
data mining 88
doug savage 72
hive tutorial 63
spss certification 63
hadley wickham 63
google maps jetski 62
sas sues wps 60
decisionstats 58
donald farmer microsoft 45
libreoffice 44
wps statistics 44
best statistics software 42
r gui ubuntu 41
rstat 37
tamilnadu advanced technical training institute tatti 37

YTD

2009-11-24 to Today

Search Views
libre office 818
facebook analytics 781
wps sas lawsuit 170
r gui 164
wps sas 125
wordle.net 118
sas wps 101
sas wps lawsuit 95
google maps jet ski 94
data mining 86
decision stats 82
doug savage 63
hadley wickham 63
google maps jetski 62
hive tutorial 56
donald farmer microsoft 45

Interview Jamie Nunnelly NISS

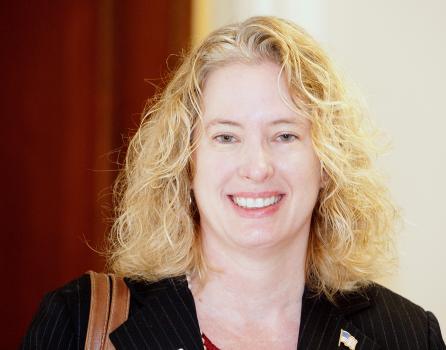
An interview with Jamie Nunnelly, Communications Director of National Institute of Statistical Sciences
Ajay– What does NISS do? And What does SAMSI do?

Jamie– The National Institute of Statistical Sciences (NISS) was established in 1990 by the national statistics societies and the Research Triangle universities and organizations, with the mission to identify, catalyze and foster high-impact, cross-disciplinary and cross-sector research involving the statistical sciences.

NISS is dedicated to strengthening and serving the national statistics community, most notably by catalyzing community members’ participation in applied research driven by challenges facing government and industry. NISS also provides career development opportunities for statisticians and scientists, especially those in the formative stages of their careers.

The Institute identifies emerging issues to which members of the statistics community can make key contributions, and then catalyzes the right combinations of researchers from multiple disciplines and sectors to tackle each problem. More than 300 researchers from over 100 institutions have worked on our projects.

The Statistical and Applied Mathematical Sciences Institute (SAMSI) is a partnership of Duke University,  North Carolina State University, The University of North Carolina at Chapel Hill, and NISS in collaboration with the William Kenan Jr. Institute for Engineering, Technology and Science and is part of the Mathematical Sciences Institutes of the NSF.

SAMSI focuses on 1-2 programs of research interest in the statistical and/or applied mathematical area and visitors from around the world are involved with the programs and come from a variety of disciplines in addition to mathematics and statistics.

Many come to SAMSI to attend workshops, and also participate in working groups throughout the academic year. Many of the working groups communicate via WebEx so people can be involved with the research remotely. SAMSI also has a robust education and outreach program to help undergraduate and graduate students learn about cutting edge research in applied mathematics and statistics.

Ajay– What successes have you had in 2010- and what do you need to succeed in 2011. Whats planned for 2011 anyway

Jamie– NISS has had a very successful collaboration with the National Agricultural Statistical Service (NASS) over the past two years that was just renewed for the next two years. NISS & NASS had three teams consisting of a faculty researcher in statistics, a NASS researcher, a NISS mentor, a postdoctoral fellow and a graduate student working on statistical modeling and other areas of research for NASS.

NISS is also working on a syndromic surveillance project with Clemson University, Duke University, The University of Georgia, The University of South Carolina. The group is currently working with some hospitals to test out a model they have been developing to help predict disease outbreak.

SAMSI had a very successful year with two programs ending this past summer, which were the Stochastic Dynamics program and the Space-time Analysis for Environmental Mapping, Epidemiology and Climate Change. Several papers were written and published and many presentations have been made at various conferences around the world regarding the work that was conducted as SAMSI last year.

Next year’s program is so big that the institute has decided to devote all it’s time and energy around it, which is uncertainty quantification. The opening workshop, in addition to the main methodological theme, will be broken down into three areas of interest under this broad umbrella of research: climate change, engineering and renewable energy, and geosciences.

Ajay– Describe your career in science and communication.

Jamie– I have been in communications since 1985, working for large Fortune 500 companies such as General Motors and Tropicana Products. I moved to the Research Triangle region of North Carolina after graduate school and got into economic development and science communications first working for the Research Triangle Regional Partnership in 1994.

From 1996-2005 I was the communications director for the Research Triangle Park, working for the Research Triangle Foundation of NC. I published a quarterly magazine called The Park Guide for awhile, then came to work for NISS and SAMSI in 2008.

I really enjoy working with the mathematicians and statisticians. I always joke that I am the least educated person working here and that is not far from the truth! I am honored to help get the message out about all of the important research that is conducted here each day that is helping to improve the lives of so many people out there.

Ajay– Research Triangle or Silicon Valley– Which is better for tech people and why? Your opinion

Jamie– Both the Silicon Valley and Research Triangle are great regions for tech people to locate, but of course, I have to be biased and choose Research Triangle!

Really any place in the world that you find many universities working together with businesses and government, you have an area that will grow and thrive, because the collaborations help all of us generate new ideas, many of which blossom into new businesses, or new endeavors of research.

The quality of life in places such as the Research Triangle is great because you have people from around the world moving to a place, each bringing his/her culture, food, and uniqueness to this place, and enriching everyone else as a result.

Two advantages the Research Triangle has over Silicon Valley are that the Research Triangle has a bigger diversity of industries, so when the telecommunications industry busted back in 2001-02, the region took a hit, but the biotechnology industry was still growing, so unemployment rose, but not to the extent that other areas might have experienced.

The latest recession has hit us all very hard, so even this strategy has not made us immune to having high unemployment, but the Research Triangle region has been pegged by experts to be one of the first regions to emerge out of the Great Recession.

The other advantage I think we have is that our cost of living is still much more reasonable than Silicon Valley. It’s still possible to get a nice sized home, some land and not break the bank!

Ajay– How do you manage an active online social media presence, your job and your family. How important is balance in professional life and when young professional should realize this?

Jamie– Balance is everything, isn’t it? When I leave the office, I turn off my iPhone and disconnect from Twitter/Facebook etc.

I know that is not recommended by some folks, but I am a one person communications department and I love my family and friends and feel its important to devote time to them as well as to my career.

I think it is very important for young people to establish this early in their careers because if they don’t they will fall victim to working way too many hours and really, who loves you at the end of the day?

Your company may appreciate all you do for them, but if you leave, or you get sick and cannot work for them, you will be replaced

. Lee Iacocca, former CEO of Chrystler, said, “No matter what you’ve done for yourself or for humanity, if you can’t look back on having given love and attention to your own family, what have you really accomplished?” I think that is what is really most important in life.

About-

Jamie Nunnelly has been in communications for 25 years. She is currently on the board of directors for Chatham County Economic Development Corporation and Leadership Triangle & is a member of the International Association of Business Communicators and the Public Relations Society of America. She earned a bachelor’s degree in interpersonal and public communications at Bowling Green State University and a master’s degree in mass communications at the University of South Florida.

You can contact Jamie at http://niss.org/content/jamie-nunnelly or on twitter at