XBRL is a member of the family of languages based on XML, or Extensible Markup Language, which is a standard for the electronic exchange of data between businesses and on the internet. Under XML, identifying tags are applied to items of data so that they can be processed efficiently by computer software.
XBRL is a powerful and flexible version of XML which has been defined specifically to meet the requirements of business and financial information. It enables unique identifying tags to be applied to items of financial data, such as ‘net profit’. However, these are more than simple identifiers. They provide a range of information about the item, such as whether it is a monetary item, percentage or fraction. XBRL allows labels in any language to be applied to items, as well as accounting references or other subsidiary information.
XBRL can show how items are related to one another. It can thus represent how they are calculated. It can also identify whether they fall into particular groupings for organisational or presentational purposes. Most importantly, XBRL is easily extensible, so companies and other organisations can adapt it to meet a variety of special requirements.
The rich and powerful structure of XBRL allows very efficient handling of business data by computer software. It supports all the standard tasks involved in compiling, storing and using business data. Such information can be converted into XBRL by suitable mapping processes or generated in XBRL by software. It can then be searched, selected, exchanged or analysed by computer, or published for ordinary viewing.
With more than 7,000 new U.S. companies facing extensible business reporting language (XBRL) filing mandates in 2011, Oracle has released a free XBRL extension on top of the latest release of Oracle Database.
Oracle’s XBRL extension leverages Oracle Database 11g Release 2 XML to manage the collection, validation, storage, and analysis of XBRL data. It enables organizations to create one or more back-end XBRL repositories based on Oracle Database, providing secure XBRL storage and query-ability with a set of XBRL-specific services.
In addition, the extension integrates easily with Oracle Business Intelligence Suite Enterprise Edition to provide analytics, plus interactive development environments (IDEs) and design tools for creating and editing XBRL taxonomies.
The Other Side of XBRL
“While the XBRL mandate continues to grow, the feedback we keep hearing from the ‘other side’ of XRBL—regulators, academics, financial analysts, and investors—is that they lack sufficient tools and historic data to leverage the full potential of XBRL,” says John O’Rourke, vice president of product marketing, Oracle.
However, O’Rourke says this is quickly changing as XBRL mandates enter their third year—and more and more companies have to comply. While the new extension should be attractive to organizations that produce XBRL filings, O’Rourke expects it will prove particularly valuable to regulators, stock exchanges, universities, and other organizations that need to collect, analyze, and disseminate XBRL-based filings.
Outsourcing, a Bolt-on Solution, or Integrated XBRL Tagging
Until recently, reporting organizations had to choose between expensive third-party outsourcing or manual, in-house tagging with bolt-on solutions— both of which introduce the possibility of error.
In response, Oracle launched Oracle Hyperion Disclosure Management, which provides an XBRL tagging solution that is integrated with the financial close and reporting process for fast and reliable XBRL report submission—without relying on third-party providers. The solution enables organizations to
Author regulatory filings in Microsoft Office and “hot link” them directly to financial reporting systems so they can be easily updated
Graphically perform XBRL tagging at several levels—within Microsoft Office, within EPM system reports, or in the data source metadata
Modify or extend XBRL taxonomies before the mapping process, as well as set up multiple taxonomies
Create and validate final XBRL instance documents before submission
Summary- Thats cloud computing scoring of models on EC2 (Zementis) partnering with the actual modeling software in R (Revolution Analytics RevoDeployR)
strategic partnership with Revolution Analytics, the leading commercial provider of software and support for the popular open source R statistics language. With this partnership, predictive models developed on Revolution R Enterprise are now accessible for real-time scoring through the ADAPA Decisioning Engine by Zementis.
ADAPA is an extremely fast and scalable predictive platform. Models deployed in ADAPA are automatically available for execution in real-time and batch-mode as Web Services. ADAPA allows Revolution R Enterprise to leverage the Predictive Model Markup Language (PMML) for better decision management. With PMML, models built in R can be used in a wide variety of real-world scenarios without requiring laborious or expensive proprietary processes to convert them into applications capable of running on an execution system.
“By partnering with Zementis, Revolution Analytics is building an end-to-end solution for moving enterprise-level predictive R models into the execution environment,” said Jeff Erhardt, Revolution Analytics Chief Operation Officer. “With Zementis, we are eliminating the need to take R applications apart and recode, retest and redeploy them in order to obtain desirable results.”
Got demo?
Yes, we do! Revolution Analytics and Zementis have put together a demo which combines the building of models in R with automatic deployment and execution in ADAPA. It uses Revolution Analytics’ RevoDeployR, a new Web Services framework that allows for data analysts working in R to publish R scripts to a server-based installation of Revolution R Enterprise.
RevoDeployR & ADAPA allow for real-time analysis and predictions from R to be effectively used by existing Excel spreadsheets, BI dashboards and Web-based applications, all in real-time.
Predictive analytics with RevoDeployR from Revolution Analytics and ADAPA from Zementis put model building and real-time scoring into a league of their own. Seriously!
and recently became aware of the R Pentaho integration.
“R” is a popular open source statistical and analytical language that academics and commercial organizations alike have used for years to get maximum insight out of information using advanced analytic techniques. In this twelve-minute video, David Reinke from Pentaho Certified Partner OpenBI provides an overview of R, as well as a demonstration of integration between R and Pentaho.
Carole-Ann’s 2011 Predictions for Decision Management
For Ajay Ohri on DecisionStats.com
What were the top 5 events in 2010 in your field?
Maturity: the Decision Management space was made up of technology vendors, big and small, that typically focused on one or two aspects of this discipline. Over the past few years, we have seen a lot of consolidation in the industry – first with Business Intelligence (BI) then Business Process Management (BPM) and lately in Business Rules Management (BRM) and Advanced Analytics. As a result the giant Platform vendors have helped create visibility for this discipline. Lots of tiny clues finally bubbled up in 2010 to attest of the increasing activity around Decision Management. For example, more products than ever were named Decision Manager; companies advertised for Decision Managers as a job title in their job section; most people understand what I do when I am introduced in a social setting!
Boredom: unfortunately, as the industry matures, inevitably innovation slows down… At the main BRMS shows we heard here and there complaints that the technology was stalling. We heard it from vendors like Red Hat (Drools) and we heard it from bored end-users hoping for some excitement at Business Rules Forum’s vendor panel. They sadly did not get it
Scrum: I am not thinking about the methodology there! If you have ever seen a rugby game, you can probably understand why this is the term that comes to mind when I look at the messy & confusing technology landscape. Feet blindly try to kick the ball out while superhuman forces are moving randomly the whole pack – or so it felt when I played! Business Users in search of Business Solutions are facing more and more technology choices that feel like comparing apples to oranges. There is value in all of them and each one addresses a specific aspect of Decision Management but I regret that the industry did not simplify the picture in 2010. On the contrary! Many buzzwords were created or at least made popular last year, creating even more confusion on a muddy field. A few examples: Social CRM, Collaborative Decision Making, Adaptive Case Management, etc. Don’t take me wrong, I *do* like the technologies. I sympathize with the decision maker that is trying to pick the right solution though.
Information: Analytics have been used for years of course but the volume of data surrounding us has been growing to unparalleled levels. We can blame or thank (depending on our perspective) Social Media for that. Sites like Facebook and LinkedIn have made it possible and easy to publish relevant (as well as fluffy) information in real-time. As we all started to get the hang of it and potentially over-publish, technology evolved to enable the storage, correlation and analysis of humongous volumes of data that we could not dream of before. 25 billion tweets were posted in 2010. Every month, over 30 billion pieces of data are shared on Facebook alone. This is not just about vanity and marketing though. This data can be leveraged for the greater good. Carlos pointed to some fascinating facts about catastrophic event response team getting organized thanks to crowd-sourced information. We are also seeing, in the Decision management world, more and more applicability for those very technology that have been developed for the needs of Big Data – I’ll name for example Hadoop that Carlos (yet again) discussed in his talks at Rules Fest end of 2009 and 2010.
Self-Organization: it may be a side effect of the Social Media movement but I must admit that I was impressed by the success of self-organizing initiatives. Granted, this last trend has nothing to do with Decision Management per se but I think it is a great evolution worth noting. Let me point to a couple of examples. I usually attend traditional conferences and tradeshows in which the content can be good but is sometimes terrible. I was pleasantly surprised by the professionalism and attendance at *un-conferences* such as P-Camp (P stands for Product – an event for Product Managers). When you think about it, it is already difficult to get a show together when people are dedicated to the tasks. How crazy is it to have volunteers set one up with no budget and no agenda? Well, people simply show up to do their part and everyone has fun voting on-site for what seems the most appealing content at the time. Crowdsourcing applied to shows: it works! Similar experience with meetups or tweetups. I also enjoyed attending some impromptu Twitter jam sessions on a given topic. Social Media is certainly helping people reach out and get together in person or virtually and that is wonderful!
Image via Wikipedia
What are the top three trends you see in 2011?
Performance: I might be cheating here. I was very bullish about predicting much progress for 2010 in the area of Performance Management in your Decision Management initiatives. I believe that progress was made but Carlos did not give me full credit for the right prediction… Okay, I am a little optimistic on timeline… I admit it… If it did not fully happen in 2010, can I predict it again in 2011? I think that companies want to better track their business performance in order to correct the trajectory of course but also to improve their projections. I see that it is turning into reality already here and there. I expect it to become a trend in 2011!
Insight: Big Data being available all around us with new technologies and algorithms will continue to propagate in 2011 leading to more widely spread Analytics capabilities. The buzz at Analytics shows on Social Network Analysis (SNA) is a sign that there is interest in those kinds of things. There is tremendous information that can be leveraged for smart decision-making. I think there will be more of that in 2011 as initiatives launches in 2010 will mature into material results.
Image by Intersection Consulting via Flickr
Collaboration: Social Media for the Enterprise is a discipline in the making. Social Media was initially seen for the most part as a Marketing channel. Over the years, companies have started experimenting with external communities and ideation capabilities with moderate success. The few strategic initiatives started in 2010 by “old fashion” companies seem to be an indication that we are past the early adopters. This discipline may very well materialize in 2011 as a core capability, well, or at least a new trend. I believe that capabilities such Chatter, offered by Salesforce, will transform (slowly) how people interact in the workplace and leverage the volumes of social data captured in LinkedIn and other Social Media sites. Collaboration is of course a topic of interest for me personally. I even signed up for Kare Anderson’s collaboration collaboration site – yes, twice the word “collaboration”: it is really about collaborating on collaboration techniques. Even though collaboration does not require Social Media, this medium offers perspectives not available until now.
Brief Bio-
Carole-Ann is a renowned guru in the Decision Management space. She created the vision for Decision Management that is widely adopted now in the industry. Her claim to fame is the strategy and direction of Blaze Advisor, the then-leading BRMS product, while she also managed all the Decision Management tools at FICO (business rules, predictive analytics and optimization). She has a vision for Decision Management both as a technology and a discipline that can revolutionize the way corporations do business, and will never get tired of painting that vision for her audience. She speaks often at Industry conferences and has conducted university classes in France and Washington DC.
Leveraging her Masters degree in Applied Mathematics / Computer Science from a “Grande Ecole” in France, she started her career building advanced systems using all kinds of technologies — expert systems, rules, optimization, dashboarding and cubes, web search, and beta version of database replication – as well as conducting strategic consulting gigs around change management.
She started her career building advanced systems using all kinds of technologies — expert systems, rules, optimization, dashboarding and cubes, web search, and beta version of database replication. At Cleversys (acquired by Kurt Salmon & Associates), she also conducted strategic consulting gigs mostly around change management.
While playing with advanced software components, she found a passion for technology and joined ILOG (acquired by IBM). She developed a growing interest in Optimization as well as Business Rules. At ILOG, she coined the term BRMS while brainstorming with her Sales counterpart. She led the Presales organization for Telecom in the Americas up until 2000 when she joined Blaze Software (acquired by Brokat Technologies, HNC Software and finally FICO).
Her 360-degree experience allowed her to gain appreciation for all aspects of a software company, giving her a unique perspective on the business. Her technical background kept her very much in touch with technology as she advanced.
She also became addicted to Twitter in the process. She is active on all kinds of social media, always looking for new digital experience!
Outside of work, Carole-Ann loves spending time with her two boys. They grow fruits in their Northern California home and cook all together in the French tradition.
Some common analytical tasks from the diary of the glamorous life of a business analyst-
1) removing duplicates from a dataset based on certain key values/variables
2) merging two datasets based on a common key/variable/s
3) creating a subset based on a conditional value of a variable
4) creating a subset based on a conditional value of a time-date variable
5) changing format from one date time variable to another
6) doing a means grouped or classified at a level of aggregation
7) creating a new variable based on if then condition
8) creating a macro to run same program with different parameters
9) creating a logistic regression model, scoring dataset,
10) transforming variables
11) checking roc curves of model
12) splitting a dataset for a random sample (repeatable with random seed)
13) creating a cross tab of all variables in a dataset with one response variable
14) creating bins or ranks from a certain variable value
15) graphically examine cross tabs
16) histograms
17) plot(density())
18)creating a pie chart
19) creating a line graph, creating a bar graph
20) creating a bubbles chart
21) running a goal seek kind of simulation/optimization
22) creating a tabular report for multiple metrics grouped for one time/variable
23) creating a basic time series forecast
and some case studies I could think of-
As the Director, Analytics you have to examine current marketing efficiency as well as help optimize sales force efficiency across various channels. In addition you have to examine multiple sales channels including inbound telephone, outgoing direct mail, internet email campaigns. The datawarehouse is an RDBMS but it has multiple data quality issues to be checked for. In addition you need to submit your budget estimates for next year’s annual marketing budget to maximize sales return on investment.
As the Director, Risk you have to examine the overdue mortgages book that your predecessor left you. You need to optimize collections and minimize fraud and write-offs, and your efforts would be measured in maximizing profits from your department.
As a social media consultant you have been asked to maximize social media analytics and social media exposure to your client. You need to create a mechanism to report particular brand keywords, as well as automated triggers between unusual web activity, and statistical analysis of the website analytics metrics. Above all it needs to be set up in an automated reporting dashboard .
As a consultant to a telecommunication company you are asked to monitor churn and review the existing churn models. Also you need to maximize advertising spend on various channels. The problem is there are a large number of promotions always going on, some of the data is either incorrectly coded or there are interaction effects between the various promotions.
As a modeller you need to do the following-
1) Check ROC and H-L curves for existing model
2) Divide dataset in random splits of 40:60
3) Create multiple aggregated variables from the basic variables
4) run regression again and again
5) evaluate statistical robustness and fit of model
6) display results graphically
All these steps can be broken down in little little pieces of code- something which i am putting down a list of.
Are there any common data analysis tasks that you think I am missing out- any common case studies ? let me know.
A message from Predictive Analytics World on newly available videos. It has many free videos as well so you can check them out.
Access PAW DC Session Videos Now
Predictive Analytics World is pleased to announce on-demand access to the videos of PAW Washington DC, October 2010, including over 30 sessions and keynotes that you may view at your convenience. Access this leading predictive analytics content online now:
Select individual conference sessions, or recognize savings by registering for access to one or two full days of sessions. These on-demand videos deliver PAW DC right to your desk, covering hot topics and advanced methods such as:
PAW DC videos feature over 25 speakers with case studies from leading enterprises such as: CIBC, CEB, Forrester, Macy’s, MetLife, Microsoft, Miles Kimball, Monster.com, Oracle, Paychex, SunTrust, Target, UPMC, Xerox, Yahoo!, YMCA, and more.
Keynote: Five Ways Predictive Analytics Cuts Enterprise Risk
Eric Siegel,Ph.D., Program Chair, Predictive Analytics World
All business is an exercise in risk management. All organizations would benefit from measuring, tracking and computing risk as a core process, much like insurance companies do.
Predictive analytics does the trick, one customer at a time. This technology is a data-driven means to compute the risk each customer will defect, not respond to an expensive mailer, consume a retention discount even if she were not going to leave in the first place, not be targeted for a telephone solicitation that would have landed a sale, commit fraud, or become a “loss customer” such as a bad debtor or an insurance policy-holder with high claims.
In this keynote session, Dr. Eric Siegel reveals:
– Five ways predictive analytics evolves your enterprise to reduce risk
– Hidden sources of risk across operational functions
– What every business should learn from insurance companies
– How advancements have reversed the very meaning of fraud
– Why “man + machine” teams are greater than the sum of their parts for enterprise decision support
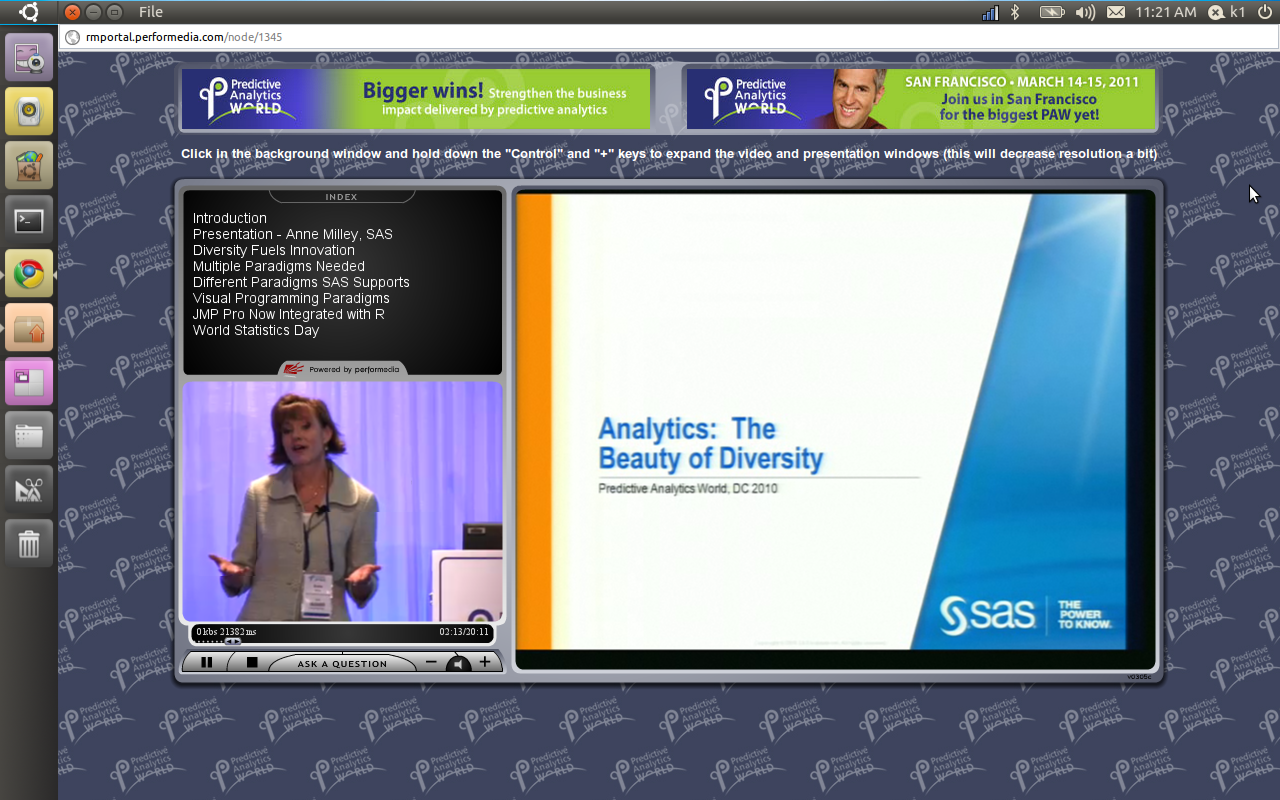
Platinum Sponsor Presentation: Analytics – The Beauty of Diversity
Anne H. Milley,Senior Director of Analytic Strategy, Worldwide Product Marketing, SAS
Analytics contributes to, and draws from, multiple disciplines. The unifying theme of “making the world a better place” is bred from diversity. For instance, the same methods used in econometrics might be used in market research, psychometrics and other disciplines. In a similar way, diverse paradigms are needed to best solve problems, reveal opportunities and make better decisions. This is why we evolve capabilities to formulate and solve a wide range of problems through multiple integrated languages and interfaces. Extending that, we have provided integration with other languages so that users can draw on the disciplines and paradigms needed to best practice their craft.
Gold Sponsor Presentation: Predictive Analytics Accelerate Insight for Financial Services
Finbarr Deely,Director of Business Development,ParAccel
Financial services organizations face immense hurdles in maintaining profitability and building competitive advantage. Financial services organizations must perform “what-if” scenario analysis, identify risks, and detect fraud patterns. The advanced analytic complexity required often makes such analysis slow and painful, if not impossible. This presentation outlines the analytic challenges facing these organizations and provides a clear path to providing the accelerated insight needed to perform in today’s complex business environment to reduce risk, stop fraud and increase profits. * The value of predictive analytics in Accelerating Insight * Financial Services Analytic Case Studies * Brief Overview of ParAccel Analytic Database
TOPIC: SURVEY ANALYSIS Case Study: YMCA Turning Member Satisfaction Surveys into an Actionable Narrative
Dean Abbott,President, Abbott Analytics
Employees are a key constituency at the Y and previous analysis has shown that their attitudes have a direct bearing on Member Satisfaction. This session will describe a successful approach for the analysis of YMCA employee surveys. Decision trees are built and examined in depth to identify key questions in describing key employee satisfaction metrics, including several interesting groupings of employee attitudes. Our approach will be contrasted with other factor analysis and regression-based approaches to survey analysis that we used initially. The predictive models described are currently in use and resulted in both greater understanding of employee attitudes, and a revised “short-form” survey with fewer key questions identified by the decision trees as the most important predictors.
TOPIC: INDUSTRY TRENDS 2010 Data Minter Survey Results: Highlights
Karl Rexer,Ph.D., Rexer Analytics
Do you want to know the views, actions, and opinions of the data mining community? Each year, Rexer Analytics conducts a global survey of data miners to find out. This year at PAW we unveil the results of our 4th Annual Data Miner Survey. This session will present the research highlights, such as:
Multiple Case Studies: U.S. DoD, U.S. DHS, SSA Text Mining: Lessons Learned
John F. Elder,Chief Scientist, Elder Research, Inc.
Text Mining is the “Wild West” of data mining and predictive analytics – the potential for gain is huge, the capability claims are often tall tales, and the “land rush” for leadership is very much a race.
In solving unstructured (text) analysis challenges, we found that principles from inductive modeling – learning relationships from labeled cases – has great power to enhance text mining. Dr. Elder highlights key technical breakthroughs discovered while working on projects for leading government agencies, including: Text Mining is the “Wild West” of data mining and predictive analytics – the potential for gain is huge, the capability claims are often tall tales, and the “land rush” for leadership is very much a race.
– Prioritizing searches for the Dept. of Homeland Security
– Quick decisions for Social Security Admin. disability
– Document discovery for the Dept. of Defense
– Disease discovery for the Dept. of Homeland Security
Keynote: How Target Gets the Most out of Its Guest Data to Improve Marketing ROI
Andrew Pole,Senior Manager, Media and Database Marketing, Target
In this session, you’ll learn how Target leverages its own internal guest data to optimize its direct marketing – with the ultimate goal of enhancing our guests’ shopping experience and driving in-store and online performance. You will hear about what guest data is available at Target, how and where we collect it, and how it is used to improve the performance and relevance of direct marketing vehicles. Furthermore, we will discuss Target’s development and usage of guest segmentation, response modeling, and optimization as means to suppress poor performers from mailings, determine relevant product categories and services for online targeted content, and optimally assign receipt marketing offers to our guests when offer quantities are limited.
Platinum Sponsor Presentation: Driving Analytics Into Decision Making
Jason Verlen,Director, SPSS Product Strategy & Management, IBM Software Group
Organizations looking to dramatically improve their business outcomes are turning to decision management, a convergence of technology and business processes that is used to streamline and predict the outcome of daily decision-making. IBM SPSS Decision Management technology provides the critical link between analytical insight and recommended actions. In this session you’ll learn how Decision Management software integrates analytics with business rules and business applications for front-line systems such as call center applications, insurance claim processing, and websites. See how you can improve every customer interaction, minimize operational risk, reduce fraud and optimize results.
TOPIC: DATA INFRASTRUCTURE AND INTEGRATION Case Study: Macy’s The world is not flat (even though modeling software has to think it is)
Paul Coleman,Director of Marketing Statistics, Macy’s Inc.
Software for statistical modeling generally use flat files, where each record represents a unique case with all its variables. In contrast most large databases are relational, where data are distributed among various normalized tables for efficient storage. Variable creation and model scoring engines are necessary to bridge data mining and storage needs. Development datasets taken from a sampled history require snapshot management. Scoring datasets are taken from the present timeframe and the entire available universe. Organizations, with significant data, must decide when to store or calculate necessary data and understand the consequences for their modeling program.
TOPIC: CUSTOMER VALUE Case Study: SunTrust When One Model Will Not Solve the Problem – Using Multiple Models to Create One Solution
Dudley Gwaltney,Group Vice President, Analytical Modeling, SunTrust Bank
In 2007, SunTrust Bank developed a series of models to identify clients likely to have large changes in deposit balances. The models include three basic binary and two linear regression models.
Based on the models, 15% of SunTrust clients were targeted as those most likely to have large balance changes. These clients accounted for 65% of the absolute balance change and 60% of the large balance change clients. The targeted clients are grouped into a portfolio and assigned to individual SunTrust Retail Branch. Since 2008, the portfolio generated a 2.6% increase in balances over control.
Using the SunTrust example, this presentation will focus on:
TOPIC: RESPONSE & CROSS-SELL Case Study: Paychex Staying One Step Ahead of the Competition – Development of a Predictive 401(k) Marketing and Sales Campaign
Jason Fox,Information Systems and Portfolio Manager,Paychex
In-depth case study of Paychex, Inc. utilizing predictive modeling to turn the tides on competitive pressures within their own client base. Paychex, a leading provider of payroll and human resource solutions, will guide you through the development of a Predictive 401(k) Marketing and Sales model. Through the use of sophisticated data mining techniques and regression analysis the model derives the probability a client will add retirement services products with Paychex or with a competitor. Session will include roadblocks that could have ended development and ROI analysis. Speaker: Frank Fiorille, Director of Enterprise Risk Management, Paychex Speaker: Jason Fox, Risk Management Analyst, Paychex
TOPIC: SEGMENTATION Practitioner: Canadian Imperial Bank of Commerce Segmentation Do’s and Don’ts
Daymond Ling,Senior Director, Modelling & Analytics,Canadian Imperial Bank of Commerce
The concept of Segmentation is well accepted in business and has withstood the test of time. Even with the advent of new artificial intelligence and machine learning methods, this old war horse still has its place and is alive and well. Like all analytical methods, when used correctly it can lead to enhanced market positioning and competitive advantage, while improper application can have severe negative consequences.
This session will explore what are the elements of success, and what are the worse practices that lead to failure. The relationship between segmentation and predictive modeling will also be discussed to clarify when it is appropriate to use one versus the other, and how to use them together synergistically.
TOPIC: SOCIAL DATA
Thought Leadership Social Network Analysis: Killer Application for Cloud Analytics
James Kobielus,Senior Analyst, Forrester Research
Social networks such as Twitter and Facebook are a potential goldmine of insights on what is truly going through customers´minds. Every company wants to know whether, how, how often, and by whom they´re being mentioned across the billowing new cloud of social media. Just as important, every company wants to influence those discussions in their favor, target new business, and harvest maximum revenue potential. In this session, Forrester analyst James Kobielus identifies fruitful applications of social network analysis in customer service, sales, marketing, and brand management. He presents a roadmap for enterprises to leverage their inline analytics initiatives and leverage high-performance data warehousing (DW) clouds and appliances in order to analyze shifting patterns of customer sentiment, influence, and propensity. Leveraging Forrester’s ongoing research in advanced analytics and customer relationship management, Kobielus will discuss industry trends, commercial modeling tools, and emerging best practices in social network analysis, which represents a game-changing new discipline in predictive analytics.
Trish Mathe,
Director of Database Marketing, Life Line Screening
While Life Line is successfully executing a US CRM roadmap, they are also beginning this same evolution abroad. They are beginning in the UK where Merkle procured data and built a response model that is pulling responses over 30% higher than competitors. This presentation will give an overview of the US CRM roadmap, and then focus on the beginning of their strategy abroad, focusing on the data procurement they could not get anywhere else but through Merkle and the successful modeling and analytics for the UK. Speaker: Ozgur Dogan, VP, Quantitative Solutions Group, Merkle Inc Speaker: Trish Mathe, Director of Database Marketing, Life Line Screening
TOPIC: SURVEY ANALYSIS Case Study: Forrester Making Survey Insights Addressable and Scalable – The Case Study of Forrester’s Technographics Benchmark Survey
Marketers use surveys to create enterprise wide applicable strategic insights to: (1) develop segmentation schemes, (2) summarize consumer behaviors and attitudes for the whole US population, and (3) use multiple surveys to draw unified views about their target audience. However, these insights are not directly addressable and scalable to the whole consumer universe which is very important when applying the power of survey intelligence to the one to one consumer marketing problems marketers routinely face. Acxiom partnered with Forrester Research, creating addressable and scalable applications of Forrester’s Technographics Survey and applied it successfully to a number of industries and applications.
TOPIC: HEALTHCARE Case Study: UPMC Health Plan A Predictive Model for Hospital Readmissions
Scott Zasadil,Senior Scientist, UPMC Health Plan
Hospital readmissions are a significant component of our nation’s healthcare costs. Predicting who is likely to be readmitted is a challenging problem. Using a set of 123,951 hospital discharges spanning nearly three years, we developed a model that predicts an individual’s 30-day readmission should they incur a hospital admission. The model uses an ensemble of boosted decision trees and prior medical claims and captures 64% of all 30-day readmits with a true positive rate of over 27%. Moreover, many of the ‘false’ positives are simply delayed true positives. 53% of the predicted 30-day readmissions are readmitted within 180 days.



 Follow me on Twitter