How to balance your online advertising and your offline conscience

Google in 1998, showing the original logo
Image via Wikipedia

I recently found an interesting example of  a website that both makes a lot of money and yet is much more efficient than any free or non profit. It is called ECOSIA

If you see a website that wants to balance administrative costs  plus have a transparent way to make the world better- this is a great example.

  • http://ecosia.org/how.php
  • HOW IT WORKS
    You search with Ecosia.
  • Perhaps you click on an interesting sponsored link.
  • The sponsoring company pays Bing or Yahoo for the click.
  • Bing or Yahoo gives the bigger chunk of that money to Ecosia.
  • Ecosia donates at least 80% of this income to support WWF’s work in the Amazon.
  • If you like what we’re doing, help us spread the word!
  • Key facts about the park:

    • World’s largest tropical forest reserve (38,867 square kilometers, or about the size of Switzerland)
    • Home to about 14% of all amphibian species and roughly 54% of all bird species in the Amazon – not to mention large populations of at least eight threatened species, including the jaguar
    • Includes part of the Guiana Shield containing 25% of world’s remaining tropical rainforests – 80 to 90% of which are still pristine
    • Holds the last major unpolluted water reserves in the Neotropics, containing approximately 20% of all of the Earth’s water
    • One of the last tropical regions on Earth vastly unaltered by humans
    • Significant contributor to climatic regulation via heat absorption and carbon storage


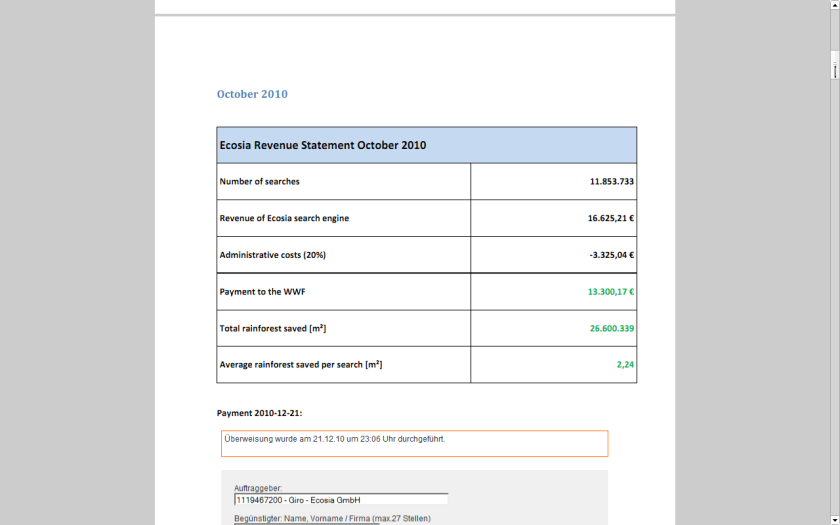
    http://ecosia.org/statistics.php

    They claim to have donated 141,529.42 EUR !!!

    http://static.ecosia.org/files/donations.pdf


    Well suppose you are the Web Admin of a very popular website like Wikipedia or etc

    One way to meet server costs is to say openly hey i need to balance my costs so i need some money.

    The other way is to use online advertising.

    I started mine with Google Adsense.

    Click per milli (or CPM)  gives you a very low low conversion compared to contacting ad sponsor directly.

    But its a great data experiment-

    as you can monitor which companies are likely to be advertised on your site (assume google knows more about their algols than you will)

    which formats -banner or text or flash have what kind of conversion rates

    what are the expected pay off rates from various keywords or companies (like business intelligence software, predictive analytics software and statistical computing software are similar but have different expected returns (if you remember your eco class)


    NOW- Based on above data, you know whats your minimum baseline to expect from a private advertiser than a public, crowd sourced search engine one (like Google or Bing)

    Lets say if you have 100000 views monthly. and assume one out of 1000 page views will lead to a click. Say the advertiser will pay you 1 $ for every 1 click (=1000 impressions)

    Then your expected revenue is $100.But if your clicks are priced at 2.5$ for every click , and your click through rate is now 3 out of 1000 impressions- (both very moderate increases that can done by basic placement optimization of ad type, graphics etc)-your new revenue is  750$.

    Be a good Samaritan- you decide to share some of this with your audience -like 4 Amazon books per month ( or I free Amazon book per week)- That gives you a cost of 200$, and leaves you with some 550$.

    Wait! it doesnt end there- Adam Smith‘s invisible hand moves on .

    You say hmm let me put 100 $ for an annual paper writing contest of $1000, donate $200 to one laptop per child ( or to Amazon rain forests or to Haiti etc etc etc), pay $100 to your upgraded server hosting, and put 350$ in online advertising. say $200 for search engines and $150 for Facebook.

    Woah!

    Month 1 would should see more people  visiting you for the first time. If you have a good return rate (returning visitors as a %, and low bounce rate (visits less than 5 secs)- your traffic should see atleast a 20% jump in new arrivals and 5-10 % in long term arrivals. Ignoring bounces- within  three months you will have one of the following

    1) An interesting case study on statistics on online and social media advertising, tangible motivations for increasing community response , and some good data for study

    2) hopefully better cost management of your server expenses

    3)very hopefully a positive cash flow


    you could even set a percentage and share the monthly (or annually is better actions) to your readers and advertisers.

    go ahead- change the world!

    the key paradigms here are sharing your traffic and revenue openly to everyone

    donating to a suitable cause

    helping increase awareness of the suitable cause

    basing fixed percentages rather than absolute numbers to ensure your site and cause are sustained for years.

    SAS X

    0o0 0O

    Tal G, creator of the rbloggers.com website, has created a new blog aggregator for SAS language users at http://sas-x.com/

    With almost 26 blogs joining there (I suspect many more should join , it seems like a good website to use for analytics users and students.  My favorite SAS Blog is http://statcompute.spaces.live.com/ – its pure code- little anything else.

    Related-

    SAS MACRO TO CALCULATE PDO (Points to Double Odds) OF A SCORECARD

    A SAS MACRO FOR DECISION STUMP

    A DEMO OF VECTOR AUTOREGRESSIVE FORECASTING MODEL


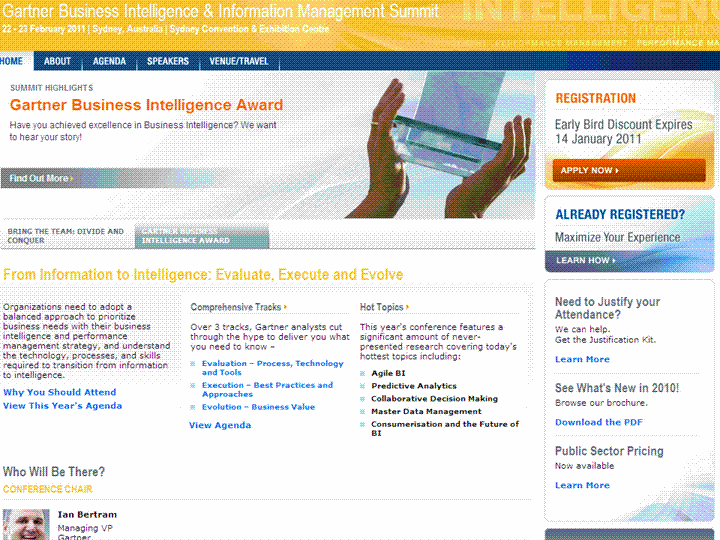
    Gartner BI and Inf Mgmt Summit 2011- 30 min One on Ones

    From the land Down Under, where Gartner gathers business summit thunder.

    http://www.gartner.com/technology/summits/apac/business-intelligence/index.jsp

    Gartner Business Intelligence
    & Information Management Summit 2011

    February 22 – 23 • Sydney, AUSTRALIA
    gartner.com/ap/bi

    Register Now

    From Information to Intelligence:

    Evaluate, Execute and Evolve

    At Gartner Business Intelligence & Information Management Summit 2011 you will experience a unique mix of Gartner research presentations, guest keynote addresses, real-life case studies and interactive panel discussions to provide you with a holistic view of the business intelligence and performance management landscape. Information, insight and advice are channeled through an increasingly targeted and focused approach, taking you from the high-level strategic view all the way to your specific issue.

    Click here to view the full agenda or download the brochure.

    AGENDA HIGHLIGHTS

    teamsend


    Guest Keynote Address

    Future Thinking – Global Trends and Thinking that are Upending your Business

    Anders Sorman-Nilsson
    Creative Director, Thinque

    Click here to read more about this session.

    Best Practice Workshops:

    • How to Become an Effective Data Warehouse Modeler
    • Analytics – Business Intelligence and Performance Management ITScore

    Analyst User Roundtables:

    • Enterprise Information Management – Focusing on What Matters to the Business
    • Sharepoint – thin edge of the wedge to the MS family
    • Preparing for the 2020 workplace

    Worldwide Expertise at Your Fingertips!
    Your questions on Business Intelligence and Performance Management answered. Meet the Gartner Analysts presenting at the Summit and book your exclusive 30 minute one-on-one ( lap top dance) with the Analysts of your choice.

    Brief Interview Timo Elliott

    Here is a brief interview with Timo Elliott.Timo Elliott is a 19-year veteran of SAP Business Objects.

    Ajay- What are the top 5 events in Business Integration and Data Visualization services you saw in 2010 and what are the top three trends you see in these in 2011.


    Timo-

    Top five events in 2010:

    (1) Back to strong market growth. IT spending plummeted last year (BI continued to grow, but more slowly than previous years). This year, organizations reopened their wallets and funded new analytics initiatives — all the signs indicate that BI market growth will be double that of 2009.

    (2) The launch of the iPad. Mobile BI has been around for years, but the iPad opened the floodgates of organizations taking a serious look at mobile analytics — and the easy-to-use, executive-friendly iPad dashboards have considerably raised the profile of analytics projects inside organizations.

    (3) Data warehousing got exciting again. Decades of incremental improvements (column databases, massively parallel processing, appliances, in-memory processing…) all came together with robust commercial offers that challenged existing data storage and calculation methods. And new “NoSQL” approaches, designed for the new problems of massive amounts of less-structured web data, started moving into the mainstream.

    (4) The end of Google Wave, the start of social BI.Google Wave was launched as a rethink of how we could bring together email, instant messaging, and social networks. While Google decided to close down the technology this year, it has left its mark, notably by influencing the future of “social BI”, with several major vendors bringing out commercial products this year.

    (5) The start of the big BI merge. While several small independent BI vendors reported strong growth, the major trend of the year was consolidation and integration: the BI megavendors (SAP, Oracle, IBM, Microsoft) increased their market share (sometimes by acquiring smaller vendors, e.g. IBM/SPSS and SAP/Sybase) and integrated analytics with their existing products, blurring the line between BI and other technology areas.

    Top three trends next year:

    (1) Analytics, reinvented. New DW techniques make it possible to do sub-second, interactive analytics directly against row-level operational data. Now BI processes and interfaces need to be rethought and redesigned to make best use of this — notably by blurring the distinctions between the “design” and “consumption” phases of BI.

    (2) Corporate and personal BI come together. The ability to mix corporate and personal data for quick, pragmatic analysis is a common business need. The typical solution to the problem — extracting and combining the data into a local data store (either Excel or a departmental data mart) — pleases users, but introduces duplication and extra costs and makes a mockery of information governance. 2011 will see the rise of systems that let individuals and departments load their data into personal spaces in the corporate environment, allowing pragmatic analytic flexibility without compromising security and governance.

    (3) The next generation of business applications. Where are the business applications designed to support what people really do all day, such as implementing this year’s strategy, launching new products, or acquiring another company? 2011 will see the first prototypes of people-focused, flexible, information-centric, and collaborative applications, bringing together the best of business intelligence, “enterprise 2.0”, and existing operational applications.

    And one that should happen, but probably won’t:

    (4) Intelligence = Information + PEOPLE. Successful analytics isn’t about technology — it’s about people, process, and culture. The biggest trend in 2011 should be organizations spending the majority of their efforts on user adoption rather than technical implementation.                 About- http://timoelliott.com/blog/about

    Timo Elliott is a 19-year veteran of SAP BusinessObjects, and has spent the last twenty years working with customers around the world on information strategy.

    He works closely with SAP research and innovation centers around the world to evangelize new technology prototypes.

    His popular Business Analytics and SAPWeb20 blogs track innovation in analytics and social media, including topics such as augmented corporate reality, collaborative decision-making, and social network analysis.

    His PowerPoint Twitter Tools lets presenters see and react to tweets in real time, embedded directly within their slides.

    A popular and engaging speaker, Elliott presents regularly to IT and business audiences at international conferences, on subjects such as why BI projects fail and what to do about it, and the intersection of BI and enterprise 2.0.

    Prior to Business Objects, Elliott was a computer consultant in Hong Kong and led analytics projects for Shell in New Zealand. He holds a first-class honors degree in Economics with Statistics from Bristol University, England. He blogs on http://timoelliott.com/blog/ (one of the best designed blogs in BI) . You can see more about him personal web site here and photo/sketch blog here. You should follow Timo at http://twitter.com/timoelliott

    Art Credit- Timo Elliott

    Related Articles

    Short Interview Jill Dyche

    Here is brief one question interview with Jill Dyche , founder Baseline Consulting.


    In 2010.


    • It was more about consciousness-raising in the executive suite—
    • getting C-level managers to understand the ongoing value proposition of BI,
    • why MDM isn’t their father’s database, and
    • how data governance can pay for itself over time.
    • Some companies succeeded with these consciousness-raising efforts. Some didn’t.


    But three big ones in 2011 would be:

    1. Predictive analytics in the cloud. The technology is now ready, and so is the market—and that includes SMB companies.
    2. Enterprise search being baked into (commoditized) BI software tools. (The proliferation of static reports is SO 2006!)
    3. Data governance will begin paying dividends. Until now it was all about common policies for data. In 2011, it will be about ROI.

    I do a “Predictions for the coming year” article every January for TDWI,

    Note- Jill ‘s January TDWI article seems worth waiting for in this case.

    About-

    Source-http://www.baseline-consulting.com/pages/page.asp?page_id=49125

    Partner and Co-Founder

    Jill Dyché is a partner and co-founder of Baseline Consulting.  She is responsible for key client strategies and market analysis in the areas of data governance, business intelligence, master data management, and customer relationship management. 

    Jill counsels boards of directors on the strategic importance of their information investments.

    Author

    Jill is the author of three books on the business value of IT. Jill’s first book, e-Data (Addison Wesley, 2000) has been published in eight languages. She is a contributor to Impossible Data Warehouse Situations: Solutions from the Experts (Addison Wesley, 2002), and her book, The CRM Handbook (Addison Wesley, 2002), is the bestseller on the topic. 

    Jill’s work has been featured in major publications such as Computerworld, Information Week, CIO Magazine, the Wall Street Journal, the Chicago Tribune and Newsweek.com. Jill’s latest book, Customer Data Integration (John Wiley and Sons, 2006) was co-authored with Baseline partner Evan Levy, and shows the business breakthroughs achieved with integrated customer data.

    Industry Expert

    Jill is a featured speaker at industry conferences, university programs, and vendor events. She serves as a judge for several IT best practice awards. She is a member of the Society of Information Managementand Women in Technology, a faculty member of TDWI, and serves as a co-chair for the MDM Insight conference. Jill is a columnist for DM Review, and a blogger for BeyeNETWORK and Baseline Consulting.


    Brief Interview with James G Kobielus

    Here is a brief one question interview with James Kobielus, Senior Analyst, Forrester.

    Ajay-Describe the five most important events in Predictive Analytics you saw in 2010 and the top three trends in 2011 as per you.

    Jim-

    Five most important developments in 2010:

    • Continued emergence of enterprise-grade Hadoop solutions as the core of the future cloud-based platforms for advanced analytics
    • Development of the market for analytic solution appliances that incorporate several key features for advanced analytics: massively parallel EDW appliance, in-database analytics and data management function processing, embedded statistical libraries, prebuilt logical domain models, and integrated modeling and mining tools
    • Integration of advanced analytics into core BI platforms with user-friendly, visual, wizard-driven, tools for quick, exploratory predictive modeling, forecasting, and what-if analysis by nontechnical business users
    • Convergence of predictive analytics, data mining, content analytics, and CEP in integrated tools geared  to real-time social media analytics
    • Emergence of CRM and other line-of-business applications that support continuously optimized “next-best action” business processes through embedding of predictive models, orchestration engines, business rules engines, and CEP agility

    Three top trends I see in the coming year, above and beyond deepening and adoption of the above-bulleted developments:

    • All-in-memory, massively parallel analytic architectures will begin to gain a foothold in complex EDW environments in support of real-time elastic analytics
    • Further crystallization of a market for general-purpose “recommendation engines” that, operating inline to EDWs, CEP environments, and BPM platforms, enable “next-best action” approaches to emerge from today’s application siloes
    • Incorporation of social network analysis functionality into a wider range of front-office business processes to enable fine-tuned behavioral-based customer segmentation to drive CRM optimization

    About –http://www.forrester.com/rb/analyst/james_kobielus

    James G. Kobielus
    Senior Analyst, Forrester Research

    RESEARCH FOCUS

    James serves Business Process & Applications professionals. He is a leading expert on data warehousing, predictive analytics, data mining, and complex event processing. In addition to his core coverage areas, James contributes to Forrester’s research in business intelligence, data integration, data quality, and master data management.

    PREVIOUS WORK EXPERIENCE

    James has a long history in IT research and consulting and has worked for both vendors and research firms. Most recently, he was at Current Analysis, an IT research firm, where he was a principal analyst covering topics ranging from data warehousing to data integration and the Semantic Web. Prior to that position, James was a senior technical systems analyst at Exostar (a hosted supply chain management and eBusiness hub for the aerospace and defense industry). In this capacity, James was responsible for identifying and specifying product/service requirements for federated identity, PKI, and other products. He also worked as an analyst for the Burton Group and was previously employed by LCC International, DynCorp, ADEENA, International Center for Information Technologies, and the North American Telecommunications Association. He is both well versed and experienced in product and market assessments. James is a widely published business/technology author and has spoken at many industry events

    Quantifying Analytics ROI

    Japanese House Crest “Go-Shichi no Kiri”
    Image via Wikipedia

    I had a brief twitter exchange with Jim Davis, Chief Marketing Officer, SAS Institute on Return of Investment on Business Analytics Projects for customers. I have interviewed Jim Davis before last year https://decisionstats.com/2009/06/05/interview-jim-davis-sas-institute/

    Now Jim Davis is a big guy, and he is rushing from the launch of SAS Institute’s Social Media Analytics in Japan- to some arguably difficult flying conditions in time to be home in America for Thanksgiving. That and and I have not been much of a good Blog Boy recently, more swayed by love of open source, than love of software per se. I love equally, given I am bad at both equally.

    Anyways, Jim’s contention  ( http://twitter.com/Davis_Jim ) was customers should go in business analytics only if there is Positive Return on Investment.  I am quoting him here-

    What is important is that there be a positive ROI on each and every BA project. Otherwise don’t do it.

    That’s not the marketing I was taught in my business school- basically it was sell, sell, sell.

    However I see most BI sales vendors also go through -let me meet my sales quota for this quarter- and quantifying customer ROI is simple maths than predictive analytics but there seems to be some information assymetry in it.

    Here is a paper from North Western University on ROI in IT projects-.

    but overall it would be in the interest of customers and Business Analytics Vendors to publish aggregated ROI.

    The opponents to this transparency in ROI would be market leaders in market share, who have trapped their customers by high migration costs (due to complexity) or contractually.

    A recent study listed Oracle having a large percentage of unhappy customers who would still renew!, SAP had problems when it raised prices for licensing arbitrarily (that CEO is now CEO of HP and dodging legal notices from Oracle).

    Indeed Jim Davis’s famous unsettling call for focusing on Business Analytics,as Business Intelligence is dead- that call has been implemented more aggressively by IBM in analytical acquisitions than even SAS itself which has been conservative about inorganic growth. Quantifying ROI, should theoretically aid open source software the most (since they are cheapest in up front licensing) or newer technologies like MapReduce /Hadoop (since they are quite so fast)- but I think that market has a way of factoring in these things- and customers are not as foolish neither as unaware of costs versus benefits of migration.

    The contrary to this is Business Analytics and Business Intelligence are imperfect markets with duo-poly  or big players thriving in absence of customer regulation.

    You get more protection as a customer of $20 bag of potato chips, than as a customer of a $200,000 software. Regulators are wary to step in to ensure ROI fairness (since most bright techies are qither working for private sector, have their own startup or invested in startups)- who in Govt understands Analytics and Intelligence strong enough to ensure vendor lock-ins are not done, and market flexibility is done. It is also a lower choice for embattled regulators to ensure ROI on enterprise software unlike the aggressiveness they have showed in retail or online software.

    Who will Analyze the Analysts and who can quantify the value of quants (or penalize them for shoddy quantitative analytics)- is an interesting phenomenon we expect to see more of.