Some ways to test and use cloud computing for free for yourself-
- Windows Azure
- Amazon Ec2
- Google Storage
The folks at Microsoft Azure announced a 90 day free trial Continue reading “Cloud Computing by Windows , Amazon and Google for free”

Some ways to test and use cloud computing for free for yourself-
The folks at Microsoft Azure announced a 90 day free trial Continue reading “Cloud Computing by Windows , Amazon and Google for free”
Using a virtual partition is slightly better than using a dual boot system. That is because you can keep the specialized operating system (usually Linux) within the main operating system (usually Windows), browse and alternate between the two operating system just using a simple command, and can utilize the advantages of both operating system.
Also you can create project specific discs for enhanced security.
In my (limited ) Mac experience, the comparisons of each operating system are-
1) Mac- Both robust and aesthetically designed OS, the higher price and hardware-lockin for Mac remains a disadvantage. Also many stats and analytical software just wont work on the Mac
2) Windows- It is cheaper than Mac and easier to use than Linux. Also has the most compatibility with applications (usually when not crashing)
3) Linux- The lightest and most customized software in the OS class, free to use, and has many lite versions for newbies. Not compatible with mainstream corporate IT infrastructure as of 2011.
I personally use VMWare Player for creating the virtual disk (as much more convenient than the wubi.exe method) from http://www.vmware.com/support/product-support/player/ (and downloadable from http://downloads.vmware.com/d/info/desktop_downloads/vmware_player/3_0)
That enables me to use Ubuntu on the alternative OS- keeping my Windows 7 for some Windows specific applications . For software like Rattle, the R data mining GUI , it helps to use two operating systems, in view of difficulties in GTK+.
Installing Rattle on Windows 7 is a major pain thanks to backward compatibility issues and version issues of GTK, but it installs on Ubuntu like a breeze- and it is very very convenient to switch between the two operating systems
Download Rattle from http://rattle.togaware.com/ and test it on the dual OS arrangement to see yourself.
Here is a great website for sharing workflows – it is called MyExperiment.org and it can also include Work flows from many software.
myExperiment currently has 4742 members, 270 groups, 1842 workflows, 423 files and 173 packs
Could it also include workflow from Red-R from #rstats or Enterprise Miner
From the nice shiny blog at http://blog.rstudio.org/, a shiny new upgraded software (and I used the Cobalt theme)–this is nice!
awesome coding!!!


Based on the official email from them, God bless the merry coders at Revo-
Revolution Analytics has just released Revolution R Enterprise 4.3 for 32-bit and 64-bit Windows, a significant step forward in enterprise data analytics. It features an updated RevoScaleR package for scalable, fast (multicore), and extensible data analysis with R. Revolution R Enterprise 4.3 for Windows also provides R 2.12.2, and includes an enhanced R Productivity Environment (RPE), a full-featured integrated development environment with visual debugging capabilities. Also available is an updated Windows release of our deployment server solution, RevoDeployR 1.2, designed to help you deliver R analytics via the Web.
As a registered user of the Academic version of Revolution R Enterprise for Windows, you can take advantage of these improvements by downloading and installing Revolution R Enterprise 4.3 today. You can install Revolution R Enterprise 4.3 side-by-side with your existing Revolution R Enterprise installations; there is no need to uninstall previous versions.
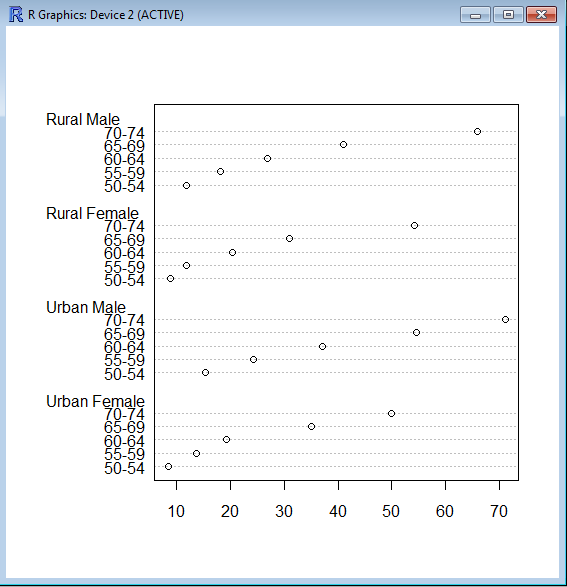
Basically a bar chart shows rectangular bars with length proportional to the quantities being described. It helps to see relative quantities between various category types.
The barplot() command is used for making Bar Plots, while hist() is used for histograms. You can also use the plot() command with type=h to create histograms-The official R manual also suggests that Dot plots using dotchart () are a reasonable substitute for bar plots.
A very simple easy to understand tutorial for basic bar plots is at http://msenux.redwoods.edu/math/R/barplot.php
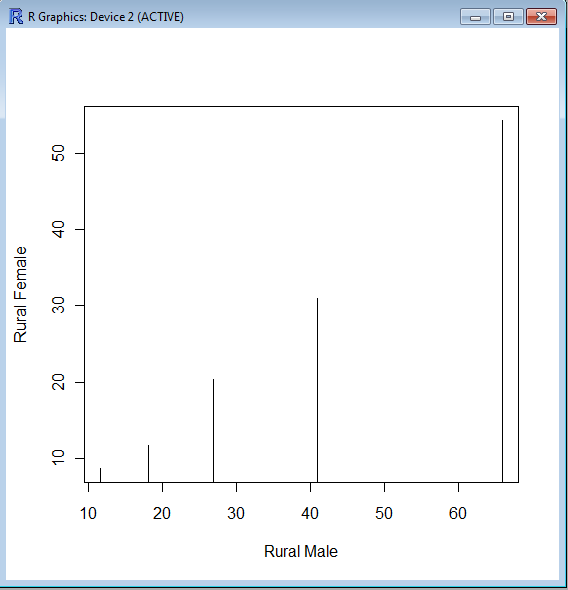
The difference between the three main functions that can be used for these charts are shown below-
> VADeaths
Rural Male Rural Female Urban Male Urban Female
50-54 11.7 8.7 15.4 8.4
55-59 18.1 11.7 24.3 13.6
60-64 26.9 20.3 37.0 19.3
65-69 41.0 30.9 54.6 35.1
70-74 66.0 54.3 71.1 50.0
> plot(VADeaths,type=”h”)
3 years ago, in a mock article I speculated what happened if Microsoft followed Google, and gave away Windows/Office for free while showing you ads. Basically whats the value of a single customer for 3-4 years worth of ads.
https://decisionstats.com/2008/02/02/ballmer-yahoo-googles-boo-hoo-2/
Well it seems like Windows 7, and Microsoft Word have made a quiet move to showing ads OUT of the browser and into the desktop program.
See screnshot on Windows 7, when even a simple Rich text document shows an ad for slidefest/powerpoint. Continue reading “Microsoft works on ad supported desktop programs”