Trying out Google Prediction API from R

Ubuntu Login
Image via Wikipedia

So I saw the news at NY R Meetup and decided to have a go at Prediction API Package (which first started off as a blog post at

http://onertipaday.blogspot.com/2010/11/r-wrapper-for-google-prediction-api.html

1)My OS was Ubuntu 10.10 Netbook

Ubuntu has a slight glitch plus workaround for installing the RCurl package on which the Google Prediction API is dependent- you need to first install this Ubuntu package for RCurl to install libcurl4-gnutls-dev

Once you install that using Synaptic,

Simply start R

2) Install Packages rjson and Rcurl using install.packages and choosing CRAN

Since GooglePredictionAPI is not yet on CRAN

,

3) Download that package from

https://code.google.com/p/google-prediction-api-r-client/downloads/detail?name=googlepredictionapi_0.1.tar.gz&can=2&q=

You need to copy this downloaded package to your “first library ” folder

When you start R, simply run

.libPaths()[1]

and thats the folder you copy the GooglePredictionAPI package  you downloaded.

5) Now the following line works

  1. Under R prompt,
  2. > install.packages("googlepredictionapi_0.1.tar.gz", repos=NULL, type="source")

6) Uploading data to Google Storage using the GUI (rather than gs util)

Just go to https://sandbox.google.com/storage/

and thats the Google Storage manager

Notes on Training Data-

Use a csv file

The first column is the score column (like 1,0 or prediction score)

There are no headers- so delete headers from data file and move the dependent variable to the first column  (Note I used data from the kaggle contest for R package recommendation at

http://kaggle.com/R?viewtype=data )

6) The good stuff:

Once you type in the basic syntax, the first time it will ask for your Google Credentials (email and password)

It then starts showing you time elapsed for training.

Now you can disconnect and go off (actually I got disconnected by accident before coming back in a say 5 minutes so this is the part where I think this is what happened is why it happened, dont blame me, test it for yourself) –

and when you come back (hopefully before token expires)  you can see status of your request (see below)

> library(rjson)
> library(RCurl)
Loading required package: bitops
> library(googlepredictionapi)
> my.model <- PredictionApiTrain(data="gs://numtraindata/training_data")
The request for training has sent, now trying to check if training is completed
Training on numtraindata/training_data: time:2.09 seconds
Training on numtraindata/training_data: time:7.00 seconds

7)

Note I changed the format from the URL where my data is located- simply go to your Google Storage Manager and right click on the file name for link address  ( https://sandbox.google.com/storage/numtraindata/training_data.csv)

to gs://numtraindata/training_data  (that kind of helps in any syntax error)

8) From the kind of high level instructions at  https://code.google.com/p/google-prediction-api-r-client/, you could also try this on a local file

Usage

## Load googlepredictionapi and dependent libraries
library(rjson)
library(RCurl)
library(googlepredictionapi)

## Make a training call to the Prediction API against data in the Google Storage.
## Replace MYBUCKET and MYDATA with your data.
my.model <- PredictionApiTrain(data="gs://MYBUCKET/MYDATA")

## Alternatively, make a training call against training data stored locally as a CSV file.
## Replace MYPATH and MYFILE with your data.
my.model <- PredictionApiTrain(data="MYPATH/MYFILE.csv")

At the time of writing my data was still getting trained, so I will keep you posted on what happens.

Test drive a Chrome notebook.

The United States
Image via Wikipedia

Wanna test out the new Chrome OS.

Go to https://services.google.com/fb/forms/cr48basic/

and fill the form

Chrome

Test drive a Chrome notebook.

We have a limited number of Chrome notebooks to distribute, and we need to ensure that they find good homes. That’s where you come in. Everything is still very much a work in progress, and it’s users, like you, that often give us our best ideas about what feels clunky or what’s missing. So if you live in the United States, are at least 18 years old, and would like to be considered for our small Pilot program, please fill this out. We’ll review the requests that come in and contact you if you’ve been selected.

https://services.google.com/fb/forms/cr48basic/


EU files anti trust against Google to reduce budget deficit

From the Old Lady-

http://www.nytimes.com/2010/12/01/technology/01google.html?_r=1&hpw

Google’s dominance on the Internet has been a sore point in Europe, where it controls more than 80 percent of the online search market, compared with about 66 percent in the United States, according to comScore, a research firm.

and

If Google is found in violation of European competition law, the commission has the power to fine it up to 10 percent of its annual revenue, which totaled more than $23 billion last year.

Before settling last year, Microsoft had paid fines of about $2.4 billion over the past decade in a long-running antitrust case in Brussels that focused on the Windows operating system.

In another case, the commission fined Intel about $1.45 billion for abusing its dominance in the computer chip market.


——————————————————————————————

Maybe Google should ask the European Union to buy a groupon for anti trust cases.

Related

11 Ways to Beat Google


AsterData partners with Tableau

This chart represents several constituent comp...
Image via Wikipedia

Tableau which has been making waves recntly with its great new data visualization tool announced a partner with my old friends at AsterData. Its really cool piece of data vis and very very fast on the desktop- so I can imagine what speed it can help with AsterData’s MPP Row and Column Zingbang AND Parallel Analytical Functions

Tableau and AsterData also share the common Stanfordian connection (but it seems software is divided quite equally between Stanford, Hardvard Dropouts and North Carolina )

It remains to be seen in this announcement how much each company  can leverage the partnership or whether it turns like the SAS Institute- AsterData partnership last year or whether it is just to announce connectors in their software to talk to each other.

See a Tableau vis at

http://public.tableausoftware.com/views/geographyofdiabetes/Dashboard2?:embed=yes&:toolbar=yes

AsterData remains the guys with the potential but I would be wrong to say MapReduceSQL is as hot in December 2010 as it was in June 2009- and the elephant in the room would be Hadoop. That and Google’s continued shyness from encashing its principal comptency of handling Big Data (but hush – I signed a NDA with the Google Prediction API– so things maaaay change very rapidly on ahem that cloud)

Disclaimer- AsterData was my internship sponsor during my winter training while at Univ of  Tenn.


PAWCON Bay Area March

The biggest Predictive Analytics Conference comes back to the SF Bay in March next year.

From

http://www.predictiveanalyticsworld.com/sanfrancisco/2011/

Predictive Analytics World March 2011 in San Francisco is packed with the top predictive analytics experts, practitioners, authors and business thought leaders, including keynote speakers:


Sugato Basu, Ph.D.
Senior Research Scientist
Google
Lessons Learned in Predictive Modeling 
for Ad Targeting

Eric Siegel, Ph.D.
Conference Chair
Predictive Analytics World
Five Ways Predictive Analytics
Cuts Enterprise Risk


Plus special plenary sessions from industry heavy-weights:


Andreas S. Weigend, Ph.D.
weigend.com
Former Chief Scientist, Amazon.com
The State of the Social Data Revoltion

John F. Elder, Ph.D.
CEO and Founder
Elder Research
Data Mining Lessons Learned


Predictive Analytics World focuses on concrete examples of deployed predictive analytics. Hear from the horse’s mouth precisely how Fortune 500 analytics competitors and other top practitioners deploy predictive modeling, and what kind of business impact it delivers. Click here to view the agenda at-a-glance.

PAW SF 2011 will feature speakers with case studies from leading enterprises. such as:

PAW’s March agenda covers hot topics and advanced methods such as uplift (net lift) modeling, ensemble models, social data, search marketing, crowdsourcing, blackbox trading, fraud detection, risk management, survey analysis and otherinnovative applications that benefit organizations in new and creative ways.

Join PAW and access the best keynotes, sessions, workshops, exposition, expert panel, live demos, networking coffee breaks, reception, birds-of-a-feather lunches, brand-name enterprise leaders, and industry heavyweights in the business.


Brief Interview Timo Elliott

Here is a brief interview with Timo Elliott.Timo Elliott is a 19-year veteran of SAP Business Objects.

Ajay- What are the top 5 events in Business Integration and Data Visualization services you saw in 2010 and what are the top three trends you see in these in 2011.


Timo-

Top five events in 2010:

(1) Back to strong market growth. IT spending plummeted last year (BI continued to grow, but more slowly than previous years). This year, organizations reopened their wallets and funded new analytics initiatives — all the signs indicate that BI market growth will be double that of 2009.

(2) The launch of the iPad. Mobile BI has been around for years, but the iPad opened the floodgates of organizations taking a serious look at mobile analytics — and the easy-to-use, executive-friendly iPad dashboards have considerably raised the profile of analytics projects inside organizations.

(3) Data warehousing got exciting again. Decades of incremental improvements (column databases, massively parallel processing, appliances, in-memory processing…) all came together with robust commercial offers that challenged existing data storage and calculation methods. And new “NoSQL” approaches, designed for the new problems of massive amounts of less-structured web data, started moving into the mainstream.

(4) The end of Google Wave, the start of social BI.Google Wave was launched as a rethink of how we could bring together email, instant messaging, and social networks. While Google decided to close down the technology this year, it has left its mark, notably by influencing the future of “social BI”, with several major vendors bringing out commercial products this year.

(5) The start of the big BI merge. While several small independent BI vendors reported strong growth, the major trend of the year was consolidation and integration: the BI megavendors (SAP, Oracle, IBM, Microsoft) increased their market share (sometimes by acquiring smaller vendors, e.g. IBM/SPSS and SAP/Sybase) and integrated analytics with their existing products, blurring the line between BI and other technology areas.

Top three trends next year:

(1) Analytics, reinvented. New DW techniques make it possible to do sub-second, interactive analytics directly against row-level operational data. Now BI processes and interfaces need to be rethought and redesigned to make best use of this — notably by blurring the distinctions between the “design” and “consumption” phases of BI.

(2) Corporate and personal BI come together. The ability to mix corporate and personal data for quick, pragmatic analysis is a common business need. The typical solution to the problem — extracting and combining the data into a local data store (either Excel or a departmental data mart) — pleases users, but introduces duplication and extra costs and makes a mockery of information governance. 2011 will see the rise of systems that let individuals and departments load their data into personal spaces in the corporate environment, allowing pragmatic analytic flexibility without compromising security and governance.

(3) The next generation of business applications. Where are the business applications designed to support what people really do all day, such as implementing this year’s strategy, launching new products, or acquiring another company? 2011 will see the first prototypes of people-focused, flexible, information-centric, and collaborative applications, bringing together the best of business intelligence, “enterprise 2.0”, and existing operational applications.

And one that should happen, but probably won’t:

(4) Intelligence = Information + PEOPLE. Successful analytics isn’t about technology — it’s about people, process, and culture. The biggest trend in 2011 should be organizations spending the majority of their efforts on user adoption rather than technical implementation.                 About- http://timoelliott.com/blog/about

Timo Elliott is a 19-year veteran of SAP BusinessObjects, and has spent the last twenty years working with customers around the world on information strategy.

He works closely with SAP research and innovation centers around the world to evangelize new technology prototypes.

His popular Business Analytics and SAPWeb20 blogs track innovation in analytics and social media, including topics such as augmented corporate reality, collaborative decision-making, and social network analysis.

His PowerPoint Twitter Tools lets presenters see and react to tweets in real time, embedded directly within their slides.

A popular and engaging speaker, Elliott presents regularly to IT and business audiences at international conferences, on subjects such as why BI projects fail and what to do about it, and the intersection of BI and enterprise 2.0.

Prior to Business Objects, Elliott was a computer consultant in Hong Kong and led analytics projects for Shell in New Zealand. He holds a first-class honors degree in Economics with Statistics from Bristol University, England. He blogs on http://timoelliott.com/blog/ (one of the best designed blogs in BI) . You can see more about him personal web site here and photo/sketch blog here. You should follow Timo at http://twitter.com/timoelliott

Art Credit- Timo Elliott

Related Articles

Tale of Two Analytical Interfaces

Occam’s razor (or Ockham’s razor[1]) is often expressed in Latin as the lex parsimoniae(translating to the law of parsimonylaw of economy or law of succinctness). The principle is popularly summarized as “the simplest explanation is more likely the correct one.

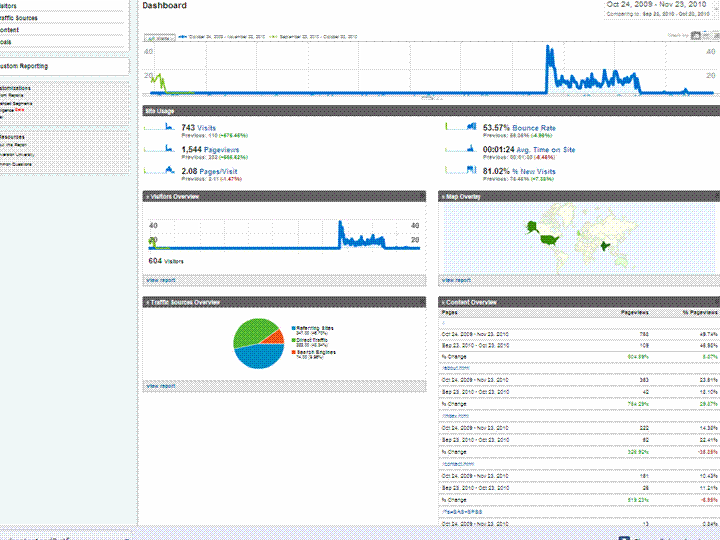
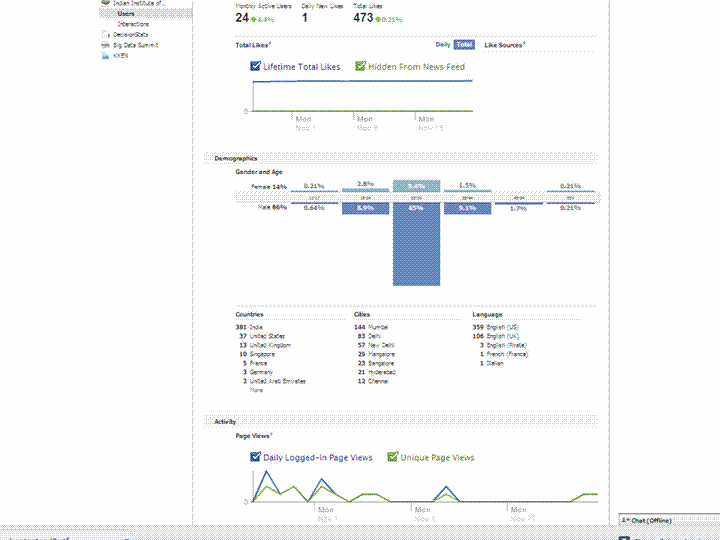
Using a simple screenshot- you can see Facebook Analytics for a Facebook page is simpler at explaining who is coming to visit rather than Google Analytics Dashboard (which has not seen the attention of a Visual UI or Graphic Redesign)

And if Facebook is going to take over the internet, well it is definitely giving better analytics in the process. What do you think?

Which Interface is simpler- and gives you better targeting. Ignore the numbers and just see the metrics measured and the way they are presented. Coincidently R is used at Facebook a lot (which has given the jjplot package)- and Google has NOT INVESTED MAJOR MONEY in creating Premium R Packages or Big Data Packages. I am talking investment at the scale Google is known for- not measly meetups.

(the summer of code dont count- it is for students mostly)

(but thanks for the Pizza G Men- and maybe revise that GA interface by putting a razor to some metrics)

GA vs Facebook Analytics