R for Predictive Modeling:Workshop

A view of the Oakland-San Francisco Bay Bridge...
Image via Wikipedia

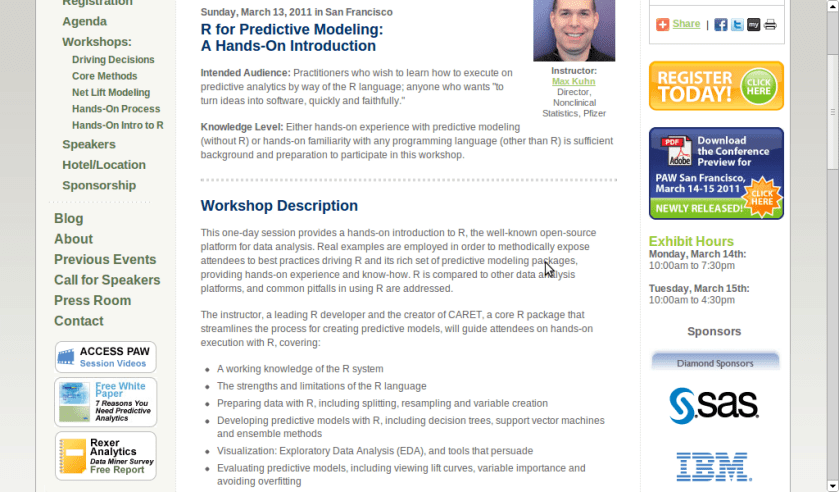
A workshop on using R for Predictive Modeling, by the Director, Non Clinical Stats, Pfizer. Interesting Bay Area Event- part of next edition of Predictive Analytics World

Sunday, March 13, 2011 in San Francisco

R for Predictive Modeling:
A Hands-On Introduction

Intended Audience: Practitioners who wish to learn how to execute on predictive analytics by way of the R language; anyone who wants “to turn ideas into software, quickly and faithfully.”

Knowledge Level: Either hands-on experience with predictive modeling (without R) or hands-on familiarity with any programming language (other than R) is sufficient background and preparation to participate in this workshop.


Workshop Description

This one-day session provides a hands-on introduction to R, the well-known open-source platform for data analysis. Real examples are employed in order to methodically expose attendees to best practices driving R and its rich set of predictive modeling packages, providing hands-on experience and know-how. R is compared to other data analysis platforms, and common pitfalls in using R are addressed.

The instructor, a leading R developer and the creator of CARET, a core R package that streamlines the process for creating predictive models, will guide attendees on hands-on execution with R, covering:

  • A working knowledge of the R system
  • The strengths and limitations of the R language
  • Preparing data with R, including splitting, resampling and variable creation
  • Developing predictive models with R, including decision trees, support vector machines and ensemble methods
  • Visualization: Exploratory Data Analysis (EDA), and tools that persuade
  • Evaluating predictive models, including viewing lift curves, variable importance and avoiding overfitting

Hardware: Bring Your Own Laptop
Each workshop participant is required to bring their own laptop running Windows or OS X. The software used during this training program, R, is free and readily available for download.

Attendees receive an electronic copy of the course materials and related R code at the conclusion of the workshop.


Schedule

  • Workshop starts at 9:00am
  • Morning Coffee Break at 10:30am – 11:00am
  • Lunch provided at 12:30 – 1:15pm
  • Afternoon Coffee Break at 2:30pm – 3:00pm
  • End of the Workshop: 4:30pm

Instructor

Max Kuhn, Director, Nonclinical Statistics, Pfizer

Max Kuhn is a Director of Nonclinical Statistics at Pfizer Global R&D in Connecticut. He has been apply models in the pharmaceutical industries for over 15 years.

He is a leading R developer and the author of several R packages including the CARET package that provides a simple and consistent interface to over 100 predictive models available in R.

Mr. Kuhn has taught courses on modeling within Pfizer and externally, including a class for the India Ministry of Information Technology.


http://www.predictiveanalyticsworld.com/sanfrancisco/2011/r_for_predictive_modeling.php
 

How to balance your online advertising and your offline conscience

Google in 1998, showing the original logo
Image via Wikipedia

I recently found an interesting example of  a website that both makes a lot of money and yet is much more efficient than any free or non profit. It is called ECOSIA

If you see a website that wants to balance administrative costs  plus have a transparent way to make the world better- this is a great example.

  • http://ecosia.org/how.php
  • HOW IT WORKS
    You search with Ecosia.
  • Perhaps you click on an interesting sponsored link.
  • The sponsoring company pays Bing or Yahoo for the click.
  • Bing or Yahoo gives the bigger chunk of that money to Ecosia.
  • Ecosia donates at least 80% of this income to support WWF’s work in the Amazon.
  • If you like what we’re doing, help us spread the word!
  • Key facts about the park:

    • World’s largest tropical forest reserve (38,867 square kilometers, or about the size of Switzerland)
    • Home to about 14% of all amphibian species and roughly 54% of all bird species in the Amazon – not to mention large populations of at least eight threatened species, including the jaguar
    • Includes part of the Guiana Shield containing 25% of world’s remaining tropical rainforests – 80 to 90% of which are still pristine
    • Holds the last major unpolluted water reserves in the Neotropics, containing approximately 20% of all of the Earth’s water
    • One of the last tropical regions on Earth vastly unaltered by humans
    • Significant contributor to climatic regulation via heat absorption and carbon storage


    http://ecosia.org/statistics.php

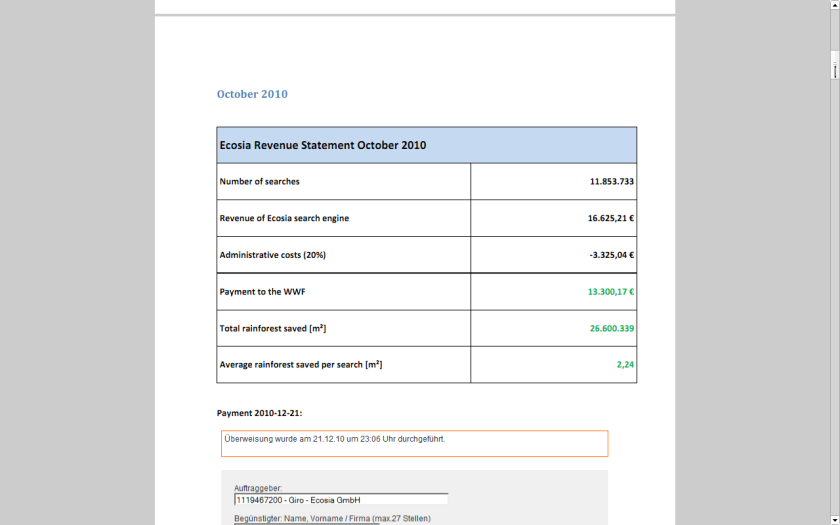
    They claim to have donated 141,529.42 EUR !!!

    http://static.ecosia.org/files/donations.pdf


    Well suppose you are the Web Admin of a very popular website like Wikipedia or etc

    One way to meet server costs is to say openly hey i need to balance my costs so i need some money.

    The other way is to use online advertising.

    I started mine with Google Adsense.

    Click per milli (or CPM)  gives you a very low low conversion compared to contacting ad sponsor directly.

    But its a great data experiment-

    as you can monitor which companies are likely to be advertised on your site (assume google knows more about their algols than you will)

    which formats -banner or text or flash have what kind of conversion rates

    what are the expected pay off rates from various keywords or companies (like business intelligence software, predictive analytics software and statistical computing software are similar but have different expected returns (if you remember your eco class)


    NOW- Based on above data, you know whats your minimum baseline to expect from a private advertiser than a public, crowd sourced search engine one (like Google or Bing)

    Lets say if you have 100000 views monthly. and assume one out of 1000 page views will lead to a click. Say the advertiser will pay you 1 $ for every 1 click (=1000 impressions)

    Then your expected revenue is $100.But if your clicks are priced at 2.5$ for every click , and your click through rate is now 3 out of 1000 impressions- (both very moderate increases that can done by basic placement optimization of ad type, graphics etc)-your new revenue is  750$.

    Be a good Samaritan- you decide to share some of this with your audience -like 4 Amazon books per month ( or I free Amazon book per week)- That gives you a cost of 200$, and leaves you with some 550$.

    Wait! it doesnt end there- Adam Smith‘s invisible hand moves on .

    You say hmm let me put 100 $ for an annual paper writing contest of $1000, donate $200 to one laptop per child ( or to Amazon rain forests or to Haiti etc etc etc), pay $100 to your upgraded server hosting, and put 350$ in online advertising. say $200 for search engines and $150 for Facebook.

    Woah!

    Month 1 would should see more people  visiting you for the first time. If you have a good return rate (returning visitors as a %, and low bounce rate (visits less than 5 secs)- your traffic should see atleast a 20% jump in new arrivals and 5-10 % in long term arrivals. Ignoring bounces- within  three months you will have one of the following

    1) An interesting case study on statistics on online and social media advertising, tangible motivations for increasing community response , and some good data for study

    2) hopefully better cost management of your server expenses

    3)very hopefully a positive cash flow


    you could even set a percentage and share the monthly (or annually is better actions) to your readers and advertisers.

    go ahead- change the world!

    the key paradigms here are sharing your traffic and revenue openly to everyone

    donating to a suitable cause

    helping increase awareness of the suitable cause

    basing fixed percentages rather than absolute numbers to ensure your site and cause are sustained for years.

    2010 in review and WP-Stats

    The following is an auto generated post thanks to WordPress.com stats team- clearly they have got some stuff wrong

    1) Defining the speedometer quantitatively

    2) The busiest day numbers are plain wrong ( 2 views ??)

    3) There is still no geographic data in WordPress -com stats (unlike Google Analytics) and I cant enable Google Analytics on a wordpress.com hosted site.


    The stats helper monkeys at WordPress.com mulled over how this blog did in 2010, and here’s a high level summary of its overall blog health:

    Healthy blog!

    The Blog-Health-o-Meter™ reads Wow.

    Crunchy numbers

    Featured image

    The Louvre Museum has 8.5 million visitors per year. This blog was viewed about 97,000 times in 2010. If it were an exhibit at The Louvre Museum, it would take 4 days for that many people to see it.


    In 2010, there were 367 new posts, growing the total archive of this blog to 1191 posts. There were 411 pictures uploaded, taking up a total of 121mb. That’s about 1 pictures per day.

    The busiest day of the year was September 22nd with 2 views. The most popular post that day was Top 10 Graphical User Interfaces in Statistical Software.

    Where did they come from?

    The top referring sites in 2010 were r-bloggers.com, reddit.com, rattle.togaware.com, twitter.com, and Google Reader.

    Some visitors came searching, mostly for libre office, facebook analytics, test drive a chrome notebook, test drive a chrome notebook., and wps sas lawsuit.

    Attractions in 2010

    These are the posts and pages that got the most views in 2010.

    1

    Top 10 Graphical User Interfaces in Statistical Software April 2010
    8 comments and 1 Like on WordPress.com,

    2

    Wealth = function (numeracy, memory recall) December 2009
    1 Like on WordPress.com,

    3

    Matlab-Mathematica-R and GPU Computing September 2010
    1 Like on WordPress.com,

    4

    About DecisionStats July 2008

    5

    The Top Statistical Softwares (GUI) May 2010
    1 comment and 1 Like on WordPress.com,

    Privacy Browsing Extensions in Google Chrome

    coat of arms of the Palaiologos dynasty, the l...
    Image via Wikipedia

    Using two Chrome Extensions, Disconnect and AdBlock you can be sure of having a vary very clean browsing experience-it is recommended especially if you dont like the auto sharing of your personal preferences and cannot be bothered by the Byzantine maze of social media privacy fineprint.

    https://chrome.google.com/extensions/detail/jeoacafpbcihiomhlakheieifhpjdfeo

    Disconnect by Brian Kennish

    (184) – 44,284 users – Weekly installs: 24,086

    Stop major third parties and search engines from tracking the webpages you go to and searches you do.

    * Search depersonalization is now optional and off by default. Click the “d” button then the “Depersonalize searches” checkbox to turn this feature on (or back off in case you have trouble getting to Google or Yahoo services). For help with anything else, see the known issues below and ask questions at http://j.mp/dnewgroup.
    
    §
    
    If you’re a typical web user, you’re unintentionally sending your browsing and search history with your name and other personal information to third parties and search engines whenever you’re online.
    
    Take control of the data you share with Disconnect!
    
    From the developer of the top-10-rated Facebook Disconnect extension, Disconnect lets you:
    
    • Disable tracking by third parties like Digg, Facebook, Google, Twitter, and Yahoo, without requiring any setup or significantly degrading the usability of the web.
    
    • Truly depersonalize searches on search engines like Google and Yahoo (by blocking identifying cookies not just changing the appearance of results pages), while staying logged into other services — e.g., so you can search anonymously on Google and access iGoogle at once.
    
    • See how many resource and cookie requests are blocked, in real time
    
    
    and
    https://chrome.google.com/extensions/detail/gighmmpiobklfepjocnamgkkbiglidom
    
    ExtensionsAdBlock

    AdBlock

    (6937) - 1,615,373 users - Weekly installs: 153,032
    The most popular Chrome extension, with over 1.5 million users! Blocks ads all over the web.
    Verified author: chromeadblock.com
    =================
    
    New in version 2.1: Translated into dozens of languages!
    New in version 2.0: Ads are blocked from downloading, instead of just being removed after the fact!
    
    =======================
    
    The official AdBlock For Chrome!  Block all advertisements on all web pages.  Your browser is automatically updated with additions to the filter: just click Install, then visit your favorite website and see the ads disappear!
    
    FAQs:1. This is the official AdBlock extension: the original ad blocker written from the ground up to be optimized in Chrome.  There's an unrelated, older Firefox project called Adblock Plus, and they're working on making a Chrome version out of the old AdThwart codebase.  At the moment AdBlock blocks some ads that AdThwart only hides, but they're working to improve it.  It's available at bit.ly/id2Gqx; if you have trouble with AdBlock, they're good guys and a fine alternative!


    Test Drive a Google Chrome Notebook: Last Two Days left

    Main logo and icon for the open source interne...
    Image via Wikipedia

    Chrome

    Test drive a Chrome notebook.

    We have a limited number of Chrome notebooks to distribute, and we need to ensure that they find good homes. That’s where you come in. Everything is still very much a work in progress, and it’s users, like you, that often give us our best ideas about what feels clunky or what’s missing. So if you live in the United States, are at least 18 years old, and would like to be considered for our small Pilot program, please fill this out. It should take about 15 minutes. We’ll review the requests that come in and contact you if you’ve been selected.

    This application will be open until 11:59:59 PM PST on December 21, 2010.

    What type of user are you?

    https://services.google.com/fb/forms/cr48advanced/

    Business
    Education
    Non-Profit
    Developer
    Individual

    Google Books Ngram Viewer

    Here is a terrific data visualization from Google based on their digitized books collection. How does it work, basically you can test the frequency of various words across time periods from 1700s to 2010.

    Like the frequency and intensity of kung fu vs yoga, or pizza versus hot dog. The basic datasets scans millions /billions of words.

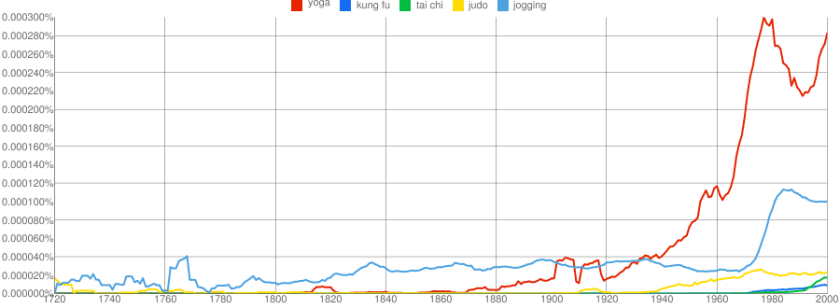
    Here is my yoga vs kung fu vs judo graph.

    http://ngrams.googlelabs.com/info

    What’s all this do?

    When you enter phrases into the Google Books Ngram Viewer, it displays a graph showing how those phrases have occurred in a corpus of books (e.g., “British English”, “English Fiction”, “French”) over the selected years. Let’s look at a sample graph:

    This shows trends in three ngrams from 1950 to 2000: “nursery school” (a 2-gram or bigram), “kindergarten” (a 1-gram or unigram), and “child care” (another bigram). What the y-axis shows is this: of all the bigrams contained in our sample of books written in English and published in the United States, what percentage of them are “nursery school” or “child care”? Of all the unigrams, what percentage of them are “kindergarten”? Here, you can see that use of the phrase “child care” started to rise in the late 1960s, overtaking “nursery school” around 1970 and then “kindergarten” around 1973. It peaked shortly after 1990 and has been falling steadily since.

    (Interestingly, the results are noticeably different when the corpus is switched to British English.)

    Corpora

    Below are descriptions of the corpora that can be searched with the Google Books Ngram Viewer. All of these corpora were generated in July 2009; we will update these corpora as our book scanning continues, and the updated versions will have distinct persistent identifiers.

    Informal corpus name Persistent identifier Description
    American English googlebooks-eng-us-all-20090715 Same filtering as the English corpus but further restricted to books published in the United States.
    British English googlebooks-eng-gb-all-20090715 Same filtering as the English corpus but further restricted to books published in Great Britain.

    2011 Forecast-ying

    Free twitter badge
    Image via Wikipedia

    I had recently asked some friends from my Twitter lists for their take on 2011, atleast 3 of them responded back with the answer, 1 said they were still on it, and 1 claimed a recent office event.

    Anyways- I take note of the view of forecasting from

    http://www.uiah.fi/projekti/metodi/190.htm

    The most primitive method of forecasting is guessing. The result may be rated acceptable if the person making the guess is an expert in the matter.

    Ajay- people will forecast in end 2010 and 2011. many of them will get forecasts wrong, some very wrong, but by Dec 2011 most of them would be writing forecasts on 2012. almost no one will get called on by irate users-readers- (hey you got 4 out of 7 wrong last years forecast!) just wont happen. people thrive on hope. so does marketing. in 2011- and before

    and some forecasts from Tom Davenport’s The International Institute for Analytics (IIA) at

    http://iianalytics.com/2010/12/2011-predictions-for-the-analytics-industry/

    Regulatory and privacy constraints will continue to hamper growth of marketing analytics.

    (I wonder how privacy and analytics can co exist in peace forever- one view is that model building can use anonymized data suppose your IP address was anonymized using a standard secret Coco-Cola formula- then whatever model does get built would not be of concern to you individually as your privacy is protected by the anonymization formula)

    Anyway- back to the question I asked-

    What are the top 5 events in your industry (events as in things that occured not conferences) and what are the top 3 trends in 2011.

    I define my industry as being online technology writing- research (with a heavy skew on stat computing)

    My top 5 events for 2010 were-

    1) Consolidation- Big 5 software providers in BI and Analytics bought more, sued more, and consolidated more.  The valuations rose. and rose. leading to even more smaller players entering. Thus consolidation proved an oxy moron as total number of influential AND disruptive players grew.


    2) Cloudy Computing- Computing shifted from the desktop but to the mobile and more to the tablet than to the cloud. Ipad front end with Amazon Ec2 backend- yup it happened.

    3) Open Source grew louder- yes it got more clients. and more revenue. did it get more market share. depends on if you define market share by revenues or by users.

    Both Open Source and Closed Source had a good year- the pie grew faster and bigger so no one minded as long their slices grew bigger.

    4) We didnt see that coming –

    Technology continued to surprise with events (thats what we love! the surprises)

    Revolution Analytics broke through R’s Big Data Barrier, Tableau Software created a big Buzz,  Wikileaks and Chinese FireWalls gave technology an entire new dimension (though not universally popular one).

    people fought wars on emails and servers and social media- unfortunately the ones fighting real wars in 2009 continued to fight them in 2010 too

    5) Money-

    SAP,SAS,IBM,Oracle,Google,Microsoft made more money than ever before. Only Facebook got a movie named on itself. Venture Capitalists pumped in money in promising startups- really as if in a hurry to park money before tax cuts expired in some countries.


    2011 Top Three Forecasts

    1) Surprises- Expect to get surprised atleast 10 % of the time in business events. As internet grows the communication cycle shortens, the hype cycle amplifies buzz-

    more unstructured data  is created (esp for marketing analytics) leading to enhanced volatility

    2) Growth- Yes we predict technology will grow faster than the automobile industry. Game changers may happen in the form of Chrome OS- really its Linux guys-and customer adaptability to new USER INTERFACES. Design will matter much more in technology on your phone, on your desktop and on your internet. Packaging sells.

    False Top Trend 3) I will write a book on business analytics in 2011. yes it is true and I am working with A publisher. No it is not really going to be a top 3 event for anyone except me,publisher and lucky guys who read it.

    3) Creating technology and technically enabling creativity will converge at an accelerated rate. use of widgets, guis, snippets, ide will ensure creative left brains can code easier. and right brains can design faster and better due to a global supply chain of techie and artsy professionals.