Which software do we buy? -It depends

Software (novel)
Image via Wikipedia

Often I am asked by clients, friends and industry colleagues on the suitability or unsuitability of particular software for analytical needs.  My answer is mostly-

It depends on-

1) Cost of Type 1 error in purchase decision versus Type 2 error in Purchase Decision. (forgive me if I mix up Type 1 with Type 2 error- I do have some weird childhood learning disabilities which crop up now and then)

Here I define Type 1 error as paying more for a software when there were equivalent functionalities available at lower price, or buying components you do need , like SPSS Trends (when only SPSS Base is required) or SAS ETS, when only SAS/Stat would do.

The first kind is of course due to the presence of free tools with GUI like R, R Commander and Deducer (Rattle does have a 500$ commercial version).

The emergence of software vendors like WPS (for SAS language aficionados) which offer similar functionality as Base SAS, as well as the increasing convergence of business analytics (read predictive analytics), business intelligence (read reporting) has led to somewhat brand clutter in which all softwares promise to do everything at all different prices- though they all have specific strengths and weakness. To add to this, there are comparatively fewer business analytics independent analysts than say independent business intelligence analysts.

2) Type 2 Error- In this case the opportunity cost of delayed projects, business models , or lower accuracy – consequences of buying a lower priced software which had lesser functionality than you required.

To compound the magnitude of error 2, you are probably in some kind of vendor lock-in, your software budget is over because of buying too much or inappropriate software and hardware, and still you could do with some added help in business analytics. The fear of making a business critical error is a substantial reason why open source software have to work harder at proving them competent. This is because writing great software is not enough, we need great marketing to sell it, and great customer support to sustain it.

As Business Decisions are decisions made in the constraints of time, information and money- I will try to create a software purchase matrix based on my knowledge of known softwares (and unknown strengths and weakness), pricing (versus budgets), and ranges of data handling. I will add in basically an optimum approach based on known constraints, and add in flexibility for unknown operational constraints.

I will restrain this matrix to analytics software, though you could certainly extend it to other classes of enterprise software including big data databases, infrastructure and computing.

Noted Assumptions- 1) I am vendor neutral and do not suffer from subjective bias or affection for particular software (based on conferences, books, relationships,consulting etc)

2) All software have bugs so all need customer support.

3) All software have particular advantages , strengths and weakness in terms of functionality.

4) Cost includes total cost of ownership and opportunity cost of business analytics enabled decision.

5) All software marketing people will praise their own software- sometimes over-selling and mis-selling product bundles.

Software compared are SPSS, KXEN, R,SAS, WPS, Revolution R, SQL Server,  and various flavors and sub components within this. Optimized approach will include parallel programming, cloud computing, hardware costs, and dependent software costs.

To be continued-


Top ten RRReasons R is bad for you ?

This is the original symbol of the Perl progra...
Image via Wikipedia

R stands for programming language based out of www.r-project.org

R is bad for you because –

1) It is slower with bigger datasets than SPSS language and SAS language .If you use bigger datasets, then you should either consider more hardware , or try and wait for some of the ODBC connect packages.

2) It needs more time to learn than SAS language .Much more time to learn how to do much more.

3) R programmers are lesser paid than SAS programmers.They prefer it that way.It equates the satisfaction of creating a package in development with a world wide community with the satisfaction of using a package and earning much more money per hour.

4) It forces you to learn the exact details of what you are doing due to its object oriented structure. Thus you either get no answer or get an exact answer. Your customer pays you by the hour not by the correct answers.

5) You can not push a couple of buttons or refer to a list of top ten most commonly used commands to finish the project.

6) It is free. And open for all. It is socialism expressed in code. Some of the packages are built by university professors. It is free.Free is bad. Who pays for the mortgage of the software programmers if all softwares were free ? Who pays for the Friday picnics. Who pays for the Good Night cruises?

7) It is free. Your organization will not commend you for saving them money- they will question why you did not recommend this before. And why did you approve all those packages that expire in 2011.R is fReeeeee. Customers feel good while spending money.The more software budgets you approve the more your salary is. R thReatens all that.

8) It is impossible to install a package you do not need or want. There is no one calling you on the phone to consider one more package or solution. R can make you lonely.

9) R uses mostly Command line. Command line is from the Seventies. Or the Eighties. The GUI’s RCmdr and Rattle are there but still…..

10) R forces you to learn new stuff by the month. You prefer to only earn by the month. Till the day your job got offshored…

Written by a R user in English language

( which fortunately was not copyrighted otherwise we would be paying Britain for each word)

Ajay- The above post was reprinted by personal request. It was written on Jan 2009- and may not be truly valid now. It is meant to be taken in good humor-not so seriously.

BI Software

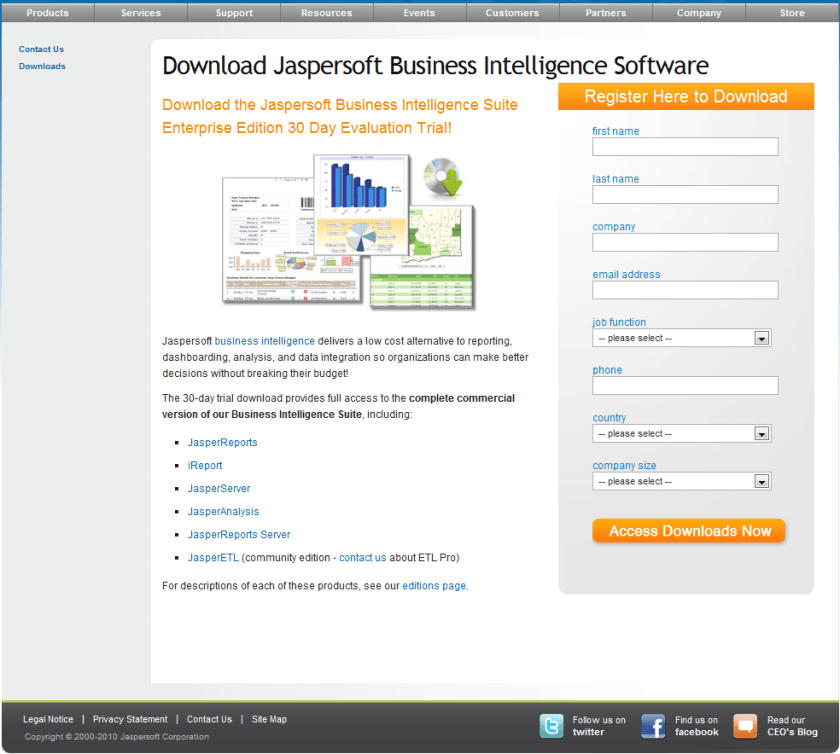
Here is the brand new release from Jaspersoft at a groovy price of 9000$. Somebody stop these guys!

It’s a great company to watch for buyouts as well- given their expertise in REPORTING and clientele- especially for anyone looking to im prove thier standing in both open source world and reporting software branding.

From AOL owned Arrogantion’s site http://www.crunchbase.com/company/jaspersoft


Total $24.5M
Series D, 8/07 1
Scale Venture Partners
SAP Ventures
Doll Capital Management
Partech International
Morgenthaler Ventures
$12M
Unattributed, 12/08 2
Adams Street Partners
Red Hat
Morgenthaler Ventures
Doll Capital Management
Partech International


The news-

Announcing JasperReports Server Professional

More Resources

Webinar: Introducing JasperReports Server Professional

Thursday October 14

In this live webinar, learn how a new solution from Jaspersoft combines the world’s favorite reporting server with powerful, mature report server functionality—for about 80% less.

  • Date: Thu, Oct 14
  • Time: 10:00 AM PDT
  • Duration: 60 minutes

The World’s Most Powerful and Affordable Reporting Server

Limited Time Introductory Offer: Starting from $9,000 (restrictions apply)

JasperReports Server is the recommended product for organizations requiring an affordable reporting solution for interactive, operational, and production-based reporting. Deployed as a standalone reporting server or integrated inside another application, JasperReports Server is a flexible, powerful, interactive reporting environment for small or large enterprises.

Powered by the world’s most popular reporting tools in JasperReports and iReport, developers and users can take advantage of more interactivity, security, and scheduling of their reports.

Key Benefits:

  • Affordable: Unlimited reports for unlimited users starting at $9,000
  • Powerful: Report scheduling and distribution to 1,000s of users on a single server
  • Flexible: Web service architecture simplifies application integration
  • Secure: Centralized repository authenticates report access
  • Interactive: Easy to interact, self-serve parameterized-based reports
  • Visual appeal: Flash-based charts and maps engage users and enhance applications
  • Open: Access to any data source including relational, XML, Hibernate, EJB, POJO, and custom


Speaking of videos -here is a great video on BI from good ol Tennessee-a great 27 min tutorial on BI for newbies


Interesting Interview with Quentin G,AsterData

Here is an interesting interview with Quentin G, CEO AsterData, Marketing trumpeting aside apart-the insights on the whats next vision thing are quite good.

Sourcehttp://www.arnoldit.com/search-wizards-speak/aster-data.html

As you look down the road, what are the three major challenges you see for vendors who keep trying to solve big data and other “now” problems with old tools?

Old tools and traditional architectures cannot scale effectively to handle massive data volumes that reach 100’s of terabytes nor can they effectively process large data volumes in a high performance manner. Further, they are restricted to what SQL querying allows. The three challenges I have noted are:

First, performance, specifically, poor performance on large data volumes and heavy workloads: The pre-existing systems rely on storing data in a traditional DBMS or data warehouse and then extracting a sample of data to a separate processing tier. This greatly restricts data insights and analytics as only a sample of data is analyzed and understood.  As more data is stored in these systems they suffer from performance degradation as more users try to access the system concurrently. Additionally moving masses of data out of the traditional DBMS to a separate processing tier adds latency and slows down analytics and response times. This pre-existing architecture greatly limits performance especially as data sizes grow.

Second, limited analytics: Pre-existing systems rely mostly on SQL for data querying and analysis. SQL poses several limitations and is not suited for ad hoc querying, deep data exploration and a range of other analytics. MapReduce overcomes the limitations of SQL and SQL-MapReduce in particular opens up a new class of analytics that cannot be achieved with SQL alone.

And, third, limitations of types of data that can be stored and analyzed: Traditional systems are not designed for non-relational or unstructured data. New solutions such as Aster Data’s are designed from the ground up to handle both relational and non-relational data. Organizations want to store and process a range of data types and do this in a single platform. New solutions allow for different data types to be handled in a single platform whereas pre-existing architectures and solutions are specialized around a single data type or format – this restricts the diversity of analytics that can be performed on these systems.

Read the whole interview at –http://www.arnoldit.com/search-wizards-speak/aster-data.html

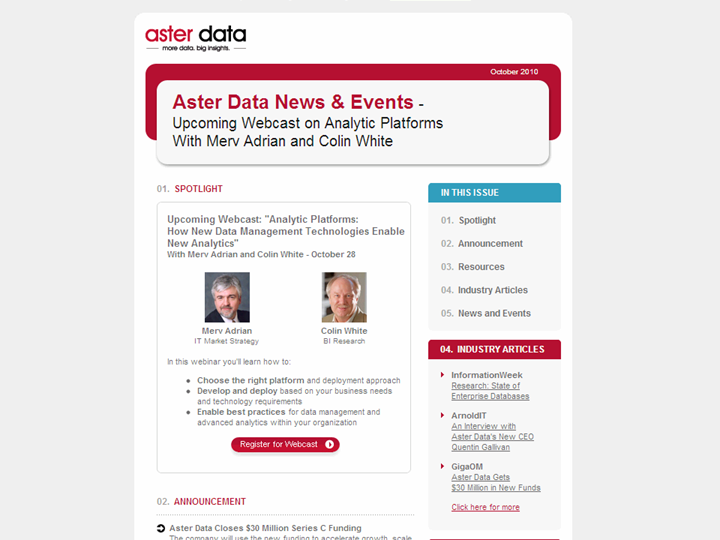
Speaking of which- there is a new webinar by Merv Adrian (interview on Decisionstats) and Colin White-


http://now.eloqua.com/es.asp?s=1015&e=1862&elq=9ec9b73872e849b88d2943cca920acda

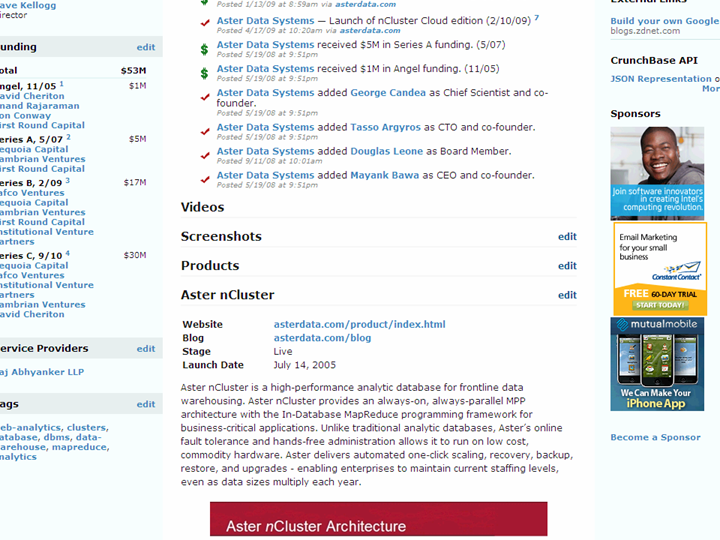
and from the famous AOL website- a profile of AsterData’s money flow which kind of hints at an IPO two years onwards-

http://www.crunchbase.com/company/aster-data-systems

The auto-suggest link/tags for WP.com blogs

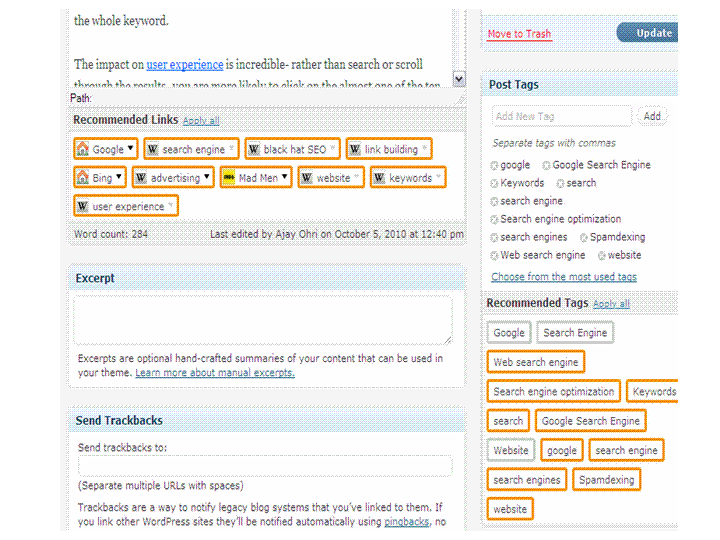
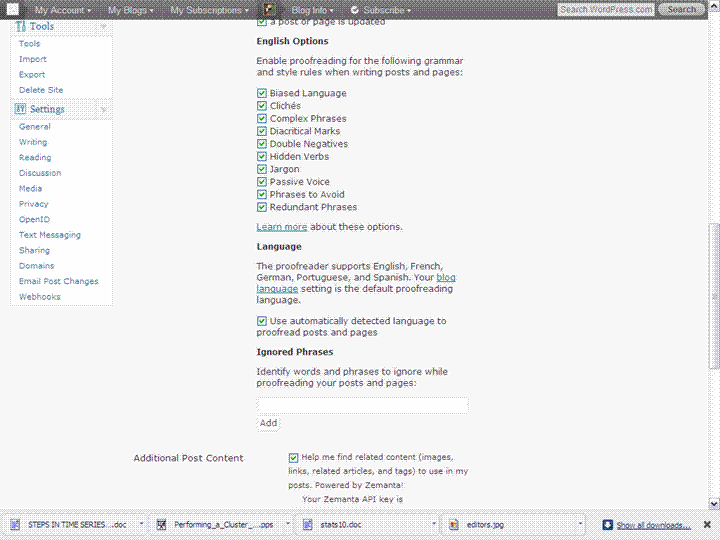
WordPress.com blogs have a great new option for generating tags, and links and thus improving their search engine optimization for posts.

Just go to Users-Personal Settings- and check the options shown. Thats it every time you write a post it suggests links and tags. Links are helpful for your readers (like Wikipedia links to understand dense technical jargon, or associated websites). Tags help to classify your contents so that all visitors to the web site including spiders ,search engines and your readers can search it better.

The bad thing is I need to go back to all 1025 posts on this site and auto generate tags for the archives ! Oh well. Great collaboration between zementa and Automattic for this new feature.

Awesome new features in Doc Googles

I really liked some awesome new features in Google Docs, and I am mentioning just some of the features I like because they are not there in Windows Office mostly.

Sourcehttp://www.google.com/google-d-s/whatsnew.html

List View and Mobile View Improvements
Now you can see your spreadsheets with all their formatting in List View and on your mobile device, this includes background/foreground colors, borders and text formatting!

Themes for forms
Add a splash of color to your surveys and questionnaires. When you create and edit a form, simply apply one of the 70 themes

  • Forms improvements
    We’ve added a new question type (grid), support for right-to-left languages in forms, and a new color scheme for the forms summary. Also, you can now pre-populate form fields with URL parameters, and if you use Google Apps, you can create forms which require sign-in to access. Learn more

  • Translate document
    You can now translate an entire document into over 40 languages.

    Translate and detect languages in Google spreadsheets
    =GoogleTranslate(“Hola, ¿cómo estás?”,”es”,”en”) gives “Hi, how are you?” (or leave out “en” and we’ll automatically choose the default language of your spreadsheet) What if you don’t know the language? =DetectLanguage(“Hola, ¿cómo estás?”) gives “es”.

    A new curve tool in drawings
    Create smooth curves based on a series of points with this new tool.

    Optical character recognition (OCR)
    You can now upload and convert PDF or image files to text.


    You can read the awesome new ones athttp://www.google.com/google-d-s/whatsnew.html but these are the ones I felt were missing in Windows Office.

    Coming up- a Review of newly forked Libre Office

Interview Michael J. A. Berry Data Miners, Inc

Here is an interview with noted Data Mining practitioner Michael Berry, author of seminal books in data mining, noted trainer and consultantmjab picture

Ajay- Your famous book “Data Mining Techniques: For Marketing, Sales, and Customer Relationship Management” came out in 2004, and an update is being planned for 2011. What are the various new data mining techniques and their application that you intend to talk about in that book.

Michael- Each time we do a revision, it feels like writing a whole new book. The first edition came out in 1997 and it is hard to believe how much the world has changed since then. I’m currently spending most of my time in the on-line retailing world. The things I worry about today–improving recommendations for cross-sell and up-sell,and search engine optimization–wouldn’t have even made sense to me back then. And the data sizes that are routine today were beyond the capacity of the most powerful super computers of the nineties. But, if possible, Gordon and I have changed even more than the data mining landscape. What has changed us is experience. We learned an awful lot between the first and second editions, and I think we’ve learned even more between the second and third.

One consequence is that we now have to discipline ourselves to avoid making the book too heavy to lift. For the first edition, we could write everything we knew (and arguably, a bit more!); now we have to remind ourselves that our intended audience is still the same–intelligent laymen with a practical interest in getting more information out of data. Not statisticians. Not computer scientists. Not academic researchers. Although we welcome all readers, we are primarily writing for someone who works in a marketing department and has a title with the word “analyst” or “analytics” in it. We have relaxed our “no equations” rule slightly for cases when the equations really do make things easier to explain, but the core explanations are still in words and pictures.

The third edition completes a transition that was already happening in the second edition. We have fully embraced standard statistical modeling techniques as full-fledged components of the data miner’s toolkit. In the first edition, it seemed important to make a distinction between old, dull, statistics, and new, cool, data mining. By the second edition, we realized that didn’t really make sense, but remnants of that attitude persisted. The third edition rectifies this. There is a chapter on statistical modeling techniques that explains linear and logistic regression, naive Bayes models, and more. There is also a brand new chapter on text mining, a curious omission from previous editions.

There is also a lot more material on data preparation. Three whole chapters are devoted to various aspects of data preparation. The first focuses on creating customer signatures. The second is focused on using derived variables to bring information to the surface, and the third deals with data reduction techniques such as principal components. Since this is where we spend the greatest part of our time in our work, it seemed important to spend more time on these subjects in the book as well.

Some of the chapters have been beefed up a bit. The neural network chapter now includes radial basis functions in addition to multi-layer perceptrons. The clustering chapter has been split into two chapters to accommodate new material on soft clustering, self-organizing maps, and more. The survival analysis chapter is much improved and includes material on some of our recent application of survival analysis methods to forecasting. The genetic algorithms chapter now includes a discussion of swarm intelligence.

Ajay- Describe your early career and how you came into Data Mining as a profession. What do you think of various universities now offering MS in Analytics. How do you balance your own teaching experience with your consulting projects at The Data Miners.

Michael- I fell into data mining quite by accident. I guess I always had a latent interest in the topic. As a high school and college student, I was a fan of Martin Gardner‘s mathematical games in in Scientific American. One of my favorite things he wrote about was a game called New Eleusis in which one players, God, makes up a rule to govern how cards can be played (“an even card must be followed by a red card”, say) and the other players have to figure out the rule by watching what plays are allowed by God and which ones are rejected. Just for my own amusement, I wrote a computer program to play the game and presented it at the IJCAI conference in, I think, 1981.

That paper became a chapter in a book on computer game playing–so my first book was about finding patterns in data. Aside from that, my interest in finding patterns in data lay dormant for years. At Thinking Machines, I was in the compiler group. In particular, I was responsible for the run-time system of the first Fortran Compiler for the CM-2 and I represented Thinking Machines at the Fortran 8X (later Fortran-90) standards meetings.

What changed my direction was that Thinking Machines got an export license to sell our first machine overseas. The machine went to a research lab just outside of Paris. The connection machine was so hard to program, that if you bought one, you got an applications engineer to go along with it. None of the applications engineers wanted to go live in Paris for a few months, but I did.

Paris was a lot of fun, and so, I discovered, was actually working on applications. When I came back to the states, I stuck with that applied focus and my next assignment was to spend a couple of years at Epsilon, (then a subsidiary of American Express) working on a database marketing system that stored all the “records of charge” for American Express card members. The purpose of the system was to pick ads to go in the billing envelope. I also worked on some more general purpose data mining software for the CM-5.

When Thinking Machines folded, I had the opportunity to open a Cambridge office for a Virginia-based consulting company called MRJ that had been a major channel for placing Connection Machines in various government agencies. The new group at MRJ was focused on data mining applications in the commercial market. At least, that was the idea. It turned out that they were more interested in data warehousing projects, so after a while we parted company.

That led to the formation of Data Miners. My two partners in Data Miners, Gordon Linoff and Brij Masand, share the Thinking Machines background.

To tell the truth, I really don’t know much about the university programs in data mining that have started to crop up. I’ve visited the one at NC State, but not any of the others.

I myself teach a class in “Marketing Analytics” at the Carroll School of Management at Boston College. It is an elective part of the MBA program there. I also teach short classes for corporations on their sites and at various conferences.

Ajay- At the previous Predictive Analytics World, you took a session on Forecasting and Predicting Subsciber levels (http://www.predictiveanalyticsworld.com/dc/2009/agenda.php#day2-6) .

It seems inability to forecast is a problem many many companies face today. What do you think are the top 5 principles of business forecasting which companies need to follow.

Michael- I don’t think I can come up with five. Our approach to forecasting is essentially simulation. We try to model the underlying processes and then turn the crank to see what happens. If there is a principal behind that, I guess it is to approach a forecast from the bottom up rather than treating aggregate numbers as a time series.

Ajay- You often partner your talks with SAS Institute, and your blog at http://blog.data-miners.com/ sometimes contain SAS code as well. What particular features of the SAS software do you like. Do you use just the Enterprise Miner or other modules as well for Survival Analysis or Forecasting.

Michael- Our first data mining class used SGI’s Mineset for the hands-on examples. Later we developed versions using Clementine, Quadstone, and SAS Enterprise Miner. Then, market forces took hold. We don’t market our classes ourselves, we depend on others to market them and then share in the revenue.

SAS turned out to be much better at marketing our classes than the other companies, so over time we stopped updating the other versions. An odd thing about our relationship with SAS is that it is only with the education group. They let us use Enterprise Miner to develop course materials, but we are explicitly forbidden to use it in our consulting work. As a consequence, we don’t use it much outside of the classroom.

Ajay- Also any other software you use (apart from SQL and J)

Michael- We try to fit in with whatever environment our client has set up. That almost always is SQL-based (Teradata, Oracle, SQL Server, . . .). Often SAS Stat is also available and sometimes Enterprise Miner.

We run into SPSS, Statistica, Angoss, and other tools as well. We tend to work in big data environments so we’ve also had occasion to use Ab Initio and, more recently, Hadoop. I expect to be seeing more of that.

Biography-

Together with his colleague, Gordon Linoff, Michael Berry is author of some of the most widely read and respected books on data mining. These best sellers in the field have been translated into many languages. Michael is an active practitioner of data mining. His books reflect many years of practical, hands-on experience down in the data mines.

Data Mining Techniques cover

Data Mining Techniques for Marketing, Sales and Customer Relationship Management

by Michael J. A. Berry and Gordon S. Linoff
copyright 2004 by John Wiley & Sons
ISB

Mining the Web cover

Mining the Web

by Michael J.A. Berry and Gordon S. Linoff
copyright 2002 by John Wiley & Sons
ISBN 0-471-41609-6

Non-English editions available in Traditional Chinese and Simplified Chinese

This book looks at the new opportunities and challenges for data mining that have been created by the web. The book demonstrates how to apply data mining to specific types of online businesses, such as auction sites, B2B trading exchanges, click-and-mortar retailers, subscription sites, and online retailers of digital content.

Mastering Data Mining

by Michael J.A. Berry and Gordon S. Linoff
copyright 2000 by John Wiley & Sons
ISBN 0-471-33123-6

Non-English editions available in JapaneseItalianTraditional Chinese , and Simplified Chinese

A case study-based guide to applying data mining techniques for solving practical business problems. These “warts and all” case studies are drawn directly from consulting engagements performed by the authors.

A data mining educator as well as a consultant, Michael is in demand as a keynote speaker and seminar leader in the area of data mining generally and the application of data mining to customer relationship management in particular.

Prior to founding Data Miners in December, 1997, Michael spent 8 years at Thinking Machines Corporation. There he specialized in the application of massively parallel supercomputing techniques to business and marketing applications, including one of the largest database marketing systems of the time.