Interview Dean Abbott Abbott Analytics

Here is an interview with noted Analytics Consultant and trainer Dean Abbott. Dean is scheduled to take a workshop on Predictive Analytics at PAW (Predictive Analytics World Conference)  Oct 18 , 2010 in Washington D.C

Ajay-  Describe your upcoming hands on workshop at Predictive Analytics World and how it can help people learn more predictive modeling.

Refer- http://www.predictiveanalyticsworld.com/dc/2010/handson_predictive_analytics.php

Dean- The hands-on workshop is geared toward individuals who know something about predictive analytics but would like to experience the process. It will help people in two regards. First, by going through the data assessment, preparation, modeling and model assessment stages in one day, the attendees will see how predictive analytics works in reality, including some of the pain associated with false starts and mistakes. At the same time, they will experience success with building reasonable models to solve a problem in a single day. I have found that for many, having to actually build the predictive analytics solution if an eye-opener. Seeing demonstrations show the capabilities of a tool, but greater value for an end-user is the development of intuition of what to do at each each stage of the process that makes the theory of predictive analytics real.

Second, they will gain experience using a top-tier predictive analytics software tool, Enterprise Miner (EM). This is especially helpful for those who are considering purchasing EM, but also for those who have used open source tools and have never experienced the additional power and efficiencies that come with a tool that is well thought out from a business solutions standpoint (as opposed to an algorithm workbench).

Ajay-  You are an instructor with software ranging from SPSS, S Plus, SAS Enterprise Miner, Statistica and CART. What features of each software do you like best and are more suited for application in data cases.

Dean- I’ll add Tibco Spotfire Miner, Polyanalyst and Unica’s Predictive Insight to the list of tools I’ve taught “hands-on” courses around, and there are at least a half dozen more I demonstrate in lecture courses (JMP, Matlab, Wizwhy, R, Ggobi, RapidMiner, Orange, Weka, RandomForests and TreeNet to name a few). The development of software is a fascinating undertaking, and each tools has its own strengths and weaknesses.

I personally gravitate toward tools with data flow / icon interface because I think more that way, and I’ve tired of learning more programming languages.

Since the predictive analytics algorithms are roughly the same (backdrop is backdrop no matter which tool you use), the key differentiators are

(1) how data can be loaded in and how tightly integrated can the tool be with the database,

(2) how well big data can be handled,

(3) how extensive are the data manipulation options,

(4) how flexible are the model reporting options, and

(5) how can you get the models and/or predictions out.

There are vast differences in the tools on these matters, so when I recommend tools for customers, I usually interview them quite extensively to understand better how they use data and how the models will be integrated into their business practice.

A final consideration is related to the efficiency of using the tool: how much automation can one introduce so that user-interaction is minimized once the analytics process has been defined. While I don’t like new programming languages, scripting and programming often helps here, though some tools have a way to run the visual programming data diagram itself without converting it to code.

Ajay- What are your views on the increasing trend of consolidation and mergers and acquisitions in the predictive analytics space. Does this increase the need for vendor neutral analysts and consultants as well as conferences.

Dean- When companies buy a predictive analytics software package, it’s a mixed bag. SPSS purchasing of Clementine was ultimately good for the predictive analytics, though it took several years for SPSS to figure out what they wanted to do with it. Darwin ultimately disappeared after being purchased by Oracle, but the newer Oracle data mining tool, ODM, integrates better with the database than Darwin did or even would have been able to.

The biggest trend and pressure for the commercial vendors is the improvements in the Open Source and GNU tools. These are becoming more viable for enterprise-level customers with big data, though from what I’ve seen, they haven’t caught up with the big commercial players yet. There is great value in bringing both commercial and open source tools to the attention of end-users in the context of solutions (rather than sales) in a conference setting, which is I think an advantage that Predictive Analytics World has.

As a vendor-neutral consultant, flux is always a good thing because I have to be proficient in a variety of tools, and it is the breadth that brings value for customers entering into the predictive analytics space. But it is very difficult to keep up with the rapidly-changing market and that is something I am weighing myself: how many tools should I keep in my active toolbox.

Ajay-  Describe your career and how you came into the Predictive Analytics space. What are your views on various MS Analytics offered by Universities.

Dean- After getting a masters degree in Applied Mathematics, my first job was at a small aerospace engineering company in Charlottesville, VA called Barron Associates, Inc. (BAI); it is still in existence and doing quite well! I was working on optimal guidance algorithms for some developmental missile systems, and statistical learning was a key part of the process, so I but my teeth on pattern recognition techniques there, and frankly, that was the most interesting part of the job. In fact, most of us agreed that this was the most interesting part: John Elder (Elder Research) was the first employee at BAI, and was there at that time. Gerry Montgomery and Paul Hess were there as well and left to form a data mining company called AbTech and are still in analytics space.

After working at BAI, I had short stints at Martin Marietta Corp. and PAR Government Systems were I worked on analytics solutions in DoD, primarily radar and sonar applications. It was while at Elder Research in the 90s that began working in the commercial space more in financial and risk modeling, and then in 1999 I began working as an independent consultant.

One thing I love about this field is that the same techniques can be applied broadly, and therefore I can work on CRM, web analytics, tax and financial risk, credit scoring, survey analysis, and many more application, and cross-fertilize ideas from one domain into other domains.

Regarding MS degrees, let me first write that I am very encouraged that data mining and predictive analytics are being taught in specific class and programs rather than as just an add-on to an advanced statistics or business class. That stated, I have mixed feelings about analytics offerings at Universities.

I find that most provide a good theoretical foundation in the algorithms, but are weak in describing the entire process in a business context. For those building predictive models, the model-building stage nearly always takes much less time than getting the data ready for modeling and reporting results. These are cross-discipline tasks, requiring some understanding of the database world and the business world for us to define the target variable(s) properly and clean up the data so that the predictive analytics algorithms to work well.

The programs that have a practicum of some kind are the most useful, in my opinion. There are some certificate programs out there that have more of a business-oriented framework, and the NC State program builds an internship into the degree itself. These are positive steps in the field that I’m sure will continue as predictive analytics graduates become more in demand.

Biography-

DEAN ABBOTT is President of Abbott Analytics in San Diego, California. Mr. Abbott has over 21 years of experience applying advanced data mining, data preparation, and data visualization methods in real-world data intensive problems, including fraud detection, response modeling, survey analysis, planned giving, predictive toxicology, signal process, and missile guidance. In addition, he has developed and evaluated algorithms for use in commercial data mining and pattern recognition products, including polynomial networks, neural networks, radial basis functions, and clustering algorithms, and has consulted with data mining software companies to provide critiques and assessments of their current features and future enhancements.

Mr. Abbott is a seasoned instructor, having taught a wide range of data mining tutorials and seminars for a decade to audiences of up to 400, including DAMA, KDD, AAAI, and IEEE conferences. He is the instructor of well-regarded data mining courses, explaining concepts in language readily understood by a wide range of audiences, including analytics novices, data analysts, statisticians, and business professionals. Mr. Abbott also has taught both applied and hands-on data mining courses for major software vendors, including Clementine (SPSS, an IBM Company), Affinium Model (Unica Corporation), Statistica (StatSoft, Inc.), S-Plus and Insightful Miner (Insightful Corporation), Enterprise Miner (SAS), Tibco Spitfire Miner (Tibco), and CART (Salford Systems).
Using JMP 9 and R together

An interesting blog post at http://blogs.sas.com/jmp/index.php?/archives/298-JMP-Into-R!.html on using the new JMP 9 with R, and quite possibly using SAS as well.

Example Code-

Here’s the R integration JSL code used to run the bootstrap

rconn = R Connect();
rconn << Submit(“\[
library(boot)

# Load Boot package
library(boot)

RStatFctn <- function(x,d) {return(mean(x[d]))}

b.basic = matrix(data=NA, nrow=1000, ncol=2)
b.normal = matrix(data=NA, nrow=1000, ncol=2)
b.percent =matrix(data=NA, nrow=1000, ncol=2)
b.bca =matrix(data=NA, nrow=1000, ncol=2)

for(i in 1:1000){
rnormdat = rnorm(30,0,1)
b <- boot(rnormdat, RStatFctn, R = 1000)
b.ci=boot.ci(b, conf =095,type=c(“basic”,”norm”,”perc”,”bca”)) b.basic[i,] = b.ci$basic[,4:5]
b.normal[i,] = b.ci$normal[,2:3]
b.percent[i,] = b.ci$percent[,4:5]
b.bca[i,] = b.ci$bca[,4:5]
}
]\”));
b_basic= rconn << Get(b.basic);
b_normal = rconn << Get(b.normal);
b_percent= rconn << Get(b.percent);
b_bca = rconn << Get(b.bca);
rconn << Disconnect();

Using the R Connect() JSL command and assigning it to the object “rconn”, the code sends messages to the JSL scriptable object “rconn” to submit R code via the Submit() command and to retrieve R matrices containing the bootstrap confidence intervals back via the Get() commands.

and I also found interesting what the write has to say about using JMP (for visual analysis) and SAS (bigger datasets handling) and R (for advanced statistics) together

Other standard JMP tools such as the Data Filter can help to explore these results in ways that cannot easily and quickly be done in R

and

With a little JSL and the statistical and graphics platforms of JMP coupled with the breadth and variety of packages and functions in R, one can build complete easy-to-use applications for statistical analysis.

JMP can also integrate with SAS, which adds the ability to work with large-scale data through the file-based system as well as the depth and advanced capabilities of SAS procedures. With these seamless integrations, JMP can become a hub that enables you to connect with both SAS and R, as well as provide unique statistical features such as the JMP Profiler and interactive graphic features such as Graph Builder

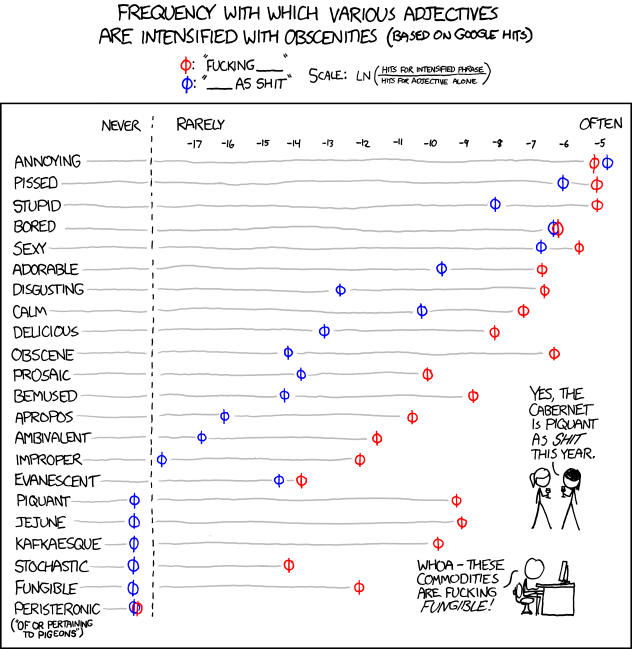
and in the meanwhile here is a data visualization of a frequency analysis of various words bundled together from xkcd.com

Sector/ Sphere – Faster than Hadoop/Mapreduce at Terasort

Here is a preview of a relatively young software Sector and Sphere- which are claimed to be better than Hadoop /MapReduce at TeraSort Benchmark among others.

http://sector.sourceforge.net/tech.html

System Overview

The Sector/Sphere stack consists of the Sector distributed file system and the Sphere parallel data processing framework. The objective is to support highly effective and efficient large data storage and processing over commodity computer clusters.

Sector/Sphere Architecture

Sector consists of 4 parts, as shown in the above diagram. The Security server maintains the system security configurations such as user accounts, data IO permissions, and IP access control lists. The master servers maintain file system metadata, schedule jobs, and respond users’ requests. Sector supports multiple active masters that can join and leave at run time and they all actively respond users’ requests. The slave nodes are racks of computers that store and process data. The slaves nodes can be located within a single data center to across multiple data centers with high speed network connections. Finally, the client includes tools and programming APIs to access and process Sector data.

Sphere: Parallel Data Processing Framework

Sphere allows developers to write parallel data processing applications with a very simple set of API. It applies user-defined functions (UDF) on all input data segments in parallel. In a Sphere application, both inputs and outputs are Sector files. Multiple Sphere processing can be combined to support more complicated applications, with inputs/outputs exchanged/shared via the Sector file system.

Data segments are processed at their storage locations whenever possible (data locality). Failed data segments may be restarted on other nodes to achieve fault tolerance.

The Sphere framework can be compared to MapReduce as they both enforce data locality and provide simplified programming interfaces. In fact, Sphere can simulate any MapReduce operations, but Sphere is more efficient and flexible. Sphere can provide better data locality for applications that process files or multiple files as minimum input units and for applications that involve with iterative/combinative processing, which requires coordination of multiple UDFs to obtain the final result.

A Sphere application includes two parts: the client program that organizes inputs (including certain parameters), outputs, and UDFs; and the UDFs that process data segments. Data segmentation, load balancing, and fault tolerance are transparent to developers.

Space: Column-based Distbuted Data Table

Space stores data tables in Sector and uses Sphere for parallel query processing. Space is similar to BigTable. Table is stored by columns and is segmented on to multiple slave nodes. Tables are independent and no relationship between tables are supported. A reduced set of SQL operations is supported, including but not limited to table creation and modification, key-value update and lookup, and select operations based on UDF.

Supported by the Sector data placement mechanism and the Sphere parallel processing framework, Space can support efficient key-value lookup and certain SQL queries on very large data tables.

Space is currently still in development.

and just when you thought Hadoop was the only way to be on the cloud.

http://sector.sourceforge.net/benchmark.html

The Terasort Benchmark

The table below lists the performance (total processing time in seconds) of the Terasort benchmark of both Sphere and Hadoop. (Terasort benchmark: suppose there are N nodes in the system, the benchmark generates a 10GB file on each node and sorts the total N*10GB data. Data generation time is excluded.) Note that it is normal to see a longer processing time for more nodes because the total amount of data also increases proportionally.

The performance value listed in this page was achieved using the Open Cloud Testbed. Currently the testbed consists of 4 racks. Each rack has 32 nodes, including 1 NFS server, 1 head node, and 30 compute/slave nodes. The head node is a Dell 1950, dual dual-core Xeon 3.0GHz, 16GB RAM. The compute nodes are Dell 1435s, single dual core AMD Opteron 2.0GHz, 4GB RAM, and 1TB single disk. The 4 racks are located in JHU (Baltimore), StarLight (Chicago), UIC (Chicago), and Calit2(San Diego). The inter-rack bandwidth is 10GE, supported by CiscoWave deployed over National Lambda Rail.

Sphere
Hadoop (3 replicas)
Hadoop (1 replica)
UIC
1265 2889 2252
UIC + StarLight
1361 2896 2617
UIC + StarLight + Calit2
1430 4341 3069
UIC + StarLight + Calit2 + JHU
1526 6675 3702

The benchmark uses the testfs/testdc examples of Sphere and randomwriter/sort examples of Hadoop. Hadoop parameters were tuned to reach good results.

Updated on Sep. 22, 2009: We have benchmarked the most recent versions of Sector/Sphere (1.24a) and Hadoop (0.20.1) on a new set of servers. Each server node costs $2,200 and consits of a single Intel Xeon E5410 2.4GHz CPU, 16GB RAM, 4*1TB RAID0 disk, and 1Gb/s NIC. The 120 nodes are hosted on 4 racks within the same data center and the inter-rack bandwidth is 20Gb/s.

The table below lists the performance of sorting 1TB data using Sector/Sphere version 1.24a and Hadoop 0.20.1. Related Hadoop parameters have been tuned for better performance (e.g., big block size), while Sector/Sphere does not require tuning. In addition, to achieve the highest performance, replication is disabled in both systems (note that replication does not afftect the performance of Sphere but will significantly decrease the performance of Hadoop).

Number of Racks
Sphere
Hadoop
1
28m 25s 85m 49s
2
15m 20s 37m 0s
3
10m 19s 25m 14s
4
7m 56s 17m 45s

Windows Azure vs Amazon EC2 (and Google Storage)

Here is a comparison of Windows Azure instances vs Amazon compute instances

Compute Instance Sizes:

Developers have the ability to choose the size of VMs to run their application based on the applications resource requirements. Windows Azure compute instances come in four unique sizes to enable complex applications and workloads.

Compute Instance Size CPU Memory Instance Storage I/O Performance
Small 1.6 GHz 1.75 GB 225 GB Moderate
Medium 2 x 1.6 GHz 3.5 GB 490 GB High
Large 4 x 1.6 GHz 7 GB 1,000 GB High
Extra large 8 x 1.6 GHz 14 GB 2,040 GB High

Standard Rates:

Windows Azure

  • Compute
    • Small instance (default): $0.12 per hour
    • Medium instance: $0.24 per hour
    • Large instance: $0.48 per hour
    • Extra large instance: $0.96 per hour
  • Storage
    • $0.15 per GB stored per month
    • $0.01 per 10,000 storage transactions
  • Content Delivery Network (CDN)
    • $0.15 per GB for data transfers from European and North American locations*
    • $0.20 per GB for data transfers from other locations*
    • $0.01 per 10,000 transactions*

Source –

http://www.microsoft.com/windowsazure/offers/popup/popup.aspx?lang=en&locale=en-US&offer=MS-AZR-0001P

and

http://www.microsoft.com/windowsazure/windowsazure/

Amazon EC2 has more options though——————————-

http://aws.amazon.com/ec2/pricing/

Standard On-Demand Instances Linux/UNIX Usage Windows Usage
Small (Default) $0.085 per hour $0.12 per hour
Large $0.34 per hour $0.48 per hour
Extra Large $0.68 per hour $0.96 per hour
Micro On-Demand Instances Linux/UNIX Usage Windows Usage
Micro $0.02 per hour $0.03 per hour
High-Memory On-Demand Instances
Extra Large $0.50 per hour $0.62 per hour
Double Extra Large $1.00 per hour $1.24 per hour
Quadruple Extra Large $2.00 per hour $2.48 per hour
High-CPU On-Demand Instances
Medium $0.17 per hour $0.29 per hour
Extra Large $0.68 per hour $1.16 per hour
Cluster Compute Instances
Quadruple Extra Large $1.60 per hour N/A*
* Windows is not currently available for Cluster Compute Instances.

http://aws.amazon.com/ec2/instance-types/

Standard Instances

Instances of this family are well suited for most applications.

Small Instance – default*

1.7 GB memory
1 EC2 Compute Unit (1 virtual core with 1 EC2 Compute Unit)
160 GB instance storage (150 GB plus 10 GB root partition)
32-bit platform
I/O Performance: Moderate
API name: m1.small

Large Instance

7.5 GB memory
4 EC2 Compute Units (2 virtual cores with 2 EC2 Compute Units each)
850 GB instance storage (2×420 GB plus 10 GB root partition)
64-bit platform
I/O Performance: High
API name: m1.large

Extra Large Instance

15 GB memory
8 EC2 Compute Units (4 virtual cores with 2 EC2 Compute Units each)
1,690 GB instance storage (4×420 GB plus 10 GB root partition)
64-bit platform
I/O Performance: High
API name: m1.xlarge

Micro Instances

Instances of this family provide a small amount of consistent CPU resources and allow you to burst CPUcapacity when additional cycles are available. They are well suited for lower throughput applications and web sites that consume significant compute cycles periodically.

Micro Instance

613 MB memory
Up to 2 EC2 Compute Units (for short periodic bursts)
EBS storage only
32-bit or 64-bit platform
I/O Performance: Low
API name: t1.micro

High-Memory Instances

Instances of this family offer large memory sizes for high throughput applications, including database and memory caching applications.

High-Memory Extra Large Instance

17.1 GB of memory
6.5 EC2 Compute Units (2 virtual cores with 3.25 EC2 Compute Units each)
420 GB of instance storage
64-bit platform
I/O Performance: Moderate
API name: m2.xlarge

High-Memory Double Extra Large Instance

34.2 GB of memory
13 EC2 Compute Units (4 virtual cores with 3.25 EC2 Compute Units each)
850 GB of instance storage
64-bit platform
I/O Performance: High
API name: m2.2xlarge

High-Memory Quadruple Extra Large Instance

68.4 GB of memory
26 EC2 Compute Units (8 virtual cores with 3.25 EC2 Compute Units each)
1690 GB of instance storage
64-bit platform
I/O Performance: High
API name: m2.4xlarge

High-CPU Instances

Instances of this family have proportionally more CPU resources than memory (RAM) and are well suited for compute-intensive applications.

High-CPU Medium Instance

1.7 GB of memory
5 EC2 Compute Units (2 virtual cores with 2.5 EC2 Compute Units each)
350 GB of instance storage
32-bit platform
I/O Performance: Moderate
API name: c1.medium

High-CPU Extra Large Instance

7 GB of memory
20 EC2 Compute Units (8 virtual cores with 2.5 EC2 Compute Units each)
1690 GB of instance storage
64-bit platform
I/O Performance: High
API name: c1.xlarge

Cluster Compute Instances

Instances of this family provide proportionally high CPU resources with increased network performance and are well suited for High Performance Compute (HPC) applications and other demanding network-bound applications. Learn more about use of this instance type for HPC applications.

Cluster Compute Quadruple Extra Large Instance

23 GB of memory
33.5 EC2 Compute Units (2 x Intel Xeon X5570, quad-core “Nehalem” architecture)
1690 GB of instance storage
64-bit platform
I/O Performance: Very High (10 Gigabit Ethernet)
API name: cc1.4xlarge

Also http://www.microsoft.com/en-us/sqlazure/default.aspx

offers SQL Databases as a service with a free trial offer

If you are into .Net /SQL big time or too dependent on MS, Azure is a nice option to EC2 http://www.microsoft.com/windowsazure/offers/popup/popup.aspx?lang=en&locale=en-US&offer=COMPARE_PUBLIC

Updated- I just got approved for Google Storage so am adding their info- though they are in Preview (and its free right now) 🙂

https://code.google.com/apis/storage/docs/overview.html

Functionality

Google Storage for Developers offers a rich set of features and capabilities:

Basic Operations

  • Store and access data from anywhere on the Internet.
  • Range-gets for large objects.
  • Manage metadata.

Security and Sharing

  • User authentication using secret keys or Google account.
  • Authenticated downloads from a web browser for Google account holders.
  • Secure access using SSL.
  • Easy, powerful sharing and collaboration via ACLs for individuals and groups.

Performance and scalability

  • Up to 100 gigabytes per object and 1,000 buckets per account during the preview.
  • Strong data consistency—read-after-write consistency for all upload and delete operations.
  • Namespace for your domain—only you can create bucket URIs containing your domain name.
  • Data replicated in multiple data centers across the U.S. and within the same data center.

Tools

  • Web-based storage manager.
  • GSUtil, an open source command line tool.
  • Compatible with many existing cloud storage tools and libraries.

Read the Getting Started Guide to learn more about the service.

Note: Google Storage for Developers does not support Google Apps accounts that use your company domain name at this time.

Back to top

Pricing

Google Storage for Developers pricing is based on usage.

  • Storage—$0.17/gigabyte/month
  • Network
    • Upload data to Google
      • $0.10/gigabyte
    • Download data from Google
      • $0.15/gigabyte for Americas and EMEA
      • $0.30/gigabyte for Asia-Pacific
  • Requests
    • PUT, POST, LIST—$0.01 per 1,000 requests
    • GET, HEAD—$0.01 per 10,000 requests

Matlab-Mathematica-R and GPU Computing

Matlab announced they have a parallel computing toolbox- specially to enable GPU computing as well

http://www.mathworks.com/products/parallel-computing/

Parallel Computing Toolbox™ lets you solve computationally and data-intensive problems using multicore processors, GPUs, and computer clusters. High-level constructs—parallel for-loops, special array types, and parallelized numerical algorithms—let you parallelize MATLAB® applications without CUDA or MPI programming. You can use the toolbox with Simulink® to run multiple simulations of a model in parallel.

MATLAB GPU Support

The toolbox provides eight workers (MATLAB computational engines) to execute applications locally on a multicore desktop. Without changing the code, you can run the same application on a computer cluster or a grid computing service (using MATLAB Distributed Computing Server™). You can run parallel applications interactively or in batch.

Parallel Computing with MATLAB on Amazon Elastic Compute Cloud (EC2)

Also a video of using Mathematica and GPU

Also R has many packages for GPU computing

Parallel computing: GPUs

from http://cran.r-project.org/web/views/HighPerformanceComputing.html

  • The gputools package by Buckner provides several common data-mining algorithms which are implemented using a mixture of nVidia‘s CUDA langauge and cublas library. Given a computer with an nVidia GPU these functions may be substantially more efficient than native R routines. The rpud package provides an optimised distance metric for NVidia-based GPUs.
  • The cudaBayesreg package by da Silva implements the rhierLinearModel from the bayesm package using nVidia’s CUDA langauge and tools to provide high-performance statistical analysis of fMRI voxels.
  • The rgpu package (see below for link) aims to speed up bioinformatics analysis by using the GPU.
  • The magma package provides an interface to the hybrid GPU/CPU library Magma (see below for link).
  • The gcbd package implements a benchmarking framework for BLAS and GPUs (using gputools).

I tried to search for SAS and GPU and SPSS and GPU but got nothing. Maybe they would do well to atleast test these alternative hardwares-

Also see Matlab on GPU comparison for the product Jacket vs Parallel Computing Toolbox

http://www.accelereyes.com/products/compare

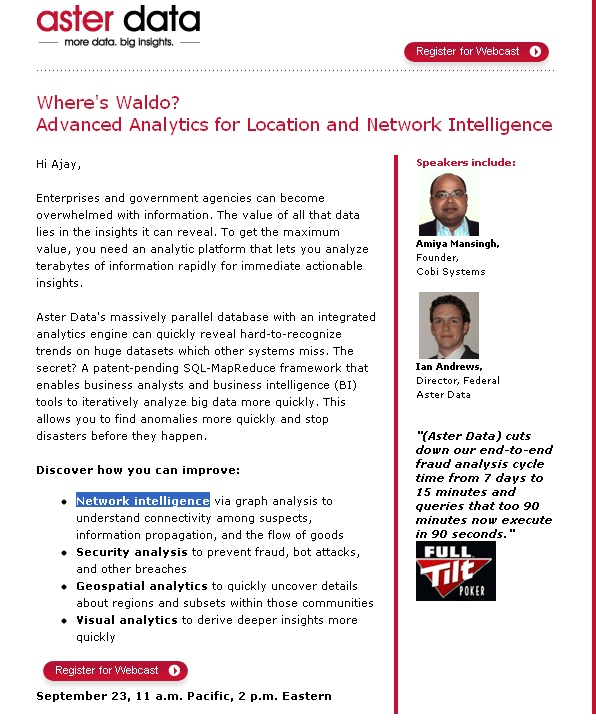
Where is Waldo? Webcast on Network Intelligence

From the good folks at AsterData, a webcast on a slightly interesting analytics topic

Enterprises and government agencies can become overwhelmed with information. The value of all that data lies in the insights it can reveal. To get the maximum value, you need an analytic platform that lets you analyze terabytes of information rapidly for immediate actionable insights.

Aster Data’s massively parallel database with an integrated analytics engine can quickly reveal hard-to-recognize trends on huge datasets which other systems miss. The secret? A patent-pending SQL-MapReduce framework that enables business analysts and business intelligence (BI) tools to iteratively analyze big data more quickly. This allows you to find anomalies more quickly and stop disasters before they happen.

Discover how you can improve:

  • Network intelligence via graph analysis to understand connectivity among suspects, information propagation, and the flow of goods
  • Security analysis to prevent fraud, bot attacks, and other breaches
  • Geospatial analytics to quickly uncover details about regions and subsets within those communities
  • Visual analytics to derive deeper insights more quickly

SAS/Blades/Servers/ GPU Benchmarks

Just checked out cool new series from NVidia servers.

Now though SAS Inc/ Jim Goodnight thinks HP Blade Servers are the cool thing- the GPU takes hardware high performance computing to another level. It would be interesting to see GPU based cloud computers as well – say for the on Demand SAS (free for academics and students) but which has had some complaints of being slow.

See this for SAS and Blade Servers-

http://www.sas.com/success/ncsu_analytics.html

To give users hands-on experience, the program is underpinned by a virtual computing lab (VCL), a remote access service that allows users to reserve a computer configured with a desired set of applications and operating system and then access that computer over the Internet. The lab is powered by an IBM BladeCenter infrastructure, which includes more than 500 blade servers, distributed between two locations. The assignment of the blade servers can be changed to meet shifts in the balance of demand among the various groups of users. Laura Ladrie, MSA Classroom Coordinator and Technical Support Specialist, says, “The virtual computing lab chose IBM hardware because of its quality, reliability and performance. IBM hardware is also energy efficient and lends itself well to high performance/low overhead computing.

Thats interesting since IBM now competes (as owner of SPSS) and also cooperates with SAS Institute

And

http://www.theaustralian.com.au/australian-it/the-world-according-to-jim-goodnight-blade-switch-slashes-job-times/story-e6frgakx-1225888236107

You’re effectively turbo-charging through deployment of many processors within the blade servers?

Yes. We’ve got machines with 192 blades on them. One of them has 202 or 203 blades. We’re using Hewlett-Packard blades with 12 CP cores on each, so it’s a total 2300 CPU cores doing the computation.

Our idea was to give every one of those cores a little piece of work to do, and we came up with a solution. It involved a very small change to the algorithm we were using, and it’s just incredible how fast we can do things now.

I don’t think of it as a grid, I think of it as essentially one computer. Most people will take a blade and make a grid out of it, where everything’s a separate computer running separate jobs.

We just look at it as one big machine that has memory and processors all over the place, so it’s a totally different concept.

GPU servers can be faster than CPU servers, though , Professor G.


Source-

http://www.nvidia.com/object/preconfigured_clusters.html

TESLA GPU COMPUTING SOLUTIONS FOR DATA CENTERS
Supercharge your cluster with the Tesla family of GPU computing solutions. Deploy 1U systems from NVIDIA or hybrid CPU-GPU servers from OEMs that integrate NVIDIA® Tesla™ GPU computing processors.

When compared to the latest quad-core CPU, Tesla 20-series GPU computing processors deliver equivalent performance at 1/20th the power consumption and 1/10th the cost. Each Tesla GPU features hundreds of parallel CUDA cores and is based on the revolutionary NVIDIA® CUDA™ parallel computing architecture with a rich set of developer tools (compilers, profilers, debuggers) for popular programming languages APIs like C, C++, Fortran, and driver APIs like OpenCL and DirectCompute.

NVIDIA’s partners provide turnkey easy-to-deploy Preconfigured Tesla GPU clusters that are customizable to your needs. For 3D cloud computing applications, our partners offer the Tesla RS clusters that are optimized for running RealityServer with iray.

Available Tesla Products for Data Centers:
– Tesla S2050
– Tesla M2050/M2070
– Tesla S1070
– Tesla M1060

Also I liked the hybrid GPU and CPU

And from a paper on comparing GPU and CPU using Benchmark tests on BLAS from a Debian- Dirk E’s excellent blog

http://dirk.eddelbuettel.com/blog/

Usage of accelerated BLAS libraries seems to shrouded in some mystery, judging from somewhat regularly recurring requests for help on lists such as r-sig-hpc(gmane version), the R list dedicated to High-Performance Computing. Yet it doesn’t have to be; installation can be really simple (on appropriate systems).

Another issue that I felt needed addressing was a comparison between the different alternatives available, quite possibly including GPU computing. So a few weeks ago I sat down and wrote a small package to run, collect, analyse and visualize some benchmarks. That package, called gcbd (more about the name below) is now onCRAN as of this morning. The package both facilitates the data collection for the paper it also contains (in the vignette form common among R packages) and provides code to analyse the data—which is also included as a SQLite database. All this is done in the Debian and Ubuntu context by transparently installing and removing suitable packages providing BLAS implementations: that we can fully automate data collection over several competing implementations via a single script (which is also included). Contributions of benchmark results is encouraged—that is the idea of the package.

And from his paper on the same-

Analysts are often eager to reap the maximum performance from their computing platforms.

A popular suggestion in recent years has been to consider optimised basic linear algebra subprograms (BLAS). Optimised BLAS libraries have been included with some (commercial) analysis platforms for a decade (Moler 2000), and have also been available for (at least some) Linux distributions for an equally long time (Maguire 1999). Setting BLAS up can be daunting: the R language and environment devotes a detailed discussion to the topic in its Installation and Administration manual (R Development Core Team 2010b, appendix A.3.1). Among the available BLAS implementations, several popular choices have emerged. Atlas (an acronym for Automatically Tuned Linear Algebra System) is popular as it has shown very good performance due to its automated and CPU-speci c tuning (Whaley and Dongarra 1999; Whaley and Petitet 2005). It is also licensed in such a way that it permits redistribution leading to fairly wide availability of Atlas.1 We deploy Atlas in both a single-threaded and a multi-threaded con guration. Another popular BLAS implementation is Goto BLAS which is named after its main developer, Kazushige Goto (Goto and Van De Geijn 2008). While `free to use’, its license does not permit redistribution putting the onus of con guration, compilation and installation on the end-user. Lastly, the Intel Math Kernel Library (MKL), a commercial product, also includes an optimised BLAS library. A recent addition to the tool chain of high-performance computing are graphical processing units (GPUs). Originally designed for optimised single-precision arithmetic to accelerate computing as performed by graphics cards, these devices are increasingly used in numerical analysis. Earlier criticism of insucient floating-point precision or severe performance penalties for double-precision calculation are being addressed by the newest models. Dependence on particular vendors remains a concern with NVidia’s CUDA toolkit (NVidia 2010) currently still the preferred development choice whereas the newer OpenCL standard (Khronos Group 2008) may become a more generic alternative that is independent of hardware vendors. Brodtkorb et al. (2010) provide an excellent recent survey. But what has been lacking is a comparison of the e ective performance of these alternatives. This paper works towards answering this question. By analysing performance across ve di erent BLAS implementations|as well as a GPU-based solution|we are able to provide a reasonably broad comparison.

Performance is measured as an end-user would experience it: we record computing times from launching commands in the interactive R environment (R Development Core Team 2010a) to their completion.

And

Basic Linear Algebra Subprograms (BLAS) provide an Application Programming Interface
(API) for linear algebra. For a given task such as, say, a multiplication of two conformant
matrices, an interface is described via a function declaration, in this case sgemm for single
precision and dgemm for double precision. The actual implementation becomes interchangeable
thanks to the API de nition and can be supplied by di erent approaches or algorithms. This
is one of the fundamental code design features we are using here to benchmark the di erence
in performance from di erent implementations.
A second key aspect is the di erence between static and shared linking. In static linking,
object code is taken from the underlying library and copied into the resulting executable.
This has several key implications. First, the executable becomes larger due to the copy of
the binary code. Second, it makes it marginally faster as the library code is present and
no additional look-up and subsequent redirection has to be performed. The actual amount
of this performance penalty is the subject of near-endless debate. We should also note that
this usually amounts to only a small load-time penalty combined with a function pointer
redirection|the actual computation e ort is unchanged as the actual object code is identi-
cal. Third, it makes the program more robust as fewer external dependencies are required.
However, this last point also has a downside: no changes in the underlying library will be
reected in the binary unless a new build is executed. Shared library builds, on the other
hand, result in smaller binaries that may run marginally slower|but which can make use of
di erent libraries without a rebuild.

Basic Linear Algebra Subprograms (BLAS) provide an Application Programming Interface(API) for linear algebra. For a given task such as, say, a multiplication of two conformantmatrices, an interface is described via a function declaration, in this case sgemm for singleprecision and dgemm for double precision. The actual implementation becomes interchangeablethanks to the API de nition and can be supplied by di erent approaches or algorithms. Thisis one of the fundamental code design features we are using here to benchmark the di erencein performance from di erent implementations.A second key aspect is the di erence between static and shared linking. In static linking,object code is taken from the underlying library and copied into the resulting executable.This has several key implications. First, the executable becomes larger due to the copy ofthe binary code. Second, it makes it marginally faster as the library code is present andno additional look-up and subsequent redirection has to be performed. The actual amountof this performance penalty is the subject of near-endless debate. We should also note thatthis usually amounts to only a small load-time penalty combined with a function pointerredirection|the actual computation e ort is unchanged as the actual object code is identi-cal. Third, it makes the program more robust as fewer external dependencies are required.However, this last point also has a downside: no changes in the underlying library will bereected in the binary unless a new build is executed. Shared library builds, on the otherhand, result in smaller binaries that may run marginally slower|but which can make use ofdi erent libraries without a rebuild.

And summing up,

reference BLAS to be dominated in all cases. Single-threaded Atlas BLAS improves on the reference BLAS but loses to multi-threaded BLAS. For multi-threaded BLAS we nd the Goto BLAS dominate the Intel MKL, with a single exception of the QR decomposition on the xeon-based system which may reveal an error. The development version of Atlas, when compiled in multi-threaded mode is competitive with both Goto BLAS and the MKL. GPU computing is found to be compelling only for very large matrix sizes. Our benchmarking framework in the gcbd package can be employed by others through the R packaging system which could lead to a wider set of benchmark results. These results could be helpful for next-generation systems which may need to make heuristic choices about when to compute on the CPU and when to compute on the GPU.

Source – DirkE’paper and blog http://dirk.eddelbuettel.com/papers/gcbd.pdf

Quite appropriately-,

Hardware solutions or atleast need to be a part of Revolution Analytic’s thinking as well. SPSS does not have any choice anymore though 😉

It would be interesting to see how the new SAS Cloud Computing/ Server Farm/ Time Sharing facility is benchmarking CPU and GPU for SAS analytics performance – if being done already it would be nice to see a SUGI paper on the same at http://sascommunity.org.

Multi threading needs to be taken care automatically by statistical software to optimize current local computing (including for New R)

Acceptable benchmarks for testing hardware as well as software need to be reinforced and published across vendors, academics  and companies.

What do you think?