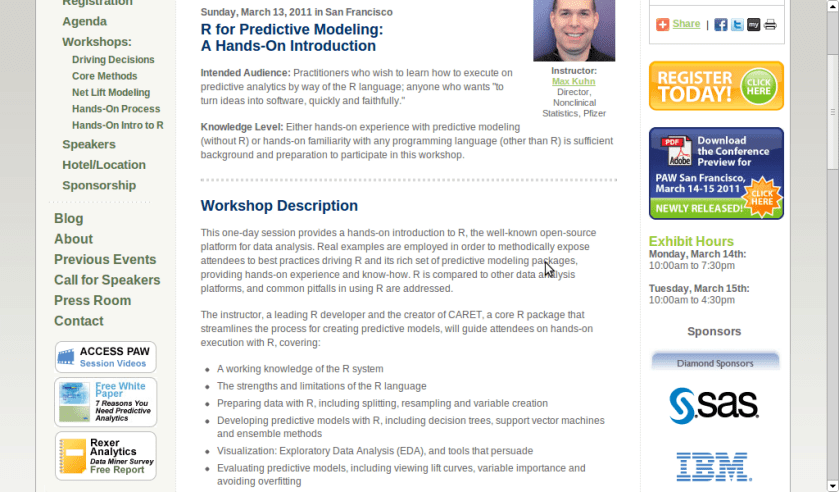
A workshop on using R for Predictive Modeling, by the Director, Non Clinical Stats, Pfizer. Interesting Bay Area Event- part of next edition of Predictive Analytics World
Sunday, March 13, 2011 in San Francisco
R for Predictive Modeling:
A Hands-On Introduction
Intended Audience: Practitioners who wish to learn how to execute on predictive analytics by way of the R language; anyone who wants “to turn ideas into software, quickly and faithfully.”
Knowledge Level: Either hands-on experience with predictive modeling (without R) or hands-on familiarity with any programming language (other than R) is sufficient background and preparation to participate in this workshop.
Workshop Description
This one-day session provides a hands-on introduction to R, the well-known open-source platform for data analysis. Real examples are employed in order to methodically expose attendees to best practices driving R and its rich set of predictive modeling packages, providing hands-on experience and know-how. R is compared to other data analysis platforms, and common pitfalls in using R are addressed.
The instructor, a leading R developer and the creator of CARET, a core R package that streamlines the process for creating predictive models, will guide attendees on hands-on execution with R, covering:
A working knowledge of the R system
The strengths and limitations of the R language
Preparing data with R, including splitting, resampling and variable creation
Developing predictive models with R, including decision trees, support vector machines and ensemble methods
Visualization: Exploratory Data Analysis (EDA), and tools that persuade
Evaluating predictive models, including viewing lift curves, variable importance and avoiding overfitting
Hardware: Bring Your Own Laptop
Each workshop participant is required to bring their own laptop running Windows or OS X. The software used during this training program, R, is free and readily available for download.
Attendees receive an electronic copy of the course materials and related R code at the conclusion of the workshop.
Max Kuhn, Director, Nonclinical Statistics, Pfizer
Max Kuhn is a Director of Nonclinical Statistics at Pfizer Global R&D in Connecticut. He has been apply models in the pharmaceutical industries for over 15 years.
He is a leading R developer and the author of several R packages including the CARET package that provides a simple and consistent interface to over 100 predictive models available in R.
Mr. Kuhn has taught courses on modeling within Pfizer and externally, including a class for the India Ministry of Information Technology.
Here is an interview with Prof Luis Torgo, author of the recent best seller “Data Mining with R-learning with case studies”.
Ajay- Describe your career in science. How do you think can more young people be made interested in science.
Luis- My interest in science only started after I’ve finished my degree. I’ve entered a research lab at the University of Porto and started working on Machine Learning, around 1990. Since then I’ve been involved generally in data analysis topics both from a research perspective as well as from a more applied point of view through interactions with industry partners on several projects. I’ve spent most of my career at the Faculty of Economics of the University of Porto, but since 2008 I’m at the department of Computer Science of the Faculty of Sciences of the same university. At the same time I’ve been a researcher at LIAAD / Inesc Porto LA (www.liaad.up.pt).
I like a lot what I do and like science and the “scientific way of thinking”, but I cannot say that I’ve always thought of this area as my “place”. Most of all I like solving challenging problems through data analysis. If that translates into some scientific outcome than I’m more satisfied but that is not my main goal, though I’m kind of “forced” to think about that because of the constraints of an academic career.
That does not mean I’m not passionate about science, I just think there are many more ways of “doing science” than what is reflected in the usual “scientific indicators” that most institutions seem to be more and more obsessed about.
Regards interesting young people in science that is a hard question that I’m not sure I’m qualified to answer. I do tend to think that young people are more sensible to concrete examples of problems they think are interesting and that science helps in solving, as a way of finding a motivation for facing the hard work they will encounter in a scientific career. I do believe in case studies as a nice way to learn and motivate, and thus my book 😉
Ajay- Describe your new book “Data Mining with R, learning with case studies” Why did you choose a case study based approach? who is the target audience? What is your favorite case study from the book
Luis- This book is about learning how to use R for data mining. The book follows a “learn by doing it” approach to data mining instead of the more common theoretical description of the available techniques in this discipline. This is accomplished by presenting a series of illustrative case studies for which all necessary steps, code and data are provided to the reader. Moreover, the book has an associated web page (www.liaad.up.pt/~ltorgo/DataMiningWithR) where all code inside the book is given so that easy copy-paste is possible for the more lazy readers.
The language used in the book is very informal without many theoretical details on the used data mining techniques. For obtaining these theoretical insights there are already many good data mining books some of which are referred in “further readings” sections given throughout the book. The decision of following this writing style had to do with the intended target audience of the book.
In effect, the objective was to write a monograph that could be used as a supplemental book for practical classes on data mining that exist in several courses, but at the same time that could be attractive to professionals working on data mining in non-academic environments, and thus the choice of this more practically oriented approach.
Regards my favorite case study that is a hard question for an author… still I would probably choose the “Predicting Stock Market Returns” case study (Chapter 3). Not only because I like this challenging problem, but mainly because the case study addresses all aspects of knowledge discovery in a real world scenario and not only the construction of predictive models. It tackles data collection, data pre-processing, model construction, transforming predictions into actions using different trading policies, using business-related performance metrics, implementing a trading simulator for “real-world” evaluation, and laying out grounds for constructing an online trading system.
Obviously, for all these steps there are far too many options to be possible to describe/evaluate all of them in a chapter, still I do believe that for the reader it is important to see the overall picture, and read about the relevant questions on this problem and some possible paths that can be followed at these different steps.
In other words: do not expect to become rich with the solution I describe in the chapter !
Ajay- Apart from R, what other data mining software do you use or have used in the past. How would you compare their advantages and disadvantages with R
Luis- I’ve played around with Clementine, Weka, RapidMiner and Knime, but really only playing with teaching goals, and no serious use/evaluation in the context of data mining projects. For the latter I mainly use R or software developed by myself (either in R or other languages). In this context, I do not think it is fair to compare R with these or other tools as I lack serious experience with them. I can however, tell you about what I see as the main pros and cons of R. The main reason for using R is really not only the power of the tool that does not stop surprising me in terms of what already exists and keeps appearing as contributions of an ever growing community, but mainly the ability of rapidly transforming ideas into prototypes. Regards some of its drawbacks I would probably mention the lack of efficiency when compared to other alternatives and the problem of data set sizes being limited by main memory.
I know that there are several efforts around for solving this latter issue not only from the community (e.g. http://cran.at.r-project.org/web/views/HighPerformanceComputing.html), but also from the industry (e.g. Revolution Analytics), but I would prefer that at this stage this would be a standard feature of the language so the the “normal” user need not worry about it. But then this is a community effort and if I’m not happy with the current status instead of complaining I should do something about it!
Ajay- Describe your writing habit- How do you set about writing the book- did you write a fixed amount daily or do you write in bursts etc
Luis- Unfortunately, I write in bursts whenever I find some time for it. This is much more tiring and time consuming as I need to read back material far too often, but I cannot afford dedicating too much consecutive time to a single task. Actually, I frequently tease my PhD students when they “complain” about the lack of time for doing what they have to, that they should learn to appreciate the luxury of having a single task to complete because it will probably be the last time in their professional life!
Ajay- What do you do to relax or unwind when not working?
Luis- For me, the best way to relax from work is by playing sports. When I’m involved in some game I reset my mind and forget about all other things and this is very relaxing for me. A part from sports I enjoy a lot spending time with my family and friends. A good and long dinner with friends over a good bottle of wine can do miracles when I’m too stressed with work! Finally,I do love traveling around with my family.
Short Bio: Luis Torgo has a degree in Systems and Informatics Engineering and a PhD in Computer Science. He is an Associate Professor of the Department of Computer Science of the Faculty of Sciences of the University of Porto. He is also a researcher of the Laboratory of Artificial Intelligence and Data Analysis (LIAAD) belonging to INESC Porto LA. Luis Torgo has been an active researcher in Machine Learning and Data Mining for more than 20 years. He has lead several academic and industrial Data Mining research projects. Luis Torgo accompanies the R project almost since its beginning, using it on his research activities. He teaches R at different levels and has given several courses in different countries.
For reading “Data Mining with R” – you can visit this site, also to avail of a 20% discount the publishers have generously given (message below)-
For more information and to place an order, visit us at http://www.crcpress.com. Order online and apply 20% Off discount code 907HM at checkout. CRC is pleased to offer free standard shipping on all online orders!
Price: $79.95 Cat. #: K10510 ISBN: 9781439810187 ISBN 10: 1439810184 Publication Date: November 09, 2010 Number of Pages: 305 Availability: In Stock Binding(s): Hardback
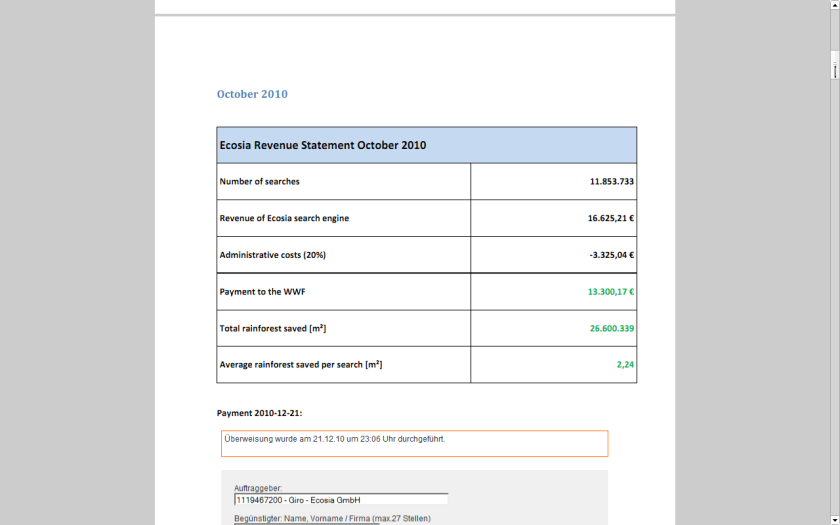
I recently found an interesting example of a website that both makes a lot of money and yet is much more efficient than any free or non profit. It is called ECOSIA
If you see a website that wants to balance administrative costs plus have a transparent way to make the world better- this is a great example.
World’s largest tropical forest reserve (38,867 square kilometers, or about the size of Switzerland)
Home to about 14% of all amphibian species and roughly 54% of all bird species in the Amazon – not to mention large populations of at least eight threatened species, including the jaguar
Includes part of the Guiana Shield containing 25% of world’s remaining tropical rainforests – 80 to 90% of which are still pristine
Holds the last major unpolluted water reserves in the Neotropics, containing approximately 20% of all of the Earth’s water
One of the last tropical regions on Earth vastly unaltered by humans
Significant contributor to climatic regulation via heat absorption and carbon storage
Click per milli (or CPM) gives you a very low low conversion compared to contacting ad sponsor directly.
But its a great data experiment-
as you can monitor which companies are likely to be advertised on your site (assume google knows more about their algols than you will)
which formats -banner or text or flash have what kind of conversion rates
what are the expected pay off rates from various keywords or companies (like business intelligence software, predictive analytics software and statistical computing software are similar but have different expected returns (if you remember your eco class)
NOW- Based on above data, you know whats your minimum baseline to expect from a private advertiser than a public, crowd sourced search engine one (like Google or Bing)
Lets say if you have 100000 views monthly. and assume one out of 1000 page views will lead to a click. Say the advertiser will pay you 1 $ for every 1 click (=1000 impressions)
Then your expected revenue is $100.But if your clicks are priced at 2.5$ for every click , and your click through rate is now 3 out of 1000 impressions- (both very moderate increases that can done by basic placement optimization of ad type, graphics etc)-your new revenue is 750$.
Be a good Samaritan- you decide to share some of this with your audience -like 4 Amazon books per month ( or I free Amazon book per week)- That gives you a cost of 200$, and leaves you with some 550$.
Wait! it doesnt end there- Adam Smith‘s invisible hand moves on .
You say hmm let me put 100 $ for an annual paper writing contest of $1000, donate $200 to one laptop per child ( or to Amazon rain forests or to Haiti etc etc etc), pay $100 to your upgraded server hosting, and put 350$ in online advertising. say $200 for search engines and $150 for Facebook.
Woah!
Month 1 would should see more people visiting you for the first time. If you have a good return rate (returning visitors as a %, and low bounce rate (visits less than 5 secs)- your traffic should see atleast a 20% jump in new arrivals and 5-10 % in long term arrivals. Ignoring bounces- within three months you will have one of the following
1) An interesting case study on statistics on online and social media advertising, tangible motivations for increasing community response , and some good data for study
2) hopefully better cost management of your server expenses
3)very hopefully a positive cash flow
you could even set a percentage and share the monthly (or annually is better actions) to your readers and advertisers.
go ahead- change the world!
the key paradigms here are sharing your traffic and revenue openly to everyone
donating to a suitable cause
helping increase awareness of the suitable cause
basing fixed percentages rather than absolute numbers to ensure your site and cause are sustained for years.
The following is an auto generated post thanks to WordPress.com stats team- clearly they have got some stuff wrong
1) Defining the speedometer quantitatively
2) The busiest day numbers are plain wrong ( 2 views ??)
3) There is still no geographic data in WordPress -com stats (unlike Google Analytics) and I cant enable Google Analytics on a wordpress.com hosted site.
The stats helper monkeys at WordPress.com mulled over how this blog did in 2010, and here’s a high level summary of its overall blog health:
The Blog-Health-o-Meter™ reads Wow.
Crunchy numbers
The Louvre Museum has 8.5 million visitors per year. This blog was viewed about 97,000 times in 2010. If it were an exhibit at The Louvre Museum, it would take 4 days for that many people to see it.
In 2010, there were 367 new posts, growing the total archive of this blog to 1191 posts. There were 411 pictures uploaded, taking up a total of 121mb. That’s about 1 pictures per day.
The top referring sites in 2010 were r-bloggers.com, reddit.com, rattle.togaware.com, twitter.com, and Google Reader.
Some visitors came searching, mostly for libre office, facebook analytics, test drive a chrome notebook, test drive a chrome notebook., and wps sas lawsuit.
Attractions in 2010
These are the posts and pages that got the most views in 2010.
My annual traffic to this blog was almost 99,000 . Add in additional views on networking sites plus the 400 plus RSS readers- so I can say traffic was 1,20,000 for 2010. Nice. Thanks for reading and hope it was worth your time. (this is a long post and will take almost 440 secs to read but the summary is just given)
My intent is either to inform you, give something useful or atleast something interesting.
see below-
Jan
Feb
Mar
Apr
May
Jun
2010
6,311
4,701
4,922
5,463
6,493
4,271
Jul
Aug
Sep
Oct
Nov
Dec
Total
5,041
5,403
17,913
16,430
11,723
10,096
98,767
Sandro Saita from http://www.dataminingblog.com/ just named me for an award on his blog (but my surname is ohRi , Sandro left me without an R- What would I be without R :)) ).
Aw! I am touched. Google for “Data Mining Blog” and Sandro is the best that it is in data mining writing.
”
DMR People Award 2010
There are a lot of active people in the field of data mining. You can discuss with them on forums. You can read their blogs. You can also meet them in events such as PAW or KDD. Among the people I follow on a regular basis, I have elected:
Ajay Ori
He has been very active in 2010, especially on his blog . Good work Ajay and continue sharing your experience with us!”
What did I write in 2010- stuff.
What did you read on this blog- well thats the top posts list.
well I guess I owe Tal G for almost 9000 views ( incidentally I withdrew posting my blog from R- Bloggers and Analyticbridge blogs – due to SEO keyword reasons and some spam I was getting see (below))
Still reading this post- gosh let me sell you some advertising. It is only $100 a month (yes its a recession)
Advertisers are treated on First in -Last out (FILO)
I have been told I am obsessed with SEO , but I dont care much for search engines apart from Google, and yes SEO is an interesting science (they should really re name it GEO or Google Engine Optimization)
Apparently Hadley Wickham and Donald Farmer are big keywords for me so I should be more respectful I guess.
Search Terms for 365 days ending 2010-12-31 (Summarized)
2009-12-31 to Today
Search
Views
libre office
925
facebook analytics
798
test drive a chrome notebook
467
test drive a chrome notebook.
215
r gui
203
data mining
163
wps sas lawsuit
158
wordle.net
133
wps sas
123
google maps jet ski
123
test drive chrome notebook
96
sas wps
89
sas wps lawsuit
85
chrome notebook test drive
83
decision stats
83
best statistics software
74
hadley wickham
72
google maps jetski
72
libreoffice
70
doug savage
65
hive tutorial
58
funny india
56
spss certification
52
donald farmer microsoft
51
best statistical software
49
What about outgoing links? Apparently I need to find a way to ask Google to pay me for the free advertising I gave their chrome notebook launch. But since their search engine and browser is free to me, guess we are even steven.
Clicks for 365 days ending 2010-12-31 (Summarized)
Using two Chrome Extensions, Disconnect and AdBlock you can be sure of having a vary very clean browsing experience-it is recommended especially if you dont like the auto sharing of your personal preferences and cannot be bothered by the Byzantine maze of social media privacy fineprint.
* Search depersonalization is now optional and off by default. Click the “d” button then the “Depersonalize searches” checkbox to turn this feature on (or back off in case you have trouble getting to Google or Yahoo services). For help with anything else, see the known issues below and ask questions at http://j.mp/dnewgroup.

§

If you’re a typical web user, you’re unintentionally sending your browsing and search history with your name and other personal information to third parties and search engines whenever you’re online.

Take control of the data you share with Disconnect!

From the developer of the top-10-rated Facebook Disconnect extension, Disconnect lets you:

• Disable tracking by third parties like Digg, Facebook, Google, Twitter, and Yahoo, without requiring any setup or significantly degrading the usability of the web.

• Truly depersonalize searches on search engines like Google and Yahoo (by blocking identifying cookies not just changing the appearance of results pages), while staying logged into other services — e.g., so you can search anonymously on Google and access iGoogle at once.

• See how many resource and cookie requests are blocked, in real time
=================

New in version 2.1: Translated into dozens of languages!
New in version 2.0: Ads are blocked from downloading, instead of just being removed after the fact!

=======================

The official AdBlock For Chrome!  Block all advertisements on all web pages.  Your browser is automatically updated with additions to the filter: just click Install, then visit your favorite website and see the ads disappear!

FAQs:1. This is the official AdBlock extension: the original ad blocker written from the ground up to be optimized in Chrome.  There's an unrelated, older Firefox project called Adblock Plus, and they're working on making a Chrome version out of the old AdThwart codebase.  At the moment AdBlock blocks some ads that AdThwart only hides, but they're working to improve it.  It's available at bit.ly/id2Gqx; if you have trouble with AdBlock, they're good guys and a fine alternative!
We have a limited number of Chrome notebooks to distribute, and we need to ensure that they find good homes. That’s where you come in. Everything is still very much a work in progress, and it’s users, like you, that often give us our best ideas about what feels clunky or what’s missing. So if you live in the United States, are at least 18 years old, and would like to be considered for our small Pilot program, please fill this out. It should take about 15 minutes. We’ll review the requests that come in and contact you if you’ve been selected.
This application will be open until 11:59:59 PM PST on December 21, 2010.








 r-bloggers.com
 Reddit
 Twitter
 Google
 en.wordpress.com
 xianblog.wordpress.com

 (184) – 44,284 users – Weekly installs: 24,086


 Business
 Education
 Non-Profit
 Developer
 Individual
