PAW Reception and R Meetup

New DC meetup for R Users-

source- http://www.meetup.com/R-users-DC/calendar/14236478/

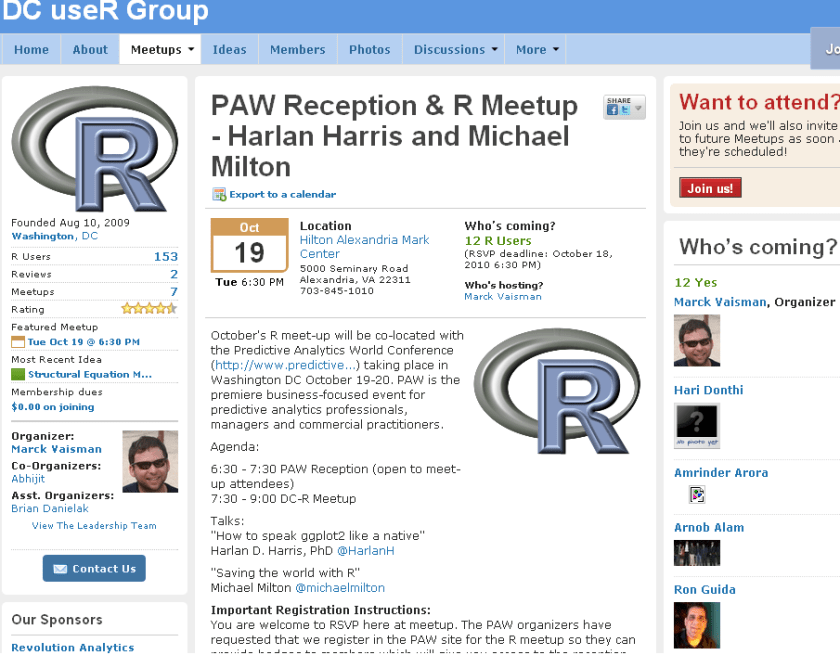
October’s R meet-up will be co-located with the Predictive Analytics World Conference (http://www.predictive…) taking place in Washington DC October 19-20. PAW is the premiere business-focused event for predictive analytics professionals, managers and commercial practitioners.

Agenda:

6:30 – 7:30 PAW Reception (open to meet-up attendees)
7:30 – 9:00 DC-R Meetup

Talks:
“How to speak ggplot2 like a native”
Harlan D. Harris, PhD @HarlanH

“Saving the world with R”
Michael Milton @michaelmilton

Important Registration Instructions:
You are welcome to RSVP here at meetup. The PAW organizers have requested that we register in the PAW site for the R meetup so they can provide badges to members which will give you access to the reception. There is no charge to register using the PAW site. Please click here to register.


Speaker Bios

Harlan D. Harris, PhD, is a statistical data scientist working for Kaplan Test Prep and Admissions in New York City. He has degrees from the University of Wisconsin-Madison and the University of Illinois at Urbana-Champaign. Prior to turning to the private sector, he worked as a researcher and lecturer in various areas of Artificial Intelligence and Cognitive Science at the University of Illinois, Columbia University, the University of Connecticut, and New York University.

Harlan’s talk is titled “How to speak ggplot2 like a native.”. One of the most innovative ideas in data visualization in recent years is that graphical images can be described using a grammar. Just as a fluent speaker of a language can talk more precisely and clearly than someone using a tourist phrasebook, graphics based on a grammar can yield more insights than graphics based on a limited set of templates (bar chart, pie graph, etc.). There are at least two implementations of the Grammar of Graphics idea in R, of which the most popular is the ggplot2 package written by Prof. Hadley Wickham. Just as with natural languages, ggplot2 has a surface structure made up of R vocabulary elements, as well as a deep structure that mediates the link between the vocabulary and the “semantic” representation of the data shown on a computer screen. In this introductory presentation, the links among these levels of representation are demonstrated, so that new ggplot2 users can build the mental models necessary for fluent and creative visualization of their data.

Michael Milton is a Client Manager at Blue State Digital. When he’s not saving the world by designing interactive marketing strategies that connect passionate users with causes and organizations, he writes about data and analytics. For O’Reilly Media, he wrote Head First Data Analysis and Head First Excel and has created the videos Great R: Level 1 and Getting the Most Out of Google Apps for Business.

Michael’s talk is called “How to Save the World Using R.” In this wide-ranging discussion, Michael will highlight individuals and organizations who are using R to help others as well as ways in which R can be used to promote good statistical thinking.

Red Hat worth 7.8 Billion now

I was searching for a Linux install of Revolution’s latest enterprise version, but it seems version 4 will be available on Red Hat Enterprise Linux only by Decemebr 2010. Also even though Revolution once opted for co branding with Canonical’s Karmic Koala, they seem to have ignored Ubuntu from the Enterprise version of Revolution R.

http://www.revolutionanalytics.com/why-revolution-r/which-r-is-right-for-me.php

Base R Revolution R Community Revolution R Enterprise
Buy Now
Target Use Open Source Product Evaluation & Simple Prototyping Business, Research & Academics
Software
100% Compatible with R language X X X
Certified for Stability X X
Command-Line Programming X X X
Getting Started Guide X X
Performance & Scalability
Analyze larger data sets with 64-bit RAM X X
Optimized for Multi-processor workstations X X
Multi-threaded Math libraries X X
Parallel Programming (Single Workstation) X X
Out-of-the-Box Cluster-Ready X
“Big Data” Analysis
Terabyte-Class File Structures X
Specialized “Big Data” Algorithms X
Integrated Web Services
Scalable Web Services Platform X*
User Interface
Visual IDE X
Comprehensive Data Analysis GUI X*
Technical Support
Discussion Forums X X X
Online Support Mailing List Forum X
Email Support X
Phone Support X
Support for Base & Recommended R Packages X X X
Authorized Training & Consulting X
Platforms
Single User X X X
Multi-User Server X X
32-bit Windows X X X
64-bit Windows X X
Mac OS X X X
Ubuntu Linux X X
Red Hat Enterprise Linux X
Cloud-Ready X

and though the page on RED HAT’s Partner page for Revolution seems old/not so updated

https://www.redhat.com/wapps/partnerlocator/web/home.html;#productId=188

, I was still curious to see what the buzz about Red Hat is all about.

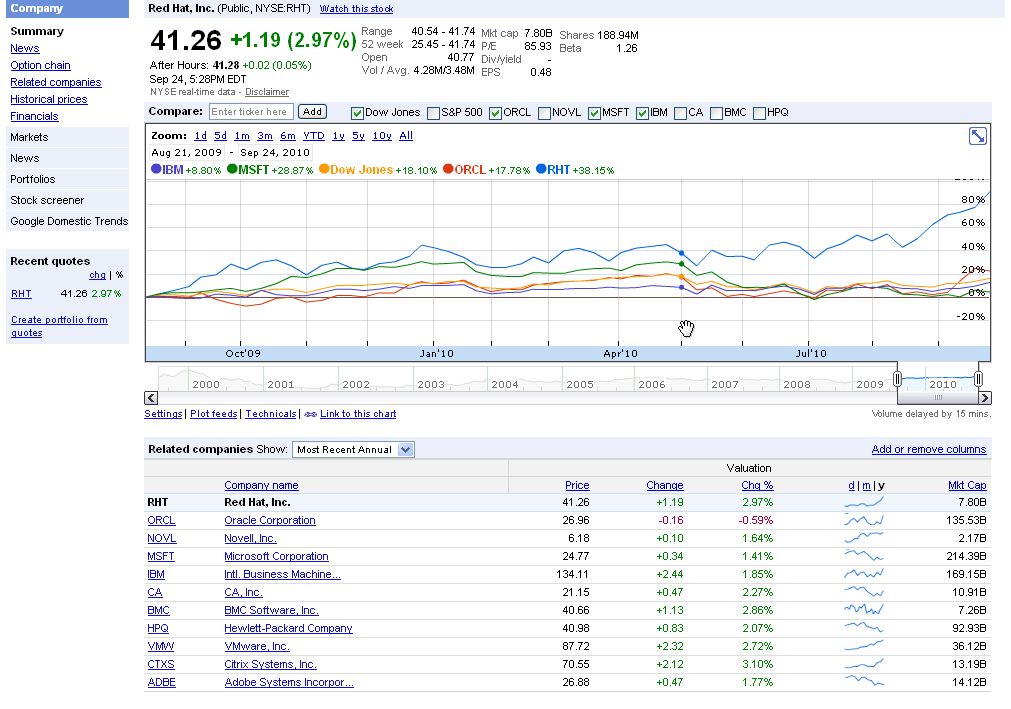
And one of the answers is Red Hat is now a 7.8 Billion Dollar Company.

http://www.redhat.com/about/news/prarchive/2010/Q2_2011.html

Red Hat Reports Second Quarter Results

  • Revenue of $220 million, up 20% from the prior year
  • GAAP operating income up 24%, non-GAAP operating income up 25% from the prior year
  • Deferred revenue of $650 million, up 12% from the prior year

RALEIGH, NC – Sept 22, 2010 – Red Hat, Inc. (NYSE: RHT), the world’s leading provider of open source solutions, today announced financial results for its fiscal year 2011 second quarter ended August 31, 2010.

Total revenue for the quarter was $219.8 million, an increase of 20% from the year ago quarter. Subscription revenue for the quarter was $186.2 million, up 19% year-over-year.

and the stock goes zoom 48 % up for the year

http://www.google.com/finance?chdnp=1&chdd=1&chds=1&chdv=1&chvs=maximized&chdeh=0&chfdeh=0&chdet=1285505944359&chddm=98141&chls=IntervalBasedLine&cmpto=INDEXDJX:.DJI;NASDAQ:ORCL;NASDAQ:MSFT;NYSE:IBM&cmptdms=0;0;0;0&q=NYSE:RHT&ntsp=0

(Note to Google- please put the URL shortener on Google Finance as well)

The software is also reasonably priced starting from 80$ onwards.

https://www.redhat.com/apps/store/desktop/

Basic Subscription

Web support, 2 business day response, unlimited incidents
1 Year
$80
Multi-OS with Basic SubscriptionWeb support, 2 business day response, unlimited incidents
1 Year
$120
Workstation with Basic Subscription
Web support, 2 business day response, unlimited incidents
1 Year
$179
Workstation and Multi-OS with Basic Subscription
Web support, 2 business day response, unlimited incidents
1 Year
$219
Workstation with Standard Subscription
Business Hours phone support, web support, unlimited incidents
1 Year
$299
Workstation and Multi-OS with Standard Subscription
Business Hours phone support, web support, unlimited incidents
1 Year
$339
——————————————————————————————
That should be a good enough case for open source as a business model.


Using Facebook Analytics (Updated)

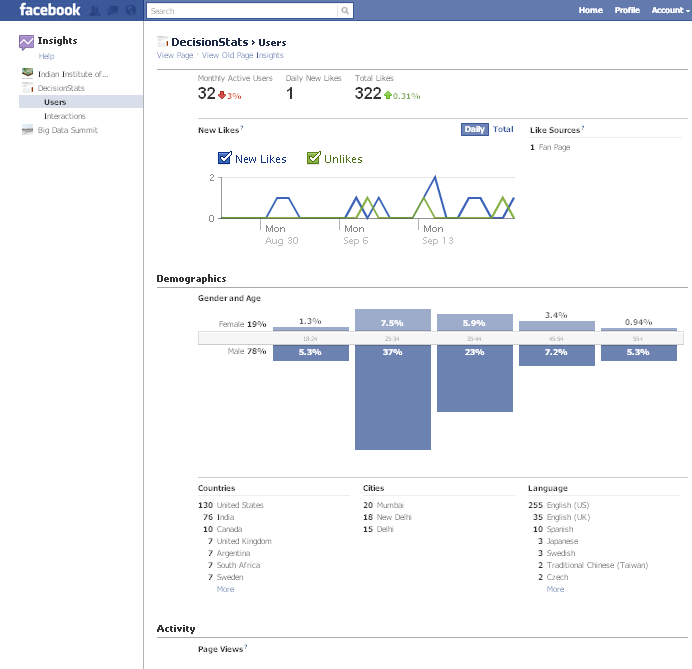
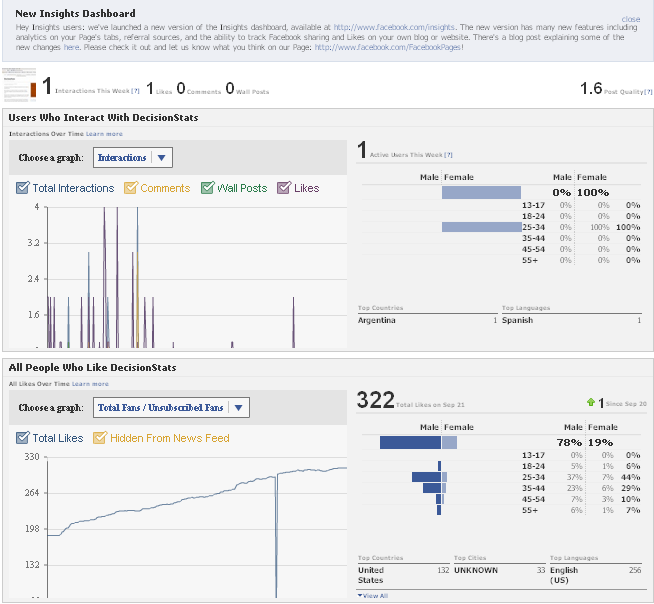
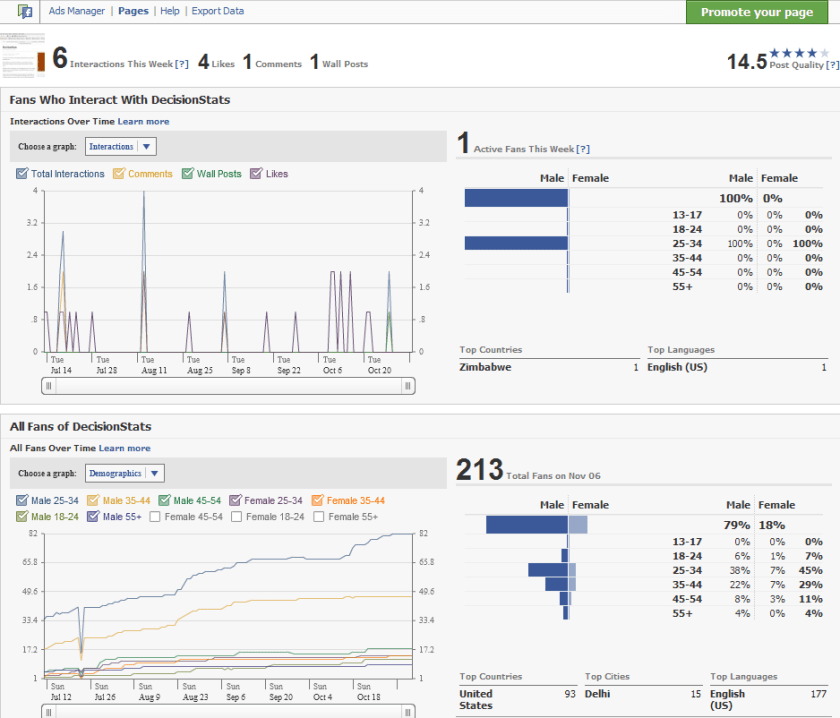
People sceptical of any analytical value of Facebook should see the nice embedded analytics, which is a close rival and even more to Google Analytics for websites. It has recently been updated as well.

It is right there on the button called Insights on left margin of your Facebook Page

Like for the Facebook Page

http://facebook.com/Decisionstats

You can also use Export Data function to run customized analytical and statistical testing on your Corporate Page.

Older View———————————————————————————-

see screenshot of Demographics of 213 Decisionstats fans on Facebook ( FB doesnot allow individual views but only aggregate views for Privacy Reasons)

fb

AsterData gets $30 mill in funding

From the press release, the maker of Map Reduce based BI software gets 30 mill $ as Series C funding. Given the valuation recently by IBM to Netezza, AsterData seems set to cross the Billion Dollar valuation within the next 18-24 months IMO

Aster Data Closes $30 Million Series C Financing

Explosive Growth and Market Leadership Attracts New and Existing Investors

San Carlos, CA – September 22, 2010 – Aster Data, a market leader in big data management and advanced analytics, today announced that it has closed a $30 million Series C round of financing led by both new and existing investors. The company will use the new funding to accelerate growth, scale operations, and expand its global market share in the $20 billion database market – a market that is experiencing rapid growth as a result of both the explosion in data volumes across organizations and the urgent need to deliver a new class of analytics and data-driven applications. The Series C round of funding includes previous investors Sequoia Capital, JAFCO Ventures, Institutional Venture Partners, Cambrian Ventures, as well as an additional new strategic investor.  Also investing in this round is early investor David Cheriton, who previously backed high-growth companies including Google and VMware, and co-founded several successful technology companies.

Today’s Series C funding announcement underscores a year of strong innovation, execution, and overall momentum for the analytic database company. Key milestones include:

Strong sales growth: Since 2008, Aster Data has doubled revenue year-over-year and secured key customers that leverage Aster Data’s platform to address the big data management problem including MySpace, comScore, Barnes & Noble, and Akamai. Like so many organizations today,
Aster Data’s customers are experiencing explosive data growth across their organizations and recognize the need for rich, advanced analytics that give them deeper insights from their data.

Key executive hires: Quentin Gallivan, former CEO of both PivotLink and Postini and EVP of worldwide sales at Verisign, recently joined the company as Chief Executive Officer. In addition, earlier this year, John Calonico, previously at Interwoven, BEA, and Autodesk, joined as Chief Financial Officer; and Nitin Donde, formerly an executive at EMC and 3PAR, joined as Executive Vice President Engineering.  The strength and experience of Aster Data’s management team helps further establish a strong operational foundation for growth in 2010 and beyond.

Industry recognition: Aster Data was positioned in the “Visionaries” Quadrant of Gartner, Inc.’s

Data Warehouse Database Management Systems Magic Quadrant, published 2010 *; was recently named 2011 Tech Pioneer by the World Economic Forum; was named “Company to Watch” in the Information Management category of TechWeb’s Intelligent Enterprise 2010 Editors’ Choice Awards; and was awarded the 2010 San Francisco Business Times Technology and Innovation Award in the Best Product and Services Category.

Product Innovation: Aster Data continues to deliver ground-breaking capabilities to address the big data management and advanced analytics market need. Its recent announcement of
Aster Data nCluster 4.6 includes a column data store, making it the first hybrid row and column MPP DBMS with a unified SQL and MapReduce analytic framework for advanced analytics on large data sets. This year, Aster Data also delivered the most extensive library of pre-packaged MapReduce analytics totaling over 1000 functions, to ease and accelerate delivery of highly advanced analytic applications.

Aster Data’s analytic database, also called a ‘Data-Analytics Server’ is specifically designed to enable organizations to cost effectively store and analyze massive volumes of data. Aster Data leverages the power of commodity, general-purpose hardware, to reduce the cost to scale to support large data volumes and uniquely allows analysis of all data ‘in-database’ enabling richer and faster processing of large data sets. Aster Data’s in-database analytics engine uses the power of MapReduce, a parallel processing framework created by Google.

”The funding we received in our Series C round is a strong endorsement of Aster Data’s market leadership position and the high growth potential of the big data market,” said Quentin Gallivan, Chief Executive Officer, Aster Data. “The Aster Data team has executed exceptionally well to-date and I am excited to have the resources to accelerate the growth of the company as we expand our operations and execute aggressively across all fronts.”

Windows Azure vs Amazon EC2 (and Google Storage)

Here is a comparison of Windows Azure instances vs Amazon compute instances

Compute Instance Sizes:

Developers have the ability to choose the size of VMs to run their application based on the applications resource requirements. Windows Azure compute instances come in four unique sizes to enable complex applications and workloads.

Compute Instance Size CPU Memory Instance Storage I/O Performance
Small 1.6 GHz 1.75 GB 225 GB Moderate
Medium 2 x 1.6 GHz 3.5 GB 490 GB High
Large 4 x 1.6 GHz 7 GB 1,000 GB High
Extra large 8 x 1.6 GHz 14 GB 2,040 GB High

Standard Rates:

Windows Azure

  • Compute
    • Small instance (default): $0.12 per hour
    • Medium instance: $0.24 per hour
    • Large instance: $0.48 per hour
    • Extra large instance: $0.96 per hour
  • Storage
    • $0.15 per GB stored per month
    • $0.01 per 10,000 storage transactions
  • Content Delivery Network (CDN)
    • $0.15 per GB for data transfers from European and North American locations*
    • $0.20 per GB for data transfers from other locations*
    • $0.01 per 10,000 transactions*

Source –

http://www.microsoft.com/windowsazure/offers/popup/popup.aspx?lang=en&locale=en-US&offer=MS-AZR-0001P

and

http://www.microsoft.com/windowsazure/windowsazure/

Amazon EC2 has more options though——————————-

http://aws.amazon.com/ec2/pricing/

Standard On-Demand Instances Linux/UNIX Usage Windows Usage
Small (Default) $0.085 per hour $0.12 per hour
Large $0.34 per hour $0.48 per hour
Extra Large $0.68 per hour $0.96 per hour
Micro On-Demand Instances Linux/UNIX Usage Windows Usage
Micro $0.02 per hour $0.03 per hour
High-Memory On-Demand Instances
Extra Large $0.50 per hour $0.62 per hour
Double Extra Large $1.00 per hour $1.24 per hour
Quadruple Extra Large $2.00 per hour $2.48 per hour
High-CPU On-Demand Instances
Medium $0.17 per hour $0.29 per hour
Extra Large $0.68 per hour $1.16 per hour
Cluster Compute Instances
Quadruple Extra Large $1.60 per hour N/A*
* Windows is not currently available for Cluster Compute Instances.

http://aws.amazon.com/ec2/instance-types/

Standard Instances

Instances of this family are well suited for most applications.

Small Instance – default*

1.7 GB memory
1 EC2 Compute Unit (1 virtual core with 1 EC2 Compute Unit)
160 GB instance storage (150 GB plus 10 GB root partition)
32-bit platform
I/O Performance: Moderate
API name: m1.small

Large Instance

7.5 GB memory
4 EC2 Compute Units (2 virtual cores with 2 EC2 Compute Units each)
850 GB instance storage (2×420 GB plus 10 GB root partition)
64-bit platform
I/O Performance: High
API name: m1.large

Extra Large Instance

15 GB memory
8 EC2 Compute Units (4 virtual cores with 2 EC2 Compute Units each)
1,690 GB instance storage (4×420 GB plus 10 GB root partition)
64-bit platform
I/O Performance: High
API name: m1.xlarge

Micro Instances

Instances of this family provide a small amount of consistent CPU resources and allow you to burst CPUcapacity when additional cycles are available. They are well suited for lower throughput applications and web sites that consume significant compute cycles periodically.

Micro Instance

613 MB memory
Up to 2 EC2 Compute Units (for short periodic bursts)
EBS storage only
32-bit or 64-bit platform
I/O Performance: Low
API name: t1.micro

High-Memory Instances

Instances of this family offer large memory sizes for high throughput applications, including database and memory caching applications.

High-Memory Extra Large Instance

17.1 GB of memory
6.5 EC2 Compute Units (2 virtual cores with 3.25 EC2 Compute Units each)
420 GB of instance storage
64-bit platform
I/O Performance: Moderate
API name: m2.xlarge

High-Memory Double Extra Large Instance

34.2 GB of memory
13 EC2 Compute Units (4 virtual cores with 3.25 EC2 Compute Units each)
850 GB of instance storage
64-bit platform
I/O Performance: High
API name: m2.2xlarge

High-Memory Quadruple Extra Large Instance

68.4 GB of memory
26 EC2 Compute Units (8 virtual cores with 3.25 EC2 Compute Units each)
1690 GB of instance storage
64-bit platform
I/O Performance: High
API name: m2.4xlarge

High-CPU Instances

Instances of this family have proportionally more CPU resources than memory (RAM) and are well suited for compute-intensive applications.

High-CPU Medium Instance

1.7 GB of memory
5 EC2 Compute Units (2 virtual cores with 2.5 EC2 Compute Units each)
350 GB of instance storage
32-bit platform
I/O Performance: Moderate
API name: c1.medium

High-CPU Extra Large Instance

7 GB of memory
20 EC2 Compute Units (8 virtual cores with 2.5 EC2 Compute Units each)
1690 GB of instance storage
64-bit platform
I/O Performance: High
API name: c1.xlarge

Cluster Compute Instances

Instances of this family provide proportionally high CPU resources with increased network performance and are well suited for High Performance Compute (HPC) applications and other demanding network-bound applications. Learn more about use of this instance type for HPC applications.

Cluster Compute Quadruple Extra Large Instance

23 GB of memory
33.5 EC2 Compute Units (2 x Intel Xeon X5570, quad-core “Nehalem” architecture)
1690 GB of instance storage
64-bit platform
I/O Performance: Very High (10 Gigabit Ethernet)
API name: cc1.4xlarge

Also http://www.microsoft.com/en-us/sqlazure/default.aspx

offers SQL Databases as a service with a free trial offer

If you are into .Net /SQL big time or too dependent on MS, Azure is a nice option to EC2 http://www.microsoft.com/windowsazure/offers/popup/popup.aspx?lang=en&locale=en-US&offer=COMPARE_PUBLIC

Updated- I just got approved for Google Storage so am adding their info- though they are in Preview (and its free right now) 🙂

https://code.google.com/apis/storage/docs/overview.html

Functionality

Google Storage for Developers offers a rich set of features and capabilities:

Basic Operations

  • Store and access data from anywhere on the Internet.
  • Range-gets for large objects.
  • Manage metadata.

Security and Sharing

  • User authentication using secret keys or Google account.
  • Authenticated downloads from a web browser for Google account holders.
  • Secure access using SSL.
  • Easy, powerful sharing and collaboration via ACLs for individuals and groups.

Performance and scalability

  • Up to 100 gigabytes per object and 1,000 buckets per account during the preview.
  • Strong data consistency—read-after-write consistency for all upload and delete operations.
  • Namespace for your domain—only you can create bucket URIs containing your domain name.
  • Data replicated in multiple data centers across the U.S. and within the same data center.

Tools

  • Web-based storage manager.
  • GSUtil, an open source command line tool.
  • Compatible with many existing cloud storage tools and libraries.

Read the Getting Started Guide to learn more about the service.

Note: Google Storage for Developers does not support Google Apps accounts that use your company domain name at this time.

Back to top

Pricing

Google Storage for Developers pricing is based on usage.

  • Storage—$0.17/gigabyte/month
  • Network
    • Upload data to Google
      • $0.10/gigabyte
    • Download data from Google
      • $0.15/gigabyte for Americas and EMEA
      • $0.30/gigabyte for Asia-Pacific
  • Requests
    • PUT, POST, LIST—$0.01 per 1,000 requests
    • GET, HEAD—$0.01 per 10,000 requests

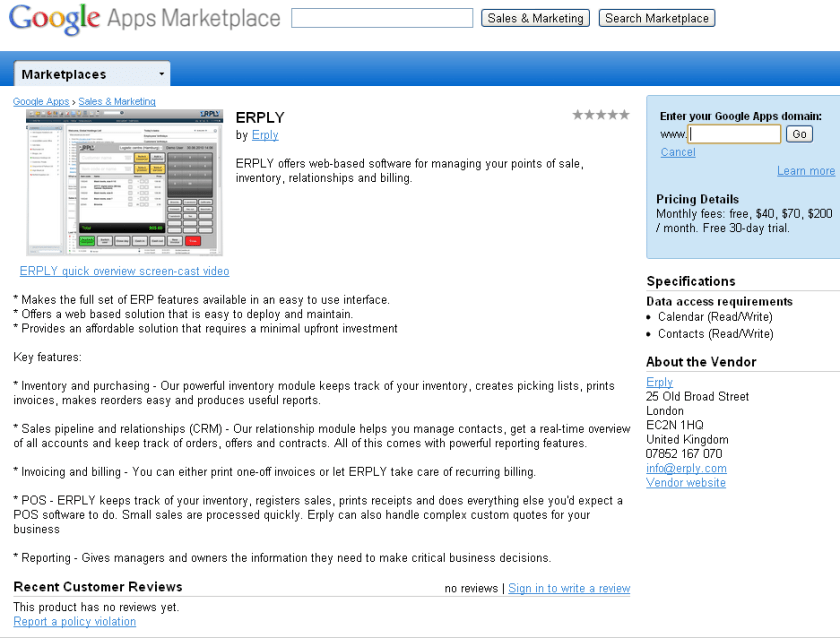
A Google App for Sales- ERPLY

While not quite Salesforce.com, a promising start for the first ERP Google App at https://www.google.com/enterprise/marketplace/viewListing?productListingId=5759+8485502070963042532

An interesting development-maybe there could be some statistical or BI apps on Google App Marketplace soon 😉

September Roundup by Revolution

From the monthly newsletter- which I consider quite useful for keeping updated on application of R

——————————————————————————————————————————————————————————————————–

Revolution News
Every month, we’ll bring you the latest news about Revolution’s products and events in this section.
Follow us on Twitter at @RevolutionR for up-to-the-minute news and updates from Revolution Analytics!

Revolution R Enterprise 4.0 for Windows now available. Based on the latest R 2.11.1 and including the RevoScaleR package for big-data analysis in R, Revolution R Enterprise is now available for download for Windows 32-bit and 64-bit systems. Click here to subscribe, or available free to academia.

New! Integrate R with web applications, BI dashboards and more with web services. RevoDeployR is a new Web Services framework that integrates dynamic R-based computations into applications for business users. It will be available September 30 with Revolution R Enterprise Server on RHEL 5. Click here to learn more.

Free Webinar, September 22: In a joint webinar from Revolution Analytics and Jaspersoft, learn how to use RevoDeployR to integrate advanced analytics on-demand in applications, BI dashboards, and on the web. Register here.

Revolution in the News:
SearchBusinessAnalytics.com previews the forthcoming Revolution R GUI; Channel Register introduces RevoDeployR, while IT Business Edge shows off the Web Services architecture; and ReadWriteWeb.com looks at how RevoScaleR tackles the Big Data explosion.

Inside-R: A new site for the R Community. At www.inside-R.org you’ll find the latest information about R from around the Web, searchable R documentation and packages, hints and tips about R, and more. You can even add a “Download R” badge to your own web-page to help spread the word about R.

R News, Tips and Tricks from the Revolutions blog
The Revolutions blog brings you daily news and tips about R, statistics and open source. Here are some highlights from Revolutions from the past month
.

R’s key role in the oil spill response: Read how NIST’s Division Chief of Statistical Engineering used R to provide critical analysis in real time to the Secretaries of Energy and the Interior, and helped coordinate the government’s response.

Animating data with R and Google Earth: Learn how to use R to create animated visualizations of geographical data with Google Earth, such as this video showing how tuna migrations intersect with the location of the Gulf oil spill.

Are baseball games getting longer? Or is it just Red Sox games? Ryan Elmore uses nonparametric regression in R to find out.

Keynote presentations from useR! 2010: the worldwide R user’s conference was a great success, and there’s a wealth of useful tips and information in the presentations. Video of the keynote presentations are available too: check out in particular Frank Harrell’s talk Information Allergy, and Friedrich Leisch’s talk on reproducible statistical research.

Looking for more R tips and tricks? Check out the monthly round-ups at the Revolutions blog.

Upcoming Events
Every month, we’ll highlight some upcoming events from R Community Calendar.

September 23: The San Diego R User Group has a meetup on BioConductor and microarray data analysis.

September 28: The Sydney Users of R Forum has a meetup on building world-class predictive models in R (with dinner to follow).

September 28: The Los Angeles R User Group presents an introduction to statistical finance with R.

September 28: The Seattle R User Group meets to discuss, “What are you doing with R?”

September 29: The Raleigh-Durham-Chapel Hill R Users Group has its first meeting.

October 7: The NYC R User Group features a presentation by Prof. Andrew Gelman.

There are also new R user groups in SingaporeSeoulDenverBrisbane, and New Jersey.  Please let us know if we’re missing your R user group, or if want to get a new one started.

———————————————————————————————-Editor

David Smith, VP Marketing
david@revolutionanalytics.com
Twitter: @revodavid

subscribe here for Revo’s Monthly newsletter-