Interview Anne Milley JMP

Here is an interview with Anne Milley, a notable thought leader in the world of analytics. Anne is now Senior Director, Analytical Strategy in Product Marketing for JMP , the leading data visualization software from the SAS Institute.

Ajay-What do you think are the top 5 unique selling points of JMP compared to other statistical software in its category?

Anne-

JMP combines incredible analytic depth and breadth with interactive data visualization, creating a unique environment optimized for discovery and data-driven innovation.

With an extensible framework using JSL (JMP Scripting Language), and integration with SAS, R, and Excel, JMP becomes your analytic hub.

JMP is accessible to all kinds of users. A novice analyst can dig into an interactive report delivered by a custom JMP application. An engineer looking at his own data can use built-in JMP capabilities to discover patterns, and a developer can write code to extend JMP for herself or others.

State-of-the-art DOE capabilities make it easy for anyone to design and analyze efficient experiments to determine which adjustments will yield the greatest gains in quality or process improvement – before costly changes are made.

Not to mention, JMP products are exceptionally well designed and easy to use. See for yourself and check out the free trial at www.jmp.com.

Download a free 30-day trial of JMP.

Ajay- What are the challenges and opportunities of expanding JMP’s market share? Do you see JMP expanding its conferences globally to engage global audiences?

Anne-

We realized solid global growth in 2010. The release of JMP Pro and JMP Clinical last year along with continuing enhancements to the rest of the JMP family of products (JMP and JMP Genomics) should position us well for another good year.

With the growing interest in analytics as a means to sustained value creation, we have the opportunity to help people along their analytic journey – to get started, take the next step, or adopt new paradigms speeding their time to value. The challenge is doing that as fast as we would like.

We are hiring internationally to offer even more events, training and academic programs globally.

Ajay- What are the current and proposed educational and global academic initiatives of JMP? How can we see more JMP in universities across the world (say India- China etc)?

Anne-

We view colleges and universities both as critical incubators of future JMP users and as places where attitudes about data analysis and statistics are formed. We believe that a positive experience in learning statistics makes a person more likely to eventually want and need a product like JMP.

For most students – and particularly for those in applied disciplines of business, engineering and the sciences – the ability to make a statistics course relevant to their primary area of study fosters a positive experience. Fortunately, there is a trend in statistical education toward a more applied, data-driven approach, and JMP provides a very natural environment for both students and researchers.

Its user-friendly navigation, emphasis on data visualization and easy access to the analytics behind the graphics make JMP a compelling alternative to some of our more traditional competitors.

We’ve seen strong growth in the education markets in the last few years, and JMP is now used in nearly half of the top 200 universities in the US.

Internationally, we are at an earlier stage of market development, but we are currently working with both JMP and SAS country offices and their local academic programs to promote JMP. For example, we are working with members of the JMP China office and faculty at several universities in China to support the use of JMP in the development of a master’s curriculum in Applied Statistics there, touched on in this AMSTAT News article.

Ajay- What future trends do you see for 2011 in this market (say top 5)?

Anne-

Growing complexity of data (text, image, audio…) drives the need for more and better visualization and analysis capabilities to make sense of it all.

More “chief analytics officers” are making better use of analytic talent – people are the most important ingredient for success!

JMP has been on the vanguard of 64-bit development, and users are now catching up with us as 64-bit machines become more common.

Users should demand easy-to-use, exploratory and predictive modeling tools as well as robust tools to experiment and learn to help them make the best decisions on an ongoing basis.

All these factors and more fuel the need for the integration of flexible, extensible tools with popular analytic platforms.

Ajay-You enjoy organic gardening as a hobby. How do you think hobbies and unwind time help people be better professionals?

Anne-

I am lucky to work with so many people who view their work as a hobby. They have other interests too, though, some of which are work-related (statistics is relevant everywhere!). Organic gardening helps me put things in perspective and be present in the moment. More than work defines who you are. You can be passionate about your work as well as passionate about other things. I think it’s important to spend some leisure time in ways that bring you joy and contribute to your overall wellbeing and outlook.

Btw, nice interviews over the past several months—I hadn’t kept up, but will check it out more often!

Biography–  Source- http://www.sas.com/knowledge-exchange/business-analytics/biographies.html

  • Anne Milley

    Anne Milley

    Anne Milley is Senior Director of Analytics Strategy at JMP Product Marketing at SAS. Her ties to SAS began with bank failure prediction at Federal Home Loan Bank Dallas and continued at 7-Eleven Inc. She has authored papers and served on committees for F2006, KDD, SIAM, A2010 and several years of SAS’ annual data mining conference. Milley is a contributing faculty member for the International Institute of Analytics. anne.milley@jmp.com

WPS Version 2.5.1 Released – can still run SAS language/data and R

However this is what Phil Rack the reseller is quoting on http://www.minequest.com/Pricing.html

Windows Desktop Price: $884 on 32-bit Windows and $1,149 on 64-bit Windows.

The Bridge to R is available on the Windows platforms and is available for free to customers who
license WPS through MineQuest,LLC. Companies and organizations outside of North America
may purchase a license for the Bridge to R which starts at $199 per desktop or $599 per server

Windows Server Price: $1,903 per logical CPU for 32-bit and $2,474 for 64-bit.

Note that Linux server versions are available but do not yet support the Eclipse IDE and are
command line only

WPS sure seems going well-but their pricing is no longer fixed and on the home website, you gotta fill a form. Ditt0 for the 30 day free evaluation

http://www.teamwpc.co.uk/products/wps/modules/core

Data File Formats

The table below provides a summary of data formats presently supported by the WPS Core module.

Data File Format Un-Compressed
Data
Compressed
Data
Read Write Read Write
SD2 (SAS version 6 data set)
SAS7BDAT (SAS version 7 data set)
SAS7BDAT (SAS version 8 data set)
SAS7BDAT (SAS version 9 data set)
SASSEQ (SAS version 8/9 sequential file)
V8SEQ (SAS version 8 sequential file)
V9SEQ (SAS version 9 sequential file)
WPD (WPS native data set)
WPDSEQ (WPS native sequential file)
XPORT (transport format)

Additional access to EXCEL, SPSS and dBASE files is supported by utilising the WPS Engine for DB Filesmodule.

and they have a new product release on Valentine Day 2011 (oh these Europeans!)

From the press release at http://www.teamwpc.co.uk/press/wps2_5_1_released

WPS Version 2.5.1 Released 

New language support, new data engines, larger datasets, improved scalability

LONDON, UK – 14 February 2011 – World Programming today released version 2.5.1 of their WPS software for workstations, servers and mainframes.

WPS is a competitively priced, high performance, highly scalable data processing and analytics software product that allows users to execute programs written in the language of SAS. WPS is supported on a wide variety of hardware and operating system platforms and can connect to and work with many types of data with ease. The WPS user interface (Workbench) is frequently praised for its ease of use and flexibility, with the option to include numerous third-party extensions.

This latest version of the software has the ability to manipulate even greater volumes of data, removing the previous 2^31 (2 billion) limit on number of observations.

Complimenting extended data processing capabilities, World Programming has worked hard to boost the performance, scalability and reliability of the WPS software to give users the confidence they need to run heavy workloads whilst delivering maximum value from available computer power.

WPS version 2.5.1 offers additional flexibility with the release of two new data engines for accessing Greenplum and SAND databases. WPS now comes with eleven data engines and can access a huge range of commonly used and industry-standard file-formats and databases.

Support in WPS for the language of SAS continues to expand with more statistical procedures, data step functions, graphing controls and many other language items and options.

WPS version 2.5.1 is available as a free upgrade to all licensed users of WPS.

Summary of Main New Features:

  • Supporting Even Larger Datasets
    WPS is now able to process very large data sets by lifting completely the previous size limit of 2^31 observations.
  • Performance and Scalability Boosted
    Performance and scalability improvements across the board combine to ensure even the most demanding large and concurrent workloads are processed efficiently and reliably.
  • More Language Support
    WPS 2.5.1 continues the expansion of it’s language support with over 70 new language items, including new Procedures, Data Step functions and many other language items and options.
  • Statistical Analysis
    The procedure support in WPS Statistics has been expanded to include PROC CLUSTER and PROC TREE.
  • Graphical Output
    The graphical output from WPS Graphing has been expanded to accommodate more configurable graphics.
  • Hash Tables
    Support is now provided for hash tables.
  • Greenplum®
    A new WPS Engine for Greenplum provides dedicated support for accessing the Greenplum database.
  • SAND®
    A new WPS Engine for SAND provides dedicated support for accessing the SAND database.
  • Oracle®
    Bulk loading support now available in the WPS Engine for Oracle.
  • SQL Server®
    To enhance existing SQL Server database access, a new SQLSERVR (please note spelling) facility in the ODBC engine.

More Information:

Existing Users should visit www.teamwpc.co.uk/support/wps/release where you can download a readme file containing more information about all the new features and fixes in WPS 2.5.1.

New Users should visit www.teamwpc.co.uk/products/wps where you can explore in more detail all the features available in WPS or request a free evaluation.

and from http://www.teamwpc.co.uk/products/wps/data it seems they are going on the BIG DATA submarine as well-

Data Support 

Extremely Large Data Size Handling

WPS is now able to handle extremely large data sets now that the previous limit of 2^31 observations has been lifted.

Access Standard Databases

Use I/O Features in WPS Core

  • CLIPBOARD (Windows only)
  • DDE (Windows only)
  • EMAIL (via SMTP or MAPI)
  • FTP
  • HTTP
  • PIPE (Windows and UNIX only)
  • SOCKET
  • STDIO
  • URL

Use Standard Data File Formats

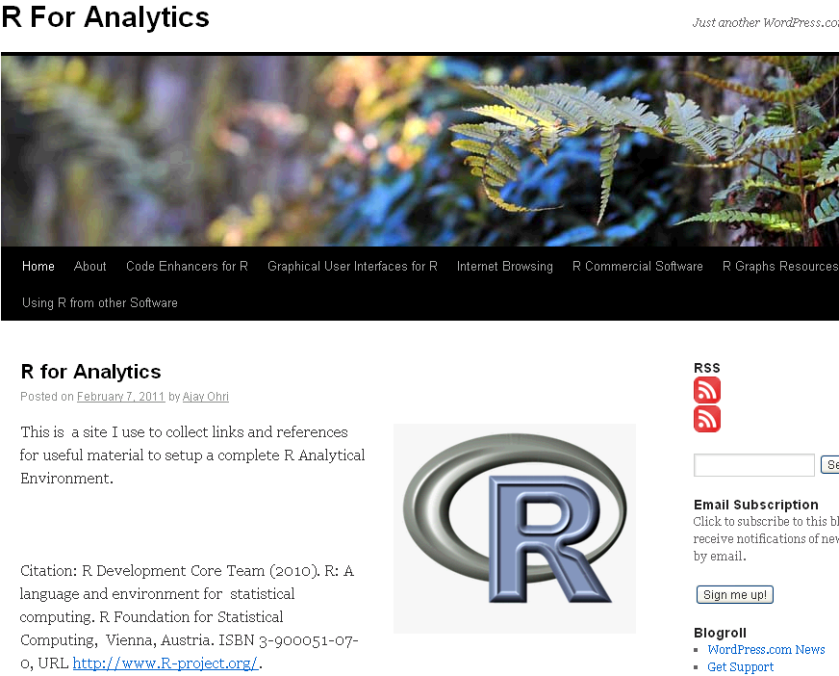
R for Analytics is now live

Okay, through the weekend I created a website for a few of my favourite things.

It’s on at https://rforanalytics.wordpress.com/

Graphical User Interfaces for R


Jerry Rubin said: “Don’t trust anyone over thirty

I dont trust anyone not using atleast one R GUI. Here’s a list of the top 10.


Code Enhancers for R

Here is a list of top 5 code enhancers,editors in R

R Commercial Software

A list of companies and software making (and) selling R software (and) services. Hint- it is almost 5 (unless I missed someone)

R Graphs Resources

R’s famous graphing capabilities and equally famous learning curve can be made a bit more humane- using some of these resources.

Internet Browsing

Because that’s what I do (all I do as per my cat) , and I am pretty good at it.

Using R from other Software

R can be used successfully from a lot of analytical software including some surprising ones praising the great 3000 packages library.

(to be continued- as I find more stuff I will keep it there, some ideas- database access from R, prominent R consultants, prominent R packages, famous R interviewees 😉 )

ps- The quote from Jerry Rubin seems funny for a while. I turn 34 this year.

Interview David Katz ,Dataspora /David Katz Consulting

Here is an interview with David Katz ,founder of David Katz Consulting (http://www.davidkatzconsulting.com/) and an analyst at the noted firm http://dataspora.com/. He is a featured speaker at Predictive Analytics World  http://www.predictiveanalyticsworld.com/sanfrancisco/2011/speakers.php#katz)

Ajay-  Describe your background working with analytics . How can we make analytics and science more attractive career options for young students

David- I had an interest in math from an early age, spurred by reading lots of science fiction with mathematicians and scientists in leading roles. I was fortunate to be at Harry and David (Fruit of the Month Club) when they were in the forefront of applying multivariate statistics to the challenge of targeting catalogs and other snail-mail offerings. Later I had the opportunity to expand these techniques to the retail sphere with Williams-Sonoma, who grew their retail business with the support of their catalog mailings. Since they had several catalog titles and product lines, cross-selling presented additional analytic challenges, and with the growth of the internet there was still another channel to consider, with its own dynamics.

After helping to found Abacus Direct Marketing, I became an independent consultant, which provided a lot of variety in applying statistics and data mining in a variety of settings from health care to telecom to credit marketing and education.

Students should be exposed to the many roles that analytics plays in modern life, and to the excitement of finding meaningful and useful patterns in the vast profusion of data that is now available.

Ajay-  Describe your most challenging project in 3 decades of experience in this field.

David- Hard to choose just one, but the educational field has been particularly interesting. Partnering with Olympic Behavior Labs, we’ve developed systems to help identify students who are most at-risk for dropping out of school to help target interventions that could prevent dropout and promote success.

Ajay- What do you think are the top 5 trends in analytics for 2011.

David- Big Data, Privacy concerns, quick response to consumer needs, integration of testing and analysis into business processes, social networking data.

Ajay- Do you think techniques like RFM and LTV are adequately utilized by organization. How can they be propagated further.

David- Organizations vary amazingly in how sophisticated or unsophisticated the are in analytics. A key factor in success as a consultant is to understand where each client is on this continuum and how well that serves their needs.

Ajay- What are the various software you have worked for in this field- and name your favorite per category.

David- I started out using COBOL (that dates me!) then concentrated on SAS for many years. More recently R is my favorite because of its coverage, currency and programming model, and it’s debugging capabilities.

Ajay- Independent consulting can be a strenuous job. What do you do to unwind?

David- Cycling, yoga, meditation, hiking and guitar.

Biography-

David Katz, Senior Analyst, Dataspora, and President, David Katz Consulting.

David Katz has been in the forefront of applying statistical models and database technology to marketing problems since 1980. He holds a Master’s Degree in Mathematics from the University of California, Berkeley. He is one of the founders of Abacus Direct Marketing and was previously the Director of Database Development for Williams-Sonoma.

He is the founder and President of David Katz Consulting, specializing in sophisticated statistical services for a variety of applications, with a special focus on the Direct Marketing Industry. David Katz has an extensive background that includes experience in all aspects of direct marketing from data mining, to strategy, to test design and implementation. In addition, he consults on a variety of data mining and statistical applications from public health to collections analysis. He has partnered with consulting firms such as Ernst and Young, Prediction Impact, and most recently on this project with Dataspora.

For more on David’s Session in Predictive Analytics World, San Fransisco on (http://www.predictiveanalyticsworld.com/sanfrancisco/2011/agenda.php#day2-16a)

Room: Salon 5 & 6
4:45pm – 5:05pm

Track 2: Social Data and Telecom 
Case Study: Major North American Telecom
Social Networking Data for Churn Analysis

A North American Telecom found that it had a window into social contacts – who has been calling whom on its network. This data proved to be predictive of churn. Using SQL, and GAM in R, we explored how to use this data to improve the identification of likely churners. We will present many dimensions of the lessons learned on this engagement.

Speaker: David Katz, Senior Analyst, Dataspora, and President, David Katz Consulting

Exhibit Hours
Monday, March 14th:10:00am to 7:30pm

Tuesday, March 15th:9:45am to 4:30pm

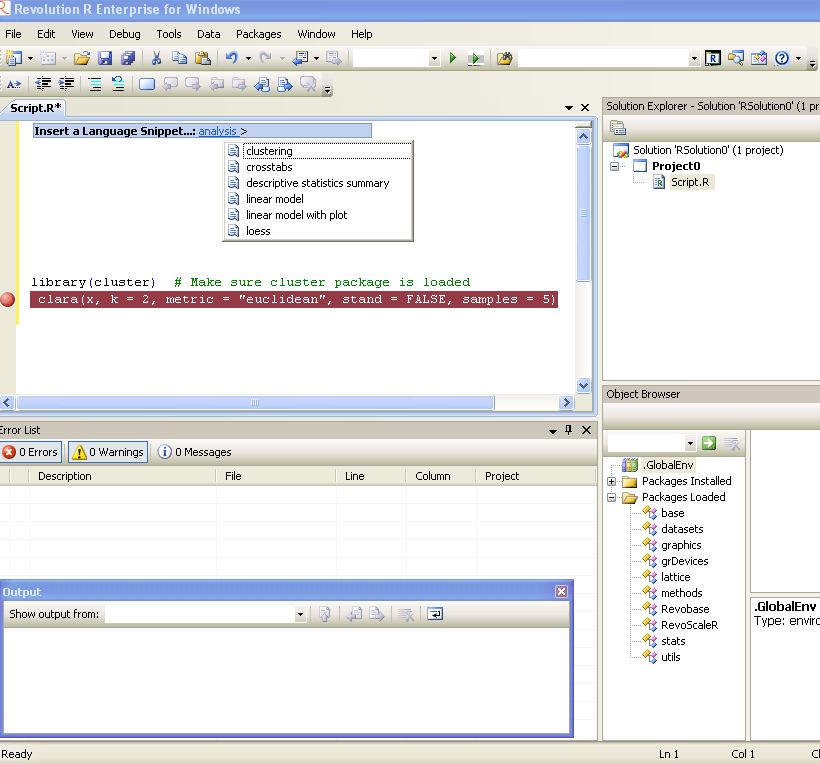
Revolution R Enterprise 4.2

Revo R gets more and more yum yum-

he following new features:

  • Direct import of SAS data sets into the native, efficient XDF file format
  • Direct import of fixed-format text data files into XDF file format
  • New commands to read subsets of rows and variables from XDF files in memory;
  • Many enhancements to the R Productivity Environment (RPE) for Windows
  • Expanded and updated user documentation
  • Added support on Linux for the big-data statistics package RevoScaleR
  • Added support on Windows for Web Services integration of predictive analytics with RevoDeployR.

Revolution R Enterprise 4.2 is available immediately for 64-bit Red Hat Enterprise Linux systems and both 32-bit and 64-bit Windows systems. Pricing starts at $1,000 per single-user workstation

And its free for academic licenses- so come on guys it is worth  atleast one download, and test.

http://www.revolutionanalytics.com/downloads/free-academic.php


SAS Knowledge Exchange

Visual analytics : research and practice
Image via Wikipedia

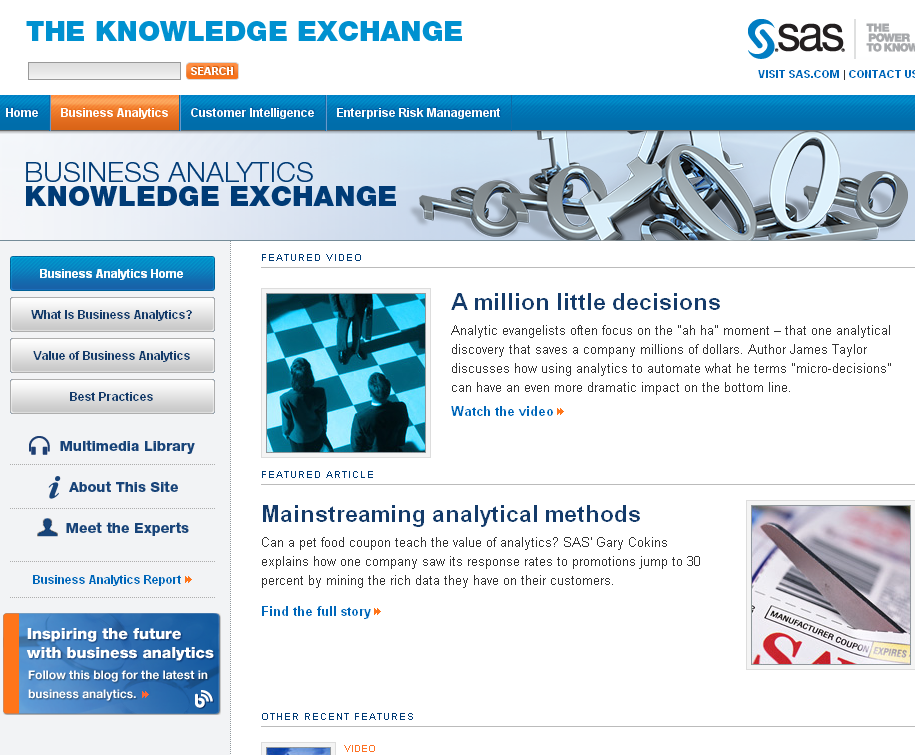
Here is an interesting website by SAS.com – it showcases lots of business analytics content more from a conceptual rather than a tool based perspective- have a glance yourself.

http://www.sas.com/knowledge-exchange/business-analytics/

Copyright © SAS Institute Inc. All rights reserved

SAS to R Challenge: Unique benchmarking

Flag of Town of Cary
Image via Wikipedia

An interesting announcemnet from Revolution Analytics promises to convert your legacy code in SAS language not only cheaper but faster. It’ s a very very interesting challenge and I wonder how SAS users ,corporates, customers as well as the Institute itself reacts

http://www.revolutionanalytics.com/sas-challenge/

Take the SAS to R Challenge

Are you paying for expensive software licenses and hardware to run time-consuming statistical analyses on big data sets?

If you’re doing linear regressions, logistic regressions, predictions, or multivariate crosstabulations* there’s something you should know: Revolution Analytics can get the same results for a substantially lower cost and faster than SAS®.

For a limited time only, Revolution Analytics invites you take the SAS to R Challenge. Let us prove that we can deliver on our promise of replicating your results in R, faster and cheaper than SAS.

Take the challenge

Here’s how it works:

Fill out the short form below, and one of our conversion experts will contact you to discuss the SAS code you want to convert. If we think Revolution R Enterprise can get the same results faster than SAS, we’ll convert your code to R free of charge. Our goal is to demonstrate that Revolution R Enterprise will produce the same results in less time. There’s no obligation, but if you choose to convert, we guarantee that your license cost for Revolution R Enterprise will be less than half what you’re currently paying for the equivalent SAS software.**

It’s that simple.

We’ll show you that you don’t need expensive hardware and software to do high quality statistical analysis of big data. And we’ll show that you don’t need to tie up your computing resources with long running operations. With Revolution R Enterprise, you can run analyses on commodity hardware using Linux or Windows, scale to terabyte-class data problems and do it at processing speeds you would never have thought possible.

Sign up now, and we will be in touch shortly.

Take the challenge


—————————-

SAS is a registered trademark of the SAS Institute, Cary, NC, in the US and other countries.

*Additional statistical algorithms are being rapidly added to Revolution R Enterprise. Custom development services are also available.

**Revolution Analytics retains the right to determine eligibility for this offer. Offer available until March 31, 2011.