The term quantitative refers to a type of information based in quantities or else quantifiable data (objective properties) —as opposed to qualitative information which deals with apparent qualities (subjective properties)
Fear, uncertainty, and doubt (FUD) is a tactic of rhetoric and fallacy used in sales, marketing, public relations,[1][2]politics and propaganda. FUD is generally a strategic attempt to influence public perception by disseminating negative and dubious/false information designed to undermine the credibility of their beliefs.
I had recently asked some friends from my Twitter lists for their take on 2011, atleast 3 of them responded back with the answer, 1 said they were still on it, and 1 claimed a recent office event.
Anyways- I take note of the view of forecasting from
The most primitive method of forecasting is guessing. The result may be rated acceptable if the person making the guess is an expert in the matter.
Ajay- people will forecast in end 2010 and 2011. many of them will get forecasts wrong, some very wrong, but by Dec 2011 most of them would be writing forecasts on 2012. almost no one will get called on by irate users-readers- (hey you got 4 out of 7 wrong last years forecast!) just wont happen. people thrive on hope. so does marketing. in 2011- and before
and some forecasts from Tom Davenport’s The International Institute for Analytics (IIA) at
Regulatory and privacy constraints will continue to hamper growth of marketing analytics.
(I wonder how privacy and analytics can co exist in peace forever- one view is that model building can use anonymized data suppose your IP address was anonymized using a standard secret Coco-Cola formula- then whatever model does get built would not be of concern to you individually as your privacy is protected by the anonymization formula)
Anyway- back to the question I asked-
What are the top 5 events in your industry (events as in things that occured not conferences) and what are the top 3 trends in 2011.
I define my industry as being online technology writing- research (with a heavy skew on stat computing)
My top 5 events for 2010 were-
1) Consolidation- Big 5 software providers in BI and Analytics bought more, sued more, and consolidated more. The valuations rose. and rose. leading to even more smaller players entering. Thus consolidation proved an oxy moron as total number of influential AND disruptive players grew.
2) Cloudy Computing- Computing shifted from the desktop but to the mobile and more to the tablet than to the cloud. Ipad front end with Amazon Ec2 backend- yup it happened.
3) Open Source grew louder- yes it got more clients. and more revenue. did it get more market share. depends on if you define market share by revenues or by users.
Both Open Source and Closed Source had a good year- the pie grew faster and bigger so no one minded as long their slices grew bigger.
4) We didnt see that coming –
Technology continued to surprise with events (thats what we love! the surprises)
Revolution Analytics broke through R’s Big Data Barrier, Tableau Software created a big Buzz, Wikileaks and Chinese FireWalls gave technology an entire new dimension (though not universally popular one).
people fought wars on emails and servers and social media- unfortunately the ones fighting real wars in 2009 continued to fight them in 2010 too
5) Money-
SAP,SAS,IBM,Oracle,Google,Microsoft made more money than ever before. Only Facebook got a movie named on itself. Venture Capitalists pumped in money in promising startups- really as if in a hurry to park money before tax cuts expired in some countries.
2011 Top Three Forecasts
1) Surprises- Expect to get surprised atleast 10 % of the time in business events. As internet grows the communication cycle shortens, the hype cycle amplifies buzz-
more unstructured data is created (esp for marketing analytics) leading to enhanced volatility
2) Growth- Yes we predict technology will grow faster than the automobile industry. Game changers may happen in the form of Chrome OS- really its Linux guys-and customer adaptability to new USER INTERFACES. Design will matter much more in technology on your phone, on your desktop and on your internet. Packaging sells.
False Top Trend 3) I will write a book on business analytics in 2011. yes it is true and I am working with A publisher. No it is not really going to be a top 3 event for anyone except me,publisher and lucky guys who read it.
3) Creating technology and technically enabling creativity will converge at an accelerated rate. use of widgets, guis, snippets, ide will ensure creative left brains can code easier. and right brains can design faster and better due to a global supply chain of techie and artsy professionals.
Tal G, creator of the rbloggers.com website, has created a new blog aggregator for SAS language users at http://sas-x.com/
With almost 26 blogs joining there (I suspect many more should join , it seems like a good website to use for analytics users and students. My favorite SAS Blog is http://statcompute.spaces.live.com/ – its pure code- little anything else.
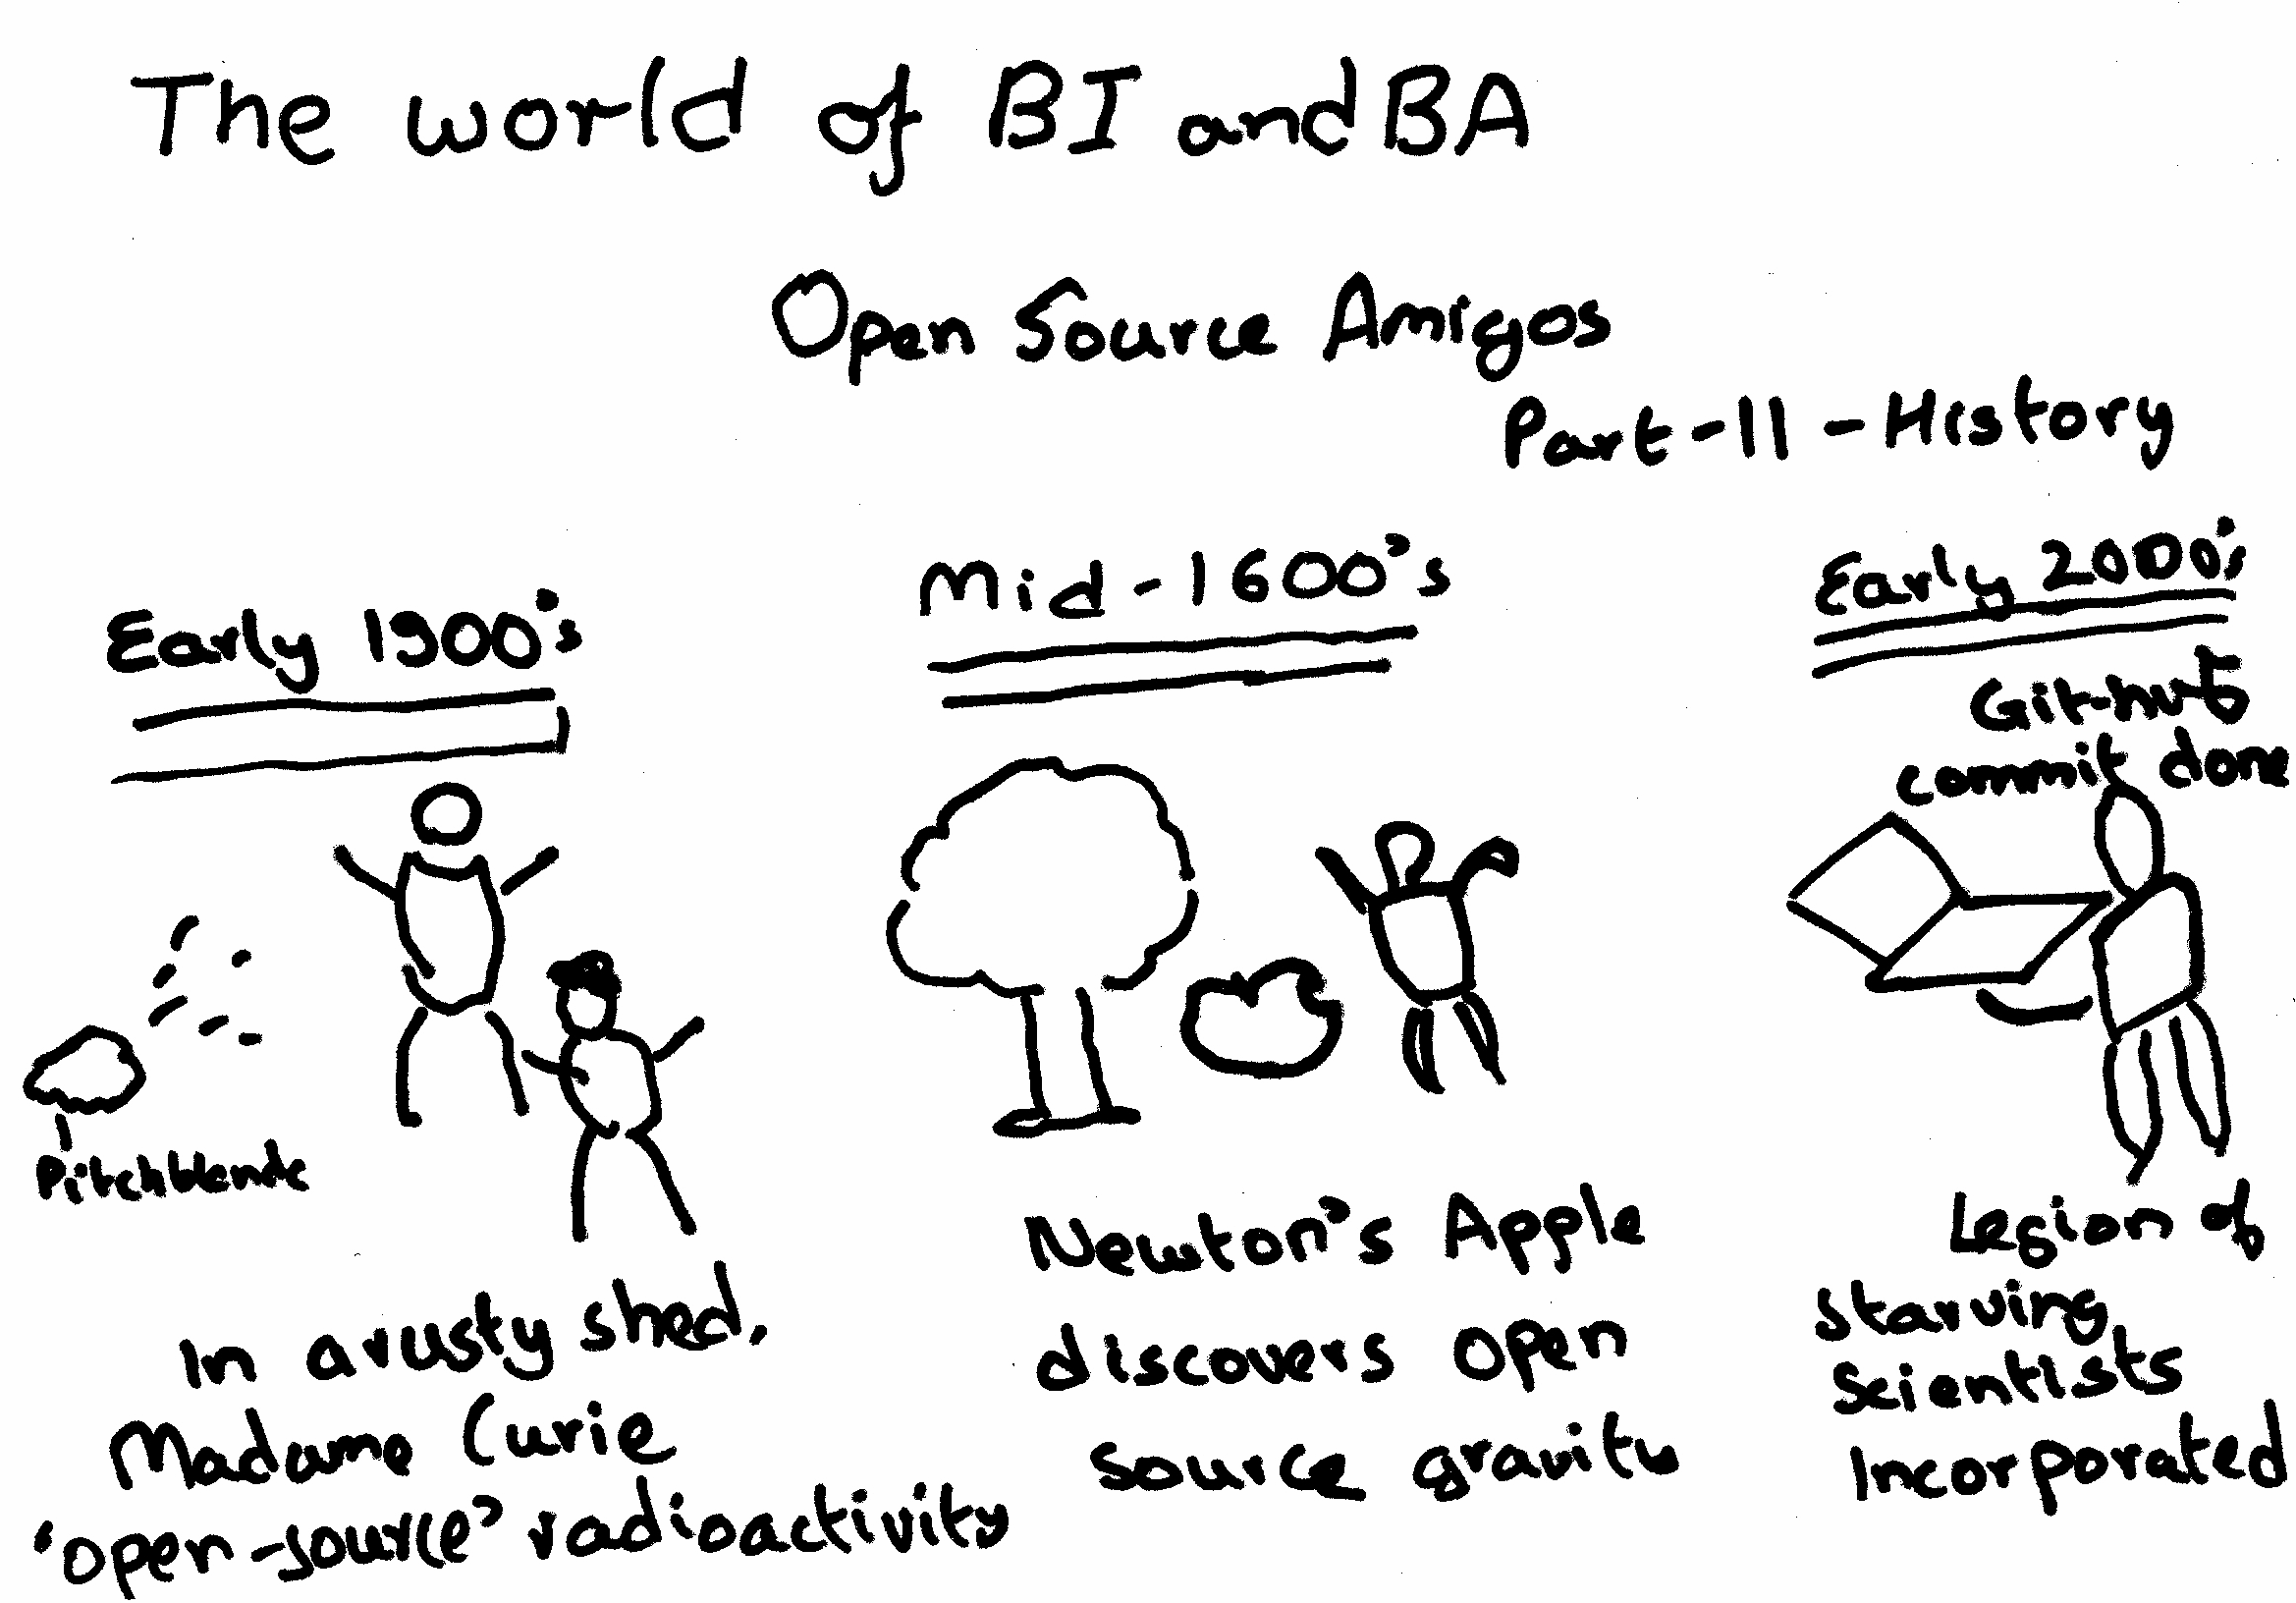
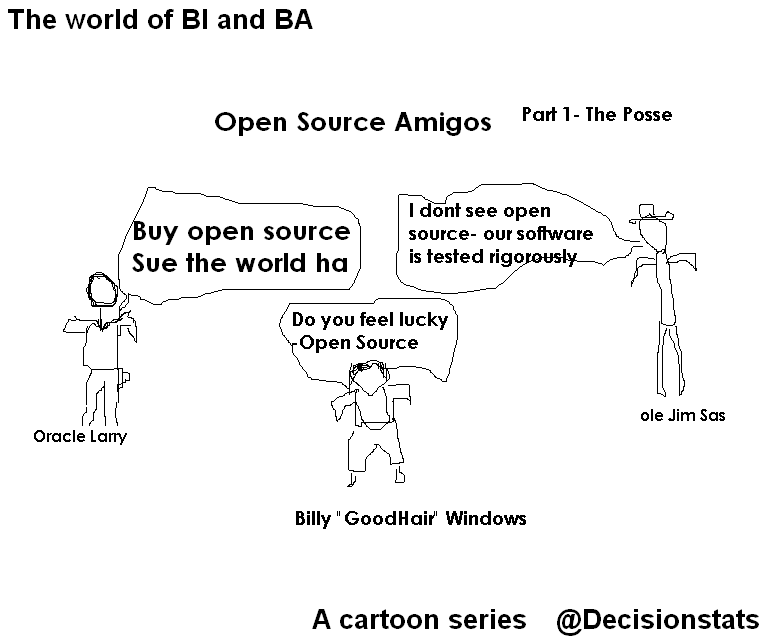
Ok I promised a weekly cartoon on Friday but it’s Saturday. Last week we spoofed Larry Ellison , Jim Goodnight and Bill Gates– people who created billions of taxes for the economy but would be regarded as evil by some open source guys- though they may have created more jobs for more families than the whole Federal Reserve Bank did in 2008-10. Jobs are necessary for families. Period.
In Part 2- we see Open Source is actually older than Stallman (yes people are older than Stallman) – in fact open source has been around for far more time than even
Jim Goodnight’s current age- which can be revealed by using proc goodnight options=all.
Here is a short list of resources and material I put together as starting points for R and Cloud Computing It’s a bit messy but overall should serve quite comprehensively.
Cloud computing is a commonly used expression to imply a generational change in computing from desktop-servers to remote and massive computing connections,shared computers, enabled by high bandwidth across the internet.
As per the National Institute of Standards and Technology Definition,
Cloud computing is a model for enabling convenient, on-demand network access to a shared pool of configurable computing resources (e.g., networks, servers, storage, applications, and services) that can be rapidly provisioned and released with minimal management effort or service provider interaction.
Rweb is developed and maintained by Jeff Banfield. The Rweb Home Page provides access to all three versions of Rweb—a simple text entry form that returns output and graphs, a more sophisticated JavaScript version that provides a multiple window environment, and a set of point and click modules that are useful for introductory statistics courses and require no knowledge of the R language. All of the Rweb versions can analyze Web accessible datasets if a URL is provided.
The paper “Rweb: Web-based Statistical Analysis”, providing a detailed explanation of the different versions of Rweb and an overview of how Rweb works, was published in the Journal of Statistical Software (http://www.jstatsoft.org/v04/i01/).
Ulf Bartel has developed R-Online, a simple on-line programming environment for R which intends to make the first steps in statistical programming with R (especially with time series) as easy as possible. There is no need for a local installation since the only requirement for the user is a JavaScript capable browser. See http://osvisions.com/r-online/ for more information.
Rcgi is a CGI WWW interface to R by MJ Ray. It had the ability to use “embedded code”: you could mix user input and code, allowing the HTMLauthor to do anything from load in data sets to enter most of the commands for users without writing CGI scripts. Graphical output was possible in PostScript or GIF formats and the executed code was presented to the user for revision. However, it is not clear if the project is still active.
Currently, a modified version of Rcgi by Mai Zhou (actually, two versions: one with (bitmap) graphics and one without) as well as the original code are available from http://www.ms.uky.edu/~statweb/.
David Firth has written CGIwithR, an R add-on package available from CRAN. It provides some simple extensions to R to facilitate running R scripts through the CGI interface to a web server, and allows submission of data using both GET and POST methods. It is easily installed using Apache under Linux and in principle should run on any platform that supports R and a web server provided that the installer has the necessary security permissions. David’s paper “CGIwithR: Facilities for Processing Web Forms Using R” was published in the Journal of Statistical Software (http://www.jstatsoft.org/v08/i10/). The package is now maintained by Duncan Temple Lang and has a web page athttp://www.omegahat.org/CGIwithR/.
Rpad, developed and actively maintained by Tom Short, provides a sophisticated environment which combines some of the features of the previous approaches with quite a bit of JavaScript, allowing for a GUI-like behavior (with sortable tables, clickable graphics, editable output), etc.
Jeff Horner is working on the R/Apache Integration Project which embeds the R interpreter inside Apache 2 (and beyond). A tutorial and presentation are available from the project web page at http://biostat.mc.vanderbilt.edu/twiki/bin/view/Main/RApacheProject.
Rserve is a project actively developed by Simon Urbanek. It implements a TCP/IP server which allows other programs to use facilities of R. Clients are available from the web site for Java and C++ (and could be written for other languages that support TCP/IP sockets).
OpenStatServer is being developed by a team lead by Greg Warnes; it aims “to provide clean access to computational modules defined in a variety of computational environments (R, SAS, Matlab, etc) via a single well-defined client interface” and to turn computational services into web services.
Two projects use PHP to provide a web interface to R. R_PHP_Online by Steve Chen (though it is unclear if this project is still active) is somewhat similar to the above Rcgi and Rweb. R-php is actively developed by Alfredo Pontillo and Angelo Mineo and provides both a web interface to R and a set of pre-specified analyses that need no R code input.
webbioc is “an integrated web interface for doing microarray analysis using several of the Bioconductor packages” and is designed to be installed at local sites as a shared computing resource.
Rwui is a web application to create user-friendly web interfaces for R scripts. All code for the web interface is created automatically. There is no need for the user to do any extra scripting or learn any new scripting techniques. Rwui can also be found at http://rwui.cryst.bbk.ac.uk.
Finally, the R.rsp package by Henrik Bengtsson introduces “R Server Pages”. Analogous to Java Server Pages, an R server page is typically HTMLwith embedded R code that gets evaluated when the page is requested. The package includes an internal cross-platform HTTP server implemented in Tcl, so provides a good framework for including web-based user interfaces in packages. The approach is similar to the use of the brew package withRapache with the advantage of cross-platform support and easy installation.
Remote access to R/Bioconductor on EBI’s 64-bit Linux Cluster
Start the workbench by downloading the package for your operating system (Macintosh or Windows), or via Java Web Start, and you will get access to an instance of R running on one of EBI’s powerful machines. You can install additional packages, upload your own data, work with graphics and collaborate with colleagues, all as if you are running R locally, but unlimited by your machine’s memory, processor or data storage capacity.
Most up-to-date R version built for multicore CPUs
Access to all Bioconductor packages
Access to our computing infrastructure
Fast access to data stored in EBI’s repositories (e.g., public microarray data in ArrayExpress)
Using R Google Docs http://www.omegahat.org/RGoogleDocs/run.pdf
It uses the XML and RCurl packages and illustrates that it is relatively quick and easy
to use their primitives to interact with Web services.
Amazon’s EC2 is a type of cloud that provides on demand computing infrastructures called an Amazon Machine Images or AMIs. In general, these types of cloud provide several benefits:
Simple and convenient to use. An AMI contains your applications, libraries, data and all associated configuration settings. You simply access it. You don’t need to configure it. This applies not only to applications like R, but also can include any third-party data that you require.
On-demand availability. AMIs are available over the Internet whenever you need them. You can configure the AMIs yourself without involving the service provider. You don’t need to order any hardware and set it up.
Elastic access. With elastic access, you can rapidly provision and access the additional resources you need. Again, no human intervention from the service provider is required. This type of elastic capacity can be used to handle surge requirements when you might need many machines for a short time in order to complete a computation.
Pay per use. The cost of 1 AMI for 100 hours and 100 AMI for 1 hour is the same. With pay per use pricing, which is sometimes called utility pricing, you simply pay for the resources that you use.
#This example requires you had previously created a bucket named data_language on your Google Storage and you had uploaded a CSV file named language_id.txt (your data) into this bucket – see for details
library(predictionapirwrapper)
Elastic-R is a new portal built using the Biocep-R platform. It enables statisticians, computational scientists, financial analysts, educators and students to use cloud resources seamlessly; to work with R engines and use their full capabilities from within simple browsers; to collaborate, share and reuse functions, algorithms, user interfaces, R sessions, servers; and to perform elastic distributed computing with any number of virtual machines to solve computationally intensive problems.
Also see Karim Chine’s http://biocep-distrib.r-forge.r-project.org/
R for Salesforce.com
At the point of writing this, there seem to be zero R based apps on Salesforce.com This could be a big opportunity for developers as both Apex and R have similar structures Developers could write free code in R and charge for their translated version in Apex on Salesforce.com
Force.com and Salesforce have many (1009) apps at http://sites.force.com/appexchange/home for cloud computing for
businesses, but very few forecasting and statistical simulation apps.
These are like iPhone apps except meant for business purposes (I am
unaware if any university is offering salesforce.com integration
though google apps and amazon related research seems to be on)
Personal Note-Mentioning SAS in an email to a R list is a big no-no in terms of getting a response and love. Same for being careless about which R help list to email (like R devel or R packages or R help)
Pyspread is a cross-platform Python spreadsheet application. It is based on and written in the programming language Python.
Instead of spreadsheet formulas, Python expressions are entered into the spreadsheet cells. Each expression returns a Python object that can be accessed from other cells. These objects can represent anything including lists or matrices.
features
In pyspread, cells expect Python expressions and return Python objects. Therefore, complex data types such as lists, trees or matrices can be handled within a single cell. Macros can be used for functions that are too complex for a single expression.
Since Python modules can be easily used without external scripts, arbitrary size rational numbers (via gmpy), fixed point decimal numbers for business calculations, (via the decimal module from the standard library) and advanced statistics including plotting functions (via RPy) can be used in the spreadsheet. Everything is directly available from each cell. Just use the grid
Data can be imported and exported using csv files or the clipboard. Other forms of data exchange is possible using external Python modules.
In order to simplify sparse matrix editing, pyspread features a three dimensional grid that can be sized up to 85,899,345 rows and 14,316,555 columns (64 bit-systems, depends on row height and column width). Note that importing a million cells requires about 500 MB of memory.
The concept of pyspread allows doing everything from each cell that a Python script can do. This may very well include deleting your hard drive or sending your data via the Internet. Of course this is a non-issue if you sandbox properly or if you only use self developed spreadsheets. Since this is not the case for everyone (see the discussion at lwn.net), a GPG signature based trust model for spreadsheet files has been introduced. It ensures that only your own trusted files are executed on loading. Untrusted files are displayed in safe mode. You can trust a file manually. Inspect carefully.
requirements
Pyspread runs on Linux, Windows and *nix platforms with GTK+ support. There are reports that it works with MacOS X as well. If you would like to contribute by testing on OS X please contact me.
a spreadsheet with more powerful functions and data structures that are accessible inside each cell. Something like Python that empowers you to do things quickly. And yes, it should be free and it should run on Linux as well as on Windows. I looked around and found nothing that suited me. Therefore, I started pyspread.
Concept
Each cell accepts any input that works in a Python command line.
The inputs are parsed and evaluated by Python’s eval command.
The result objects are accessible via a 3D numpy object array.
String representations of the result objects are displayed in the cells.
Benefits
Each cell returns a Python object. This object can be anything including arrays and third party library objects.
Generator expressions can be used efficiently for data manipulation.
Efficient numpy slicing is used.
numpy methods are accessible for the data.
Installation
Download the pyspread tarball or zip and unzip at a convenient place
In case you do not have it already get and install Python, wxpython and numpy
If you want the examples to work, install gmpy, R and rpy
To help new AWS customers get started in the cloud, AWS is introducing a new free usage tier. Beginning November 1, new AWScustomers will be able to run a free Amazon EC2 Micro Instance for a year, while also leveraging a new free usage tier for Amazon S3, Amazon Elastic Block Store, Amazon Elastic Load Balancing, and AWSdata transfer. AWS’s free usage tier can be used for anything you want to run in the cloud: launch new applications, test existing applications in the cloud, or simply gain hands-on experience with AWS.
Below are the highlights of AWS’s new free usage tiers. All are available for one year (except Amazon SimpleDB, SQS, and SNS which are free indefinitely):
AWS’s free usage tier startsNovember 1, 2010. A valid creditcard is required to sign up.
See offer terms.
AWS Free Usage Tier (Per Month):
750 hours of Amazon EC2 Linux Micro Instance usage (613 MB of memory and 32-bit and 64-bit platform support) – enough hours to run continuously each month*
In addition to these services, the AWS Management Console is available at no charge to help you build and manage your application on AWS.
* These free tiers are only available to new AWS customers and are available for 12 months following your AWSsign-up date. When your free usage expires or if your application use exceeds the free usage tiers, you simply pay standard, pay-as-you-go service rates (see each service page for full pricing details). Restrictions apply; see offer terms for more details.
** These free tiers do not expire after 12 months and are available to both existing and new AWS customers indefinitely.
The new AWS free usage tier applies to participating services across all AWS regions: US – N. Virginia, US – N. California, EU – Ireland, and APAC – Singapore. Your free usage is calculated each month across all regions and automatically applied to your bill – free usage does not accumulate.