Google Cloud SQL

Another xing bang API from the boyz in Mountain View. (entry by invite only) But it is free and you can test your stuff on a MySQL db =10 GB

Database as a service ? (Maybe)— while Amazon was building fires (and Fire)

—————————————————————–

https://code.google.com/apis/sql/index.html

What is Google Cloud SQL?

Google Cloud SQL is a web service that provides a highly available, fully-managed, hosted SQL storage solution for your App Engine applications.

What are the benefits of using Google Cloud SQL?

You can access a familiar, highly available SQL database from your App Engine applications, without having to worry about provisioning, management, and integration with other Google services.

How much does Google Cloud SQL cost?

We will not be billing for this service in 2011. We will give you at least 30 days’ advance notice before we begin billing in the future. Other services such as Google App Engine, Google Cloud Storage etc. that you use with Google Cloud SQL may have their own payment terms, and you need to pay for them. Please consult their documentation for details.

Currently you are limited to the three instance sizes. What if I need to store more data or need better performance?

In the Limited Preview period, we only have three sizes available. If you have specific needs, we would like to hear from you on our google-cloud-sqldiscussion board.

When is Google Cloud SQL be out of Limited Preview?

We are working hard to make the service generally available.We don’t have a firm date that we can announce right now.

Do you support all the features of MySQL?

In general, Google Cloud SQL supports all the features of MySQL. The following are lists of all the unsupported features and notable differences that Google Cloud SQL has from MySQL.

Unsupported Features:

  • User defined functions
  • MySql replication

Unsupported MySQL statements:

  • LOAD DATA INFILE
  • SELECT ... INTO OUTFILE
  • SELECT ... INTO DUMPFILE
  • INSTALL PLUGIN .. SONAME ...
  • UNINSTALL PLUGIN
  • CREATE FUNCTION ... SONAME ...

Unsupported SQL Functions:

  • LOAD_FILE()

Notable Differences:

  • If you want to import databases with binary data into your Google Cloud SQL instance, you must use the --hex-blob option with mysqldump.Although this is not a required flag when you are using a local MySQL server instance and the MySQL command line, it is required if you want to import any databases with binary data into your Google Cloud SQL instance. For more information, see Importing Data.
How large a database can I use with Google Cloud SQL?
Currently, in this limited preview period, your database instance must be no larger than 10GB.
How can I be notified when there are any changes to Google Cloud SQL?
You can sign up for the sql-announcements forum where we post announcements and news about the Google Cloud SQL.
How can I cancel my Google Cloud SQL account?
To remove all data from your Google Cloud SQL account and disable the service:

  1. Delete all your data. You can remove your tables, databases, and indexes using the drop command. For more information, see SQL DROP statement.
  2. Deactivate the Google Cloud SQL by visiting the Services pane and clicking the On button next to Google Cloud SQL. The button changes from Onto Off.
How do I report a bug, request a feature, or ask a question?
You can report bugs and request a feature on our project page.You can ask a question in our discussion forum.

Getting Started

Can I use languages other than Java or Python?
Only Java and Python are supported for Google Cloud SQL.
Can I use Google Cloud SQL outside of Google App Engine?
The Limited Preview is primarily focused on giving Google App Engine customers the ability to use a familiar relational database environment. Currently, you cannot access Google Cloud SQL from outside Google App Engine.
What database engine are we using in the Google Cloud SQL?
MySql Version 5.1.59
Do I need to install a local version of MySQL to use the Development Server?
Yes.

Managing Your Instances

Do I need to use the Google APIs Console to use Google Cloud SQL?
Yes. For basic tasks like granting access control to applications, creating instances, and deleting instances, you need to use the Google APIs Console.
Can I import or export specific databases?
No, currently it is not possible to export specific databases. You can only export your entire instance.
Do I need a Google Cloud Storage account to import or export my instances?
Yes, you need to sign up for a Google Cloud Storage account or have access to a Google Cloud Storage account to import or export your instances. For more information, see Importing and Exporting Data.
If I delete my instance, can I reuse the instance name?
Yes, but not right away. The instance name is reserved for up to two months before it can be reused.

Tools & Resources

Can I use Django with Google Cloud SQL?
No, currently Google Cloud SQL is not compatible with Django.
What is the best tool to use for interacting with my instance?
There are a variety of tools available for Google Cloud SQL. For executing simple statements, you can use the SQL prompt. For executing more complicated tasks, you might want to use the command line tool. If you want to use a tool with a graphical interface, the SQuirrel SQL Client provides an interface you can use to interact with your instance.

Common Technical Questions

Should I use InnoDB for my tables?
Yes. InnoDB is the default storage engine in MySQL 5.5 and is also the recommended storage engine for Google Cloud SQL. If you do not need any features that require MyISAM, you should use InnoDB. You can convert your existing tables using the following SQL command, replacing tablename with the name of the table to convert:

ALTER tablename ENGINE = InnoDB;

If you have a mysqldump file where all your tables are in MyISAM format, you can convert them by piping the file through a sed script:

mysqldump --databases database_name [-u username -p  password] --hex-blob database_name | sed 's/ENGINE=MyISAM/ENGINE=InnoDB/g' > database_file.sql

Warning: You should not do this if your mysqldump file contains the mysql schema. Those files must remain in MyISAM.

Are there any size or QPS limits?
Yes, the following limits apply to Google Cloud SQL:

Resource Limits from External Requests Limits from Google App Engine
Queries Per Second (QPS) 5 QPS No limit
Maximum Request Size 16 MB
Maximum Response Size 16 MB

Google App Engine Limits

Google App Engine applications are also subject to additional Google App Engine quotas and limits. Requests from Google App Engine applications to Google Cloud SQL are subject to the following time limits:

  • All database requests must finish within the HTTP request timer, around 60 seconds.
  • Offline requests like cron tasks have a time limit of 10 minutes.
  • Backend requests to Google Cloud SQL have a time limit of 10 minutes.

App Engine-specific quotas and access limits are discussed on the Google App Engine Quotas page.

Should I use Google Cloud SQL with my non-High Replication App Engine application?
We recommend that you use Google Cloud SQL with High Replication App Engine applications. While you can use use Google Cloud SQL with applications that do not use high replication, doing so might impact performance.
Source-
https://code.google.com/apis/sql/faq.html#supportmysqlfeatures

Using R with MySQL #rstats

A brief tutorial to working with R and MySQL. MySQL belongs to Oracle is one of the most widely used databases now.

1. Download mySQL from
http://www.mysql.com/downloads/mysql/  or (http://www.mysql.com/downloads/mirror.php?id=403831)
Click Install -use default options, remember to note down the password=XX
2.Download the ODBC connector from http://www.mysql.com/downloads/connector/odbc/5.1.htmlThe Data Sources (ODBC) can be located from the Control Panel in Windows7

Install ODBC Connector by double clicking the .msi file downloaded in Step 2-
Check this screenshot in ODBC Connectors to verify-
Note this is the Drivers tab in ODBC Data Source Administrator
Click the System DSN and Configure MySQL using the add button 
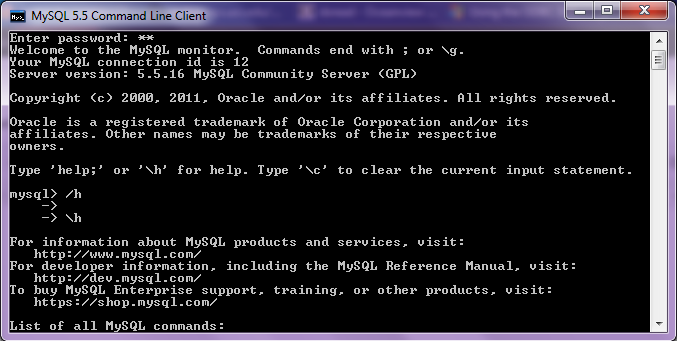
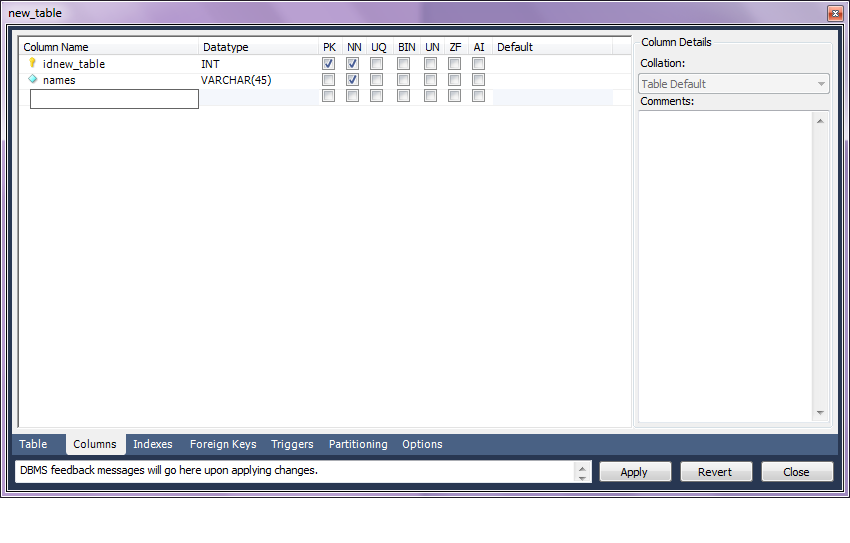
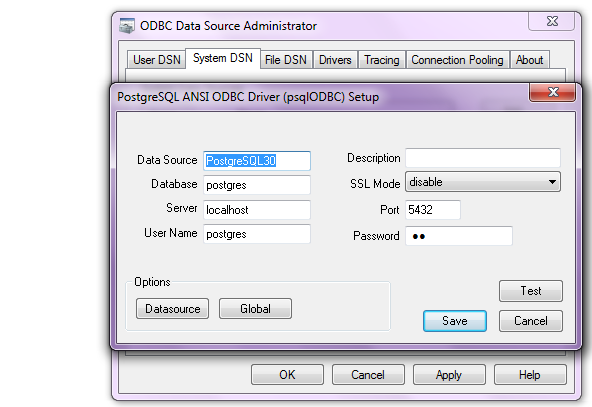
Use the configuration options shown exactly here. The user is root, the TCP/IP Server is local host, use the same password in Step 1 and the Database is MySQL
Test the connection

Click OK to finish this step.
Click the User DSN tab (and repeating the step  immediately above -Add, and Configure the connection using options The user is root, the TCP/IP Server is local host, use the same password in Step 1 and the Database is MySQL , Test the connection and OK to add the connection

3. Download the MySQL workbench from http://www.mysql.com/downloads/workbench/

This is very helpful to configuring the database
http://www.mysql.com/downloads/mirror.php?id=403983#mirrors

Create a new table using the options in the screenshots below

Open Connection

You can create a new table using the options as below,
Once created you can also add new variables (using the Columns Tab)

MySQL allows you create new columns very easily
The  SQL commands are automatically generated.
Click Apply  to execute the changes to the Database.

Now we start R
Type the commands in the screenshot below to create a connection to the Database in MySQL
> library(RODBC)
> odbcDataSources()
> ajay=odbcConnect(“MySQL”,uid=”root”,pwd=”XX”)
> ajay
> sqlTables(ajay)
>tested=sqlFetch(ajay,”host”)

Note- this is a brief tutorial for beginners without getting into too many complexities of database administration and management, to start using R and MySQL.

Knowledge Discovery in Databases -KDD using PostgreSQL and #Rstats

Here is a small brief primer for beginners on configuring an open source database and using an open source analytics package.

All you need to know – is to read!


1. download PostgreSQL from
http://www.postgresql.org/download/windowsInstall PostgreSQL

Remember to store /memorize the password for the user postgres!

Create a connection using pgAdmin feature in Start Menu

2. download ODBC driver from
http://www.postgresql.org/ftp/odbc/versions/msi/
and the Win 64 edition from
http://wwwmaster.postgresql.org/download/mirrors-ftp/odbc/versions/msi/psqlodbc_09_00_0310-x64.zip

install ODBC driver

3. Go to

Start Menu\Control Panel\All Control Panel Items\Administrative Tools\Data Sources (ODBC)

4. Configure the following details in System DSN and  User DSN using the ADD tabs .Test connection to check if connection is working

5. Start R and install and load library RODBC

6. Use following initial code for R- if you know SQL you can  do the rest
> library(RODBC)

> odbcDataSources(type = c(“all”, “user”, “system”))
SQLServer              PostgreSQL30             PostgreSQL35W
“SQL Server”    “PostgreSQL ANSI(x64)” “PostgreSQL Unicode(x64)”

> ajay=odbcConnect(“PostgreSQL30”, uid = “postgres”, pwd = “XX”)

> sqlTables(ajay)
TABLE_QUALIFIER TABLE_OWNER TABLE_NAME TABLE_TYPE REMARKS
1        postgres      public      names      TABLE

> crimedat <- sqlFetch(ajay, “names”)

Using Google Fusion Tables from #rstats

But after all that- I was quite happy to see Google Fusion Tables within Google Docs. Databases as a service ? Not quite but still quite good, and lets see how it goes.

https://www.google.com/fusiontables/DataSource?dsrcid=implicit&hl=en_US&pli=1

http://googlesystem.blogspot.com/2011/09/fusion-tables-new-google-docs-app.html


But what interests me more is

http://code.google.com/apis/fusiontables/docs/developers_guide.html

The Google Fusion Tables API is a set of statements that you can use to search for and retrieve Google Fusion Tables data, insert new data, update existing data, and delete data. The API statements are sent to the Google Fusion Tables server using HTTP GET requests (for queries) and POST requests (for inserts, updates, and deletes) from a Web client application. The API is language agnostic: you can write your program in any language you prefer, as long as it provides some way to embed the API calls in HTTP requests.

The Google Fusion Tables API does not provide the mechanism for submitting the GET and POST requests. Typically, you will use an existing code library that provides such functionality; for example, the code libraries that have been developed for the Google GData API. You can also write your own code to implement GET and POST requests.

Also see http://code.google.com/apis/fusiontables/docs/sample_code.html


Google Fusion Tables API Sample Code

Libraries

SQL API

Language Library Public repository Samples
Python Fusion Tables Python Client Library fusion-tables-client-python/ Samples
PHP Fusion Tables PHP Client Library fusion-tables-client-php/ Samples

Featured Samples

An easy way to learn how to use an API can be to look at sample code. The table above provides links to some basic samples for each of the languages shown. This section highlights particularly interesting samples for the Fusion Tables API.

SQL API

Language Featured samples API version
cURL
  • Hello, cURLA simple example showing how to use curl to access Fusion Tables.
SQL API
Google Apps Script SQL API
Java
  • Hello, WorldA simple walkthrough that shows how the Google Fusion Tables API statements work.
  • OAuth example on fusion-tables-apiThe Google Fusion Tables team shows how OAuth authorization enables you to use the Google Fusion Tables API from a foreign web server with delegated authorization.
SQL API
Python
  • Docs List ExampleDemonstrates how to:
    • List tables
    • Set permissions on tables
    • Move a table to a folder
Docs List API
Android (Java)
  • Basic Sample ApplicationDemo application shows how to create a crowd-sourcing application that allows users to report potholes and save the data to a Fusion Table.
SQL API
JavaScript – FusionTablesLayer Using the FusionTablesLayer, you can display data on a Google Map

Also check out FusionTablesLayer Builder, which generates all the code necessary to include a Google Map with a Fusion Table Layer on your own website.

FusionTablesLayer, Google Maps API
JavaScript – Google Chart Tools Using the Google Chart Tools, you can request data from Fusion Tables to use in visualizations or to display directly in an HTML page. Note: responses are limited to 500 rows of data.

Google Chart Tools

External Resources

Google Fusion Tables is dedicated to providing code examples that illustrate typical uses, best practices, and really cool tricks. If you do something with the Google Fusion Tables API that you think would be interesting to others, please contact us at googletables-feedback@google.com about adding your code to our Examples page.

  • Shape EscapeA tool for uploading shape files to Fusion Tables.
  • GDALOGR Simple Feature Library has incorporated Fusion Tables as a supported format.
  • Arc2CloudArc2Earth has included support for upload to Fusion Tables via Arc2Cloud.
  • Java and Google App EngineODK Aggregate is an AppEngine application by the Open Data Kit team, uses Google Fusion Tables to store survey data that is collected through input forms on Android mobile phones. Notable code:
  • R packageAndrei Lopatenko has written an R interface to Fusion Tables so Fusion Tables can be used as the data store for R.
  • RubySimon Tokumine has written a Ruby gem for access to Fusion Tables from Ruby.


Updated-You can use Google Fusion Tables from within R from http://andrei.lopatenko.com/rstat/fusion-tables.R


ft.connect <- function(username, password) {
  url = "https://www.google.com/accounts/ClientLogin";
  params = list(Email = username, Passwd = password, accountType="GOOGLE", service= "fusiontables", source = "R_client_API")
 connection = postForm(uri = url, .params = params)
 if (length(grep("error", connection, ignore.case = TRUE))) {
 	stop("The wrong username or password")
 	return ("")
 }
 authn = strsplit(connection, "\nAuth=")[[c(1,2)]]
 auth = strsplit(authn, "\n")[[c(1,1)]]
 return (auth)
}

ft.disconnect <- function(connection) {
}

ft.executestatement <- function(auth, statement) {
      url = "http://tables.googlelabs.com/api/query"
      params = list( sql = statement)
      connection.string = paste("GoogleLogin auth=", auth, sep="")
      opts = list( httpheader = c("Authorization" = connection.string))
      result = postForm(uri = url, .params = params, .opts = opts)
      if (length(grep("<HTML>\n<HEAD>\n<TITLE>Parse error", result, ignore.case = TRUE))) {
      	stop(paste("incorrect sql statement:", statement))
      }
      return (result)
}

ft.showtables <- function(auth) {
   url = "http://tables.googlelabs.com/api/query"
   params = list( sql = "SHOW TABLES")
   connection.string = paste("GoogleLogin auth=", auth, sep="")
   opts = list( httpheader = c("Authorization" = connection.string))
   result = getForm(uri = url, .params = params, .opts = opts)
   tables = strsplit(result, "\n")
   tableid = c()
   tablename = c()
   for (i in 2:length(tables[[1]])) {
     	str = tables[[c(1,i)]]
   	    tnames = strsplit(str,",")
   	    tableid[i-1] = tnames[[c(1,1)]]
   	    tablename[i-1] = tnames[[c(1,2)]]
   	}
   	tables = data.frame( ids = tableid, names = tablename)
    return (tables)
}

ft.describetablebyid <- function(auth, tid) {
   url = "http://tables.googlelabs.com/api/query"
   params = list( sql = paste("DESCRIBE", tid))
   connection.string = paste("GoogleLogin auth=", auth, sep="")
   opts = list( httpheader = c("Authorization" = connection.string))
   result = getForm(uri = url, .params = params, .opts = opts)
   columns = strsplit(result,"\n")
   colid = c()
   colname = c()
   coltype = c()
   for (i in 2:length(columns[[1]])) {
     	str = columns[[c(1,i)]]
   	    cnames = strsplit(str,",")
   	    colid[i-1] = cnames[[c(1,1)]]
   	    colname[i-1] = cnames[[c(1,2)]]
   	    coltype[i-1] = cnames[[c(1,3)]]
   	}
   	cols = data.frame(ids = colid, names = colname, types = coltype)
    return (cols)
}

ft.describetable <- function (auth, table_name) {
   table_id = ft.idfromtablename(auth, table_name)
   result = ft.describetablebyid(auth, table_id)
   return (result)
}

ft.idfromtablename <- function(auth, table_name) {
    tables = ft.showtables(auth)
	tableid = tables$ids[tables$names == table_name]
	return (tableid)
}

ft.importdata <- function(auth, table_name) {
	tableid = ft.idfromtablename(auth, table_name)
	columns = ft.describetablebyid(auth, tableid)
	column_spec = ""
	for (i in 1:length(columns)) {
		column_spec = paste(column_spec, columns[i, 2])
		if (i < length(columns)) {
			column_spec = paste(column_spec, ",", sep="")
		}
	}
	mdata = matrix(columns$names,
	              nrow = 1, ncol = length(columns),
	              dimnames(list(c("dummy"), columns$names)), byrow=TRUE)
	select = paste("SELECT", column_spec)
	select = paste(select, "FROM")
	select = paste(select, tableid)
	result = ft.executestatement(auth, select)
    numcols = length(columns)
    rows = strsplit(result, "\n")
    for (i in 3:length(rows[[1]])) {
    	row = strsplit(rows[[c(1,i)]], ",")
    	mdata = rbind(mdata, row[[1]])
   	}
   	output.frame = data.frame(mdata[2:length(mdata[,1]), 1])
   	for (i in 2:ncol(mdata)) {
   		output.frame = cbind(output.frame, mdata[2:length(mdata[,i]),i])
   	}
   	colnames(output.frame) = columns$names
    return (output.frame)
}

quote_value <- function(value, to_quote = FALSE, quote = "'") {
	 ret_value = ""
     if (to_quote) {
     	ret_value = paste(quote, paste(value, quote, sep=""), sep="")
     } else {
     	ret_value = value
     }
     return (ret_value)
}

converttostring <- function(arr, separator = ", ", column_types) {
	con_string = ""
	for (i in 1:(length(arr) - 1)) {
		value = quote_value(arr[i], column_types[i] != "number")
		con_string = paste(con_string, value)
	    con_string = paste(con_string, separator, sep="")
	}

    if (length(arr) >= 1) {
    	value = quote_value(arr[length(arr)], column_types[length(arr)] != "NUMBER")
    	con_string = paste(con_string, value)
    }
}

ft.exportdata <- function(auth, input_frame, table_name, create_table) {
	if (create_table) {
       create.table = "CREATE TABLE "
       create.table = paste(create.table, table_name)
       create.table = paste(create.table, "(")
       cnames = colnames(input_frame)
       for (columnname in cnames) {
         create.table = paste(create.table, columnname)
    	 create.table = paste(create.table, ":string", sep="")
    	   if (columnname != cnames[length(cnames)]){
    		  create.table = paste(create.table, ",", sep="")
           }
       }
      create.table = paste(create.table, ")")
      result = ft.executestatement(auth, create.table)
    }
    if (length(input_frame[,1]) > 0) {
    	tableid = ft.idfromtablename(auth, table_name)
	    columns = ft.describetablebyid(auth, tableid)
	    column_spec = ""
	    for (i in 1:length(columns$names)) {
		   column_spec = paste(column_spec, columns[i, 2])
		   if (i < length(columns$names)) {
			  column_spec = paste(column_spec, ",", sep="")
		   }
	    }
    	insert_prefix = "INSERT INTO "
    	insert_prefix = paste(insert_prefix, tableid)
    	insert_prefix = paste(insert_prefix, "(")
    	insert_prefix = paste(insert_prefix, column_spec)
    	insert_prefix = paste(insert_prefix, ") values (")
    	insert_suffix = ");"
    	insert_sql_big = ""
    	for (i in 1:length(input_frame[,1])) {
    		data = unlist(input_frame[i,])
    		values = converttostring(data, column_types  = columns$types)
    		insert_sql = paste(insert_prefix, values)
    		insert_sql = paste(insert_sql, insert_suffix) ;
    		insert_sql_big = paste(insert_sql_big, insert_sql)
    		if (i %% 500 == 0) {
    			ft.executestatement(auth, insert_sql_big)
    			insert_sql_big = ""
    		}
    	}
        ft.executestatement(auth, insert_sql_big)
    }
}

Cloud Computing by Windows , Amazon and Google for free

Some ways to test and use cloud computing for free for yourself-

  1. Windows Azure
  2. Amazon Ec2
  3. Google Storage

The folks at Microsoft Azure announced a 90 day free trial Continue reading “Cloud Computing by Windows , Amazon and Google for free”

Interview Rapid-I -Ingo Mierswa and Simon Fischer

Here is an interview with Dr Ingo Mierswa , CEO of Rapid -I and Dr Simon Fischer, Head R&D. Rapid-I makes the very popular software Rapid Miner – perhaps one of the earliest leading open source software in business analytics and business intelligence. It is quite easy to use, deploy and with it’s extensions and innovations (including compatibility with R )has continued to grow tremendously through the years.

In an extensive interview Ingo and Simon talk about algorithms marketplace, extensions , big data analytics, hadoop, mobile computing and use of the graphical user interface in analytics.

Special Thanks to Nadja from Rapid I communication team for helping coordinate this interview.( Statuary Blogging Disclosure- Rapid I is a marketing partner with Decisionstats as per the terms in https://decisionstats.com/privacy-3/)

Ajay- Describe your background in science. What are the key lessons that you have learnt while as scientific researcher and what advice would you give to new students today.

Ingo: My time as researcher really was a great experience which has influenced me a lot. I have worked at the AI lab of Prof. Dr. Katharina Morik, one of the persons who brought machine learning and data mining to Europe. Katharina always believed in what we are doing, encouraged us and gave us the space for trying out new things. Funnily enough, I never managed to use my own scientific results in any real-life project so far but I consider this as a quite common gap between science and the “real world”. At Rapid-I, however, we are still heavily connected to the scientific world and try to combine the best of both worlds: solving existing problems with leading-edge technologies.

Simon: In fact, during my academic career I have not worked in the field of data mining at all. I worked on a field some of my colleagues would probably even consider boring, and that is theoretical computer science. To be precise, my research was in the intersection of game theory and network theory. During that time, I have learnt a lot of exciting things, none of which had any business use. Still, I consider that a very valuable experience. When we at Rapid-I hire people coming to us right after graduating, I don’t care whether they know the latest technology with a fancy three-letter acronym – that will be forgotten more quickly than it came. What matters is the way you approach new problems and challenges. And that is also my recommendation to new students: work on whatever you like, as long as you are passionate about it and it brings you forward.

Ajay-  How is the Rapid Miner Extensions marketplace moving along. Do you think there is a scope for people to say create algorithms in a platform like R , and then offer that algorithm as an app for sale just like iTunes or Android apps.

 Simon: Well, of course it is not going to be exactly like iTunes or Android apps are, because of the more business-orientated character. But in fact there is a scope for that, yes. We have talked to several developers, e.g., at our user conference RCOMM, and several people would be interested in such an opportunity. Companies using data mining software need supported software packages, not just something they downloaded from some anonymous server, and that is only possible through a platform like the new Marketplace. Besides that, the marketplace will not only host commercial extensions. It is also meant to be a platform for all the developers that want to publish their extensions to a broader community and make them accessible in a comfortable way. Of course they could just place them on their personal Web pages, but who would find them there? From the Marketplace, they are installable with a single click.

Ingo: What I like most about the new Rapid-I Marketplace is the fact that people can now get something back for their efforts. Developing a new algorithm is a lot of work, in some cases even more that developing a nice app for your mobile phone. It is completely accepted that people buy apps from a store for a couple of Dollars and I foresee the same for sharing and selling algorithms instead of apps. Right now, people can already share algorithms and extensions for free, one of the next versions will also support selling of those contributions. Let’s see what’s happening next, maybe we will add the option to sell complete RapidMiner workflows or even some data pools…

Ajay- What are the recent features in Rapid Miner that support cloud computing, mobile computing and tablets. How do you think the landscape for Big Data (over 1 Tb ) is changing and how is Rapid Miner adapting to it.

Simon: These are areas we are very active in. For instance, we have an In-Database-Mining Extension that allows the user to run their modelling algorithms directly inside the database, without ever loading the data into memory. Using analytic databases like Vectorwise or Infobright, this technology can really boost performance. Our data mining server, RapidAnalytics, already offers functionality to send analysis processes into the cloud. In addition to that, we are currently preparing a research project dealing with data mining in the cloud. A second project is targeted towards the other aspect you mention: the use of mobile devices. This is certainly a growing market, of course not for designing and running analyses, but for inspecting reports and results. But even that is tricky: When you have a large screen you can display fancy and comprehensive interactive dashboards with drill downs and the like. On a mobile device, that does not work, so you must bring your reports and visualizations very much to the point. And this is precisely what data mining can do – and what is hard to do for classical BI.

Ingo: Then there is Radoop, which you may have heard of. It uses the Apache Hadoop framework for large-scale distributed computing to execute RapidMiner processes in the cloud. Radoop has been presented at this year’s RCOMM and people are really excited about the combination of RapidMiner with Hadoop and the scalability this brings.

 Ajay- Describe the Rapid Miner analytics certification program and what steps are you taking to partner with academic universities.

Ingo: The Rapid-I Certification Program was created to recognize professional users of RapidMiner or RapidAnalytics. The idea is that certified users have demonstrated a deep understanding of the data analysis software solutions provided by Rapid-I and how they are used in data analysis projects. Taking part in the Rapid-I Certification Program offers a lot of benefits for IT professionals as well as for employers: professionals can demonstrate their skills and employers can make sure that they hire qualified professionals. We started our certification program only about 6 months ago and until now about 100 professionals have been certified so far.

Simon: During our annual user conference, the RCOMM, we have plenty of opportunities to talk to people from academia. We’re also present at other conferences, e.g. at ECML/PKDD, and we are sponsoring data mining challenges and grants. We maintain strong ties with several universities all over Europe and the world, which is something that I would not want to miss. We are also cooperating with institutes like the ITB in Dublin during their training programmes, e.g. by giving lectures, etc. Also, we are leading or participating in several national or EU-funded research projects, so we are still close to academia. And we offer an academic discount on all our products 🙂

Ajay- Describe the global efforts in making Rapid Miner a truly international software including spread of developers, clients and employees.

Simon: Our clients already are very international. We have a partner network in America, Asia, and Australia, and, while I am responding to these questions, we have a training course in the US. Developers working on the core of RapidMiner and RapidAnalytics, however, are likely to stay in Germany for the foreseeable future. We need specialists for that, and it would be pointless to spread the development team over the globe. That is also owed to the agile philosophy that we are following.

Ingo: Simon is right, Rapid-I already is acting on an international level. Rapid-I now has more than 300 customers from 39 countries in the world which is a great result for a young company like ours. We are of course very strong in Germany and also the rest of Europe, but also concentrate on more countries by means of our very successful partner network. Rapid-I continues to build this partner network and to recruit dynamic and knowledgeable partners and in the future. However, extending and acting globally is definitely part of our strategic roadmap.

Biography

Dr. Ingo Mierswa is working as Chief Executive Officer (CEO) of Rapid-I. He has several years of experience in project management, human resources management, consulting, and leadership including eight years of coordinating and leading the multi-national RapidMiner developer team with about 30 developers and contributors world-wide. He wrote his Phd titled “Non-Convex and Multi-Objective Optimization for Numerical Feature Engineering and Data Mining” at the University of Dortmund under the supervision of Prof. Morik.

Dr. Simon Fischer is heading the research & development at Rapid-I. His interests include game theory and networks, the theory of evolutionary algorithms (e.g. on the Ising model), and theoretical and practical aspects of data mining. He wrote his PhD in Aachen where he worked in the project “Design and Analysis of Self-Regulating Protocols for Spectrum Assignment” within the excellence cluster UMIC. Before, he was working on the vtraffic project within the DFG Programme 1126 “Algorithms for large and complex networks”.

http://rapid-i.com/content/view/181/190/ tells you more on the various types of Rapid Miner licensing for enterprise, individual and developer versions.

(Note from Ajay- to receive an early edition invite to Radoop, click here http://radoop.eu/z1sxe)


Updated Interview Elissa Fink -VP Tableau Software

Here is an interview with Elissa Fink, VP Marketing of that new wonderful software called Tableau that makes data visualization so nice and easy to learn and work with.

Elissa Fink, VP, Marketing

Ajay-  Describe your career journey from high school to over 20 plus years in marketing. What are the various trends that you have seen come and go in marketing.

Elissa- I studied literature and linguistics in college and didn’t discover analytics until my first job selling advertising for the Wall Street Journal. Oddly enough, the study of linguistics is not that far from decision analytics: they both are about taking a structured view of information and trying to see and understand common patterns. At the Journal, I was completely captivated analyzing and comparing readership data. At the same time, the idea of using computers in marketing was becoming more common. I knew that the intersection of technology and marketing was going to radically change things – how we understand consumers, how we market and sell products, and how we engage with customers. So from that point on, I’ve always been focused on technology and marketing, whether it’s working as a marketer at technology companies or applying technology to marketing problems for other types of companies.  There have been so many interesting trends. Taking a long view, a key trend I’ve noticed is how marketers work to understand, influence and motivate consumer behavior. We’ve moved marketing from where it was primarily unpredictable, qualitative and aimed at talking to mass audiences, where the advertising agency was king. Now it’s a discipline that is more data-driven, quantitative and aimed at conversations with individuals, where the best analytics wins. As with any trend, the pendulum swings far too much to either side causing backlashes but overall, I think we are in a great place now. We are using data-driven analytics to understand consumer behavior. But pure analytics is not the be-all, end-all; good marketing has to rely on understanding human emotions, intuition and gut feel – consumers are far from rational so taking only a rational or analytical view of them will never explain everything we need to know.

Ajay- Do you think technology companies are still predominantly dominated by men . How have you seen diversity evolve over the years. What initiatives has Tableau taken for both hiring and retaining great talent.

Elissa- The thing I love about the technology industry is that its key success metrics – inventing new products that rapidly gain mass adoption in pursuit of making profit – are fairly objective. There’s little subjective nature to the counting of dollars collected selling a product and dollars spent building a product. So if a female can deliver a better product and bigger profits faster and better, then that female is going to get the resources, jobs, power and authority to do exactly that. That’s not to say that the technology industry is gender-blind, race-blind, etc. It isn’t – technology is far from perfect. For example, the industry doesn’t have enough diversity in positions of power. But I think overall, in comparison to a lot of other industries, it’s pretty darn good at giving people with great ideas the opportunities to realize their visions regardless of their backgrounds or characteristics.

At Tableau, we are very serious about bringing in and developing talented people – they are the key to our growth and success. Hiring is our #1 initiative so we’ve spent a lot of time and energy both on finding great candidates and on making Tableau a place that they want to work. This includes things like special recruiting events, employee referral programs, a flexible work environment, fun social events, and the rewards of working for a start-up. Probably our biggest advantage is the company itself – working with people you respect on amazing, cutting-edge products that delight customers and are changing the world is all too rare in the industry but a reality at Tableau. One of our senior software developers put it best when he wrote “The emphasis is on working smarter rather than longer: family and friends are why we work, not the other way around. Tableau is all about happy, energized employees executing at the highest level and delivering a highly usable, high quality, useful product to our customers.” People who want to be at a place like that should check out our openings at http://www.tableausoftware.com/jobs.

Ajay- What are most notable features in tableau’s latest edition. What are the principal software that competes with Tableau Software products and how would you say Tableau compares with them.

Elissa- Tableau 6.1 will be out in July and we are really excited about it for 3 reasons.

First, we’re introducing our mobile business intelligence capabilities. Our customers can have Tableau anywhere they need it. When someone creates an interactive dashboard or analytical application with Tableau and it’s viewed on a mobile device, an iPad in particular, the viewer will have a native, touch-optimized experience. No trying to get your fingertips to act like a mouse. And the author didn’t have to create anything special for the iPad; she just creates her analytics the usual way in Tableau. Tableau knows the dashboard is being viewed on an iPad and presents an optimized experience.

Second, we’ve take our in-memory analytics engine up yet another level. Speed and performance are faster and now people can update data incrementally rapidly. Introduced in 6.0, our data engine makes any data fast in just a few clicks. We don’t run out of memory like other applications. So if I build an incredible dashboard on my 8-gig RAM PC and you try to use it on your 2-gig RAM laptop, no problem.

And, third, we’re introducing more features for the international markets – including French and German versions of Tableau Desktop along with more international mapping options.  It’s because we are constantly innovating particularly around user experience that we can compete so well in the market despite our relatively small size. Gartner’s seminal research study about the Business Intelligence market reported a massive market shift earlier this year: for the first time, the ease-of-use of a business intelligence platform was more important than depth of functionality. In other words, functionality that lots of people can actually use is more important than having sophisticated functionality that only specialists can use. Since we focus so heavily on making easy-to-use products that help people rapidly see and understand their data, this is good news for our customers and for us.

Ajay-  Cloud computing is the next big thing with everyone having a cloud version of their software. So how would you run Cloud versions of Tableau Server (say deploying it on an Amazon Ec2  or a private cloud)

Elissa- In addition to the usual benefits espoused about Cloud computing, the thing I love best is that it makes data and information more easily accessible to more people. Easy accessibility and scalability are completely aligned with Tableau’s mission. Our free product Tableau Public and our product for commercial websites Tableau Digital are two Cloud-based products that deliver data and interactive analytics anywhere. People often talk about large business intelligence deployments as having thousands of users. With Tableau Public and Tableau Digital, we literally have millions of users. We’re serving up tens of thousands of visualizations simultaneously – talk about accessibility and scalability!  We have lots of customers connecting to databases in the Cloud and running Tableau Server in the Cloud. It’s actually not complex to set up. In fact, we focus a lot of resources on making installation and deployment easy and fast, whether it’s in the cloud, on premise or what have you. We don’t want people to have spend weeks or months on massive roll-out projects. We want it to be minutes, hours, maybe a day or 2. With the Cloud, we see that people can get started and get results faster and easier than ever before. And that’s what we’re about.

Ajay- Describe some of the latest awards that Tableau has been wining. Also how is Tableau helping universities help address the shortage of Business Intelligence and Big Data professionals.

Elissa-Tableau has been very fortunate. Lately, we’ve been acknowledged by both Gartner and IDC as the fastest growing business intelligence software vendor in the world. In addition, our customers and Tableau have won multiple distinctions including InfoWorld Technology Leadership awards, Inc 500, Deloitte Fast 500, SQL Server Magazine Editors’ Choice and Community Choice awards, Data Hero awards, CODiEs, American Business Awards among others. One area we’re very passionate about is academia, participating with professors, students and universities to help build a new generation of professionals who understand how to use data. Data analysis should not be exclusively for specialists. Everyone should be able to see and understand data, whatever their background. We come from academic roots, having been spun out of a Stanford research project. Consequently, we strongly believe in supporting universities worldwide and offer 2 academic programs. The first is Tableau For Teaching, where any professor can request free term-length licenses of Tableau for academic instruction during his or her courses. And, we offer a low-cost Student Edition of Tableau so that students can choose to use Tableau in any of their courses at any time.

Elissa Fink, VP Marketing,Tableau Software


Elissa Fink is Tableau Software’s Vice President of Marketing. With 20+ years helping companies improve their marketing operations through applied data analysis, Elissa has held executive positions in marketing, business strategy, product management, and product development. Prior to Tableau, Elissa was EVP Marketing at IXI Corporation, now owned by Equifax. She has also served in executive positions at Tele Atlas (acquired by TomTom), TopTier Software (acquired by SAP), and Nielsen/Claritas. Elissa also sold national advertising for the Wall Street Journal. She’s a frequent speaker and has spoken at conferences including the DMA, the NCDM, Location Intelligence, the AIR National Forum and others. Elissa is a graduate of Santa Clara University and holds an MBA in Marketing and Decision Systems from the University of Southern California.

Elissa first discovered Tableau late one afternoon at her previous company. Three hours later, she was still “at play” with her data. “After just a few minutes using the product, I was getting answers to questions that were taking my company’s programmers weeks to create. It was instantly obvious that Tableau was on a special mission with something unique to offer the world. I just had to be a part of it.”

To know more – read at http://www.tableausoftware.com/

and existing data viz at http://www.tableausoftware.com/learn/gallery

Storm seasons: measuring and tracking key indicators
What’s happening with local real estate prices?
How are sales opportunities shaping up?
Identify your best performing products
Applying user-defined parameters to provide context
Not all tech companies are rocket ships
What’s really driving the economy?
Considering factors and industry influencers
The complete orbit along the inside, or around a fixed circle
How early do you have to be at the airport?
What happens if sales grow but so does customer churn?
What are the trends for new retail locations?
How have student choices changed?
Do patients who disclose their HIV status recover better?
Closer look at where gas prices swing in areas of the U.S.
U.S. Census data shows more women of greater age
Where do students come from and how does it affect their grades?
Tracking customer service effectiveness
Comparing national and local test scores
What factors correlate with high overall satisfaction ratings?
Fund inflows largely outweighed outflows well after the bubble
Which programs are competing for federal stimulus dollars?
Oil prices and volatility
A classic candlestick chart
How do oil, gold and CPI relate to the GDP growth rate?