Trying out Google Prediction API from R

Ubuntu Login
Image via Wikipedia

So I saw the news at NY R Meetup and decided to have a go at Prediction API Package (which first started off as a blog post at

http://onertipaday.blogspot.com/2010/11/r-wrapper-for-google-prediction-api.html

1)My OS was Ubuntu 10.10 Netbook

Ubuntu has a slight glitch plus workaround for installing the RCurl package on which the Google Prediction API is dependent- you need to first install this Ubuntu package for RCurl to install libcurl4-gnutls-dev

Once you install that using Synaptic,

Simply start R

2) Install Packages rjson and Rcurl using install.packages and choosing CRAN

Since GooglePredictionAPI is not yet on CRAN

,

3) Download that package from

https://code.google.com/p/google-prediction-api-r-client/downloads/detail?name=googlepredictionapi_0.1.tar.gz&can=2&q=

You need to copy this downloaded package to your “first library ” folder

When you start R, simply run

.libPaths()[1]

and thats the folder you copy the GooglePredictionAPI package  you downloaded.

5) Now the following line works

  1. Under R prompt,
  2. > install.packages("googlepredictionapi_0.1.tar.gz", repos=NULL, type="source")

6) Uploading data to Google Storage using the GUI (rather than gs util)

Just go to https://sandbox.google.com/storage/

and thats the Google Storage manager

Notes on Training Data-

Use a csv file

The first column is the score column (like 1,0 or prediction score)

There are no headers- so delete headers from data file and move the dependent variable to the first column  (Note I used data from the kaggle contest for R package recommendation at

http://kaggle.com/R?viewtype=data )

6) The good stuff:

Once you type in the basic syntax, the first time it will ask for your Google Credentials (email and password)

It then starts showing you time elapsed for training.

Now you can disconnect and go off (actually I got disconnected by accident before coming back in a say 5 minutes so this is the part where I think this is what happened is why it happened, dont blame me, test it for yourself) –

and when you come back (hopefully before token expires)  you can see status of your request (see below)

> library(rjson)
> library(RCurl)
Loading required package: bitops
> library(googlepredictionapi)
> my.model <- PredictionApiTrain(data="gs://numtraindata/training_data")
The request for training has sent, now trying to check if training is completed
Training on numtraindata/training_data: time:2.09 seconds
Training on numtraindata/training_data: time:7.00 seconds

7)

Note I changed the format from the URL where my data is located- simply go to your Google Storage Manager and right click on the file name for link address  ( https://sandbox.google.com/storage/numtraindata/training_data.csv)

to gs://numtraindata/training_data  (that kind of helps in any syntax error)

8) From the kind of high level instructions at  https://code.google.com/p/google-prediction-api-r-client/, you could also try this on a local file

Usage

## Load googlepredictionapi and dependent libraries
library(rjson)
library(RCurl)
library(googlepredictionapi)

## Make a training call to the Prediction API against data in the Google Storage.
## Replace MYBUCKET and MYDATA with your data.
my.model <- PredictionApiTrain(data="gs://MYBUCKET/MYDATA")

## Alternatively, make a training call against training data stored locally as a CSV file.
## Replace MYPATH and MYFILE with your data.
my.model <- PredictionApiTrain(data="MYPATH/MYFILE.csv")

At the time of writing my data was still getting trained, so I will keep you posted on what happens.

How to Analyze Wikileaks Data – R SPARQL

Logo for R
Image via Wikipedia

Drew Conway- one of the very very few Project R voices I used to respect until recently. declared on his blog http://www.drewconway.com/zia/

Why I Will Not Analyze The New WikiLeaks Data

and followed it up with how HE analyzed the post announcing the non-analysis.

“If you have not visited the site in a week or so you will have missed my previous post on analyzing WikiLeaks data, which from the traffic and 35 Comments and 255 Reactions was at least somewhat controversial. Given this rare spotlight I thought it would be fun to use the infochimps API to map out the geo-location of everyone that visited the blog post over the last few days. Unfortunately, after nearly two years with the same web hosting service, only today did I realize that I was not capturing daily log files for my domain”

Anyways – non American users of R Project can analyze the Wikileaks data using the R SPARQL package I would advise American friends not to use this approach or attempt to analyze any data because technically the data is still classified and it’s possession is illegal (which is the reason Federal employees and organizations receiving federal funds have advised not to use this or any WikiLeaks dataset)

https://code.google.com/p/r-sparql/

Overview

R is a programming language designed for statistics.

R Sparql allows you to run SPARQL Queries inside R and store it as a R data frame.

The main objective is to allow the integration of Ontologies with Statistics.

It requires Java and rJava installed.

Example (in R console):

> library(sparql)> data <- query("SPARQL query>","RDF file or remote SPARQL Endpoint")

and the data in a remote SPARQL  http://www.ckan.net/package/cablegate

SPARQL is an easy language to pick  up, but dammit I am not supposed to blog on my vacations.

http://code.google.com/p/r-sparql/wiki/GettingStarted

Getting Started

1. Installation

1.1 Make sure Java is installed and is the default JVM:

$ sudo apt-get install sun-java6-bin sun-java6-jre sun-java6-jdk$ sudo update-java-alternatives -s java-6-sun

1.2 Configure R to use the correct version of Java

$ sudo R CMD javareconf

1.3 Install the rJava library

$ R> install.packages("rJava")> q()

1.4 Download and install the sparql library

Download: http://code.google.com/p/r-sparql/downloads/list

$ R CMD INSTALL sparql-0.1-X.tar.gz

2. Executing a SPARQL query

2.1 Start R

#Load the librarylibrary(sparql)#Run the queryresult <- query("SELECT ... ", "http://...")#Print the resultprint(result)

3. Examples

3.1 The Query can be a string or a local file:

query("SELECT ?date ?number ?season WHERE {  ... }", "local-file.rdf")
query("my-query.rq", "local-file.rdf")

The package will detect if my-query.rq exists and will load it from the file.

3.3 The uri can be a file or an url (for remote queries):

query("SELECT ... ","local-file.db")
query("SELECT ... ","http://dbpedia.org/sparql")

3.4 Get some examples here: http://code.google.com/p/r-sparql/downloads/list

SPARQL Tutorial-

http://openjena.org/ARQ/Tutorial/index.html

Also read-

http://webr3.org/blog/linked-data/virtuoso-6-sparqlgeo-and-linked-data/

and from the favorite blog of Project R- Also known as NY Times

http://bits.blogs.nytimes.com/2010/11/15/sorting-through-the-government-data-explosion/?twt=nytimesbits

In May 2009, the Obama administration started putting raw 
government data on the Web. 
It started with 47 data sets. Today, there are more than
 270,000 government data sets, spanning every imaginable 
category from public health to foreign aid.

An Introduction to Data Mining-online book

I was reading David Smith’s blog http://blog.revolutionanalytics.com/

where he mentioned this interview of Norman Nie, at TDWI

http://tdwi.org/Articles/2010/11/17/R-101.aspx?Page=2

where I saw this link (its great if you want to study Data Mining btw)

http://www.kdnuggets.com/education/usa-canada.html

and I c/liked the U Toronto link

http://chem-eng.utoronto.ca/~datamining/

Best of All- I really liked this online book created by Professor S. Sayad

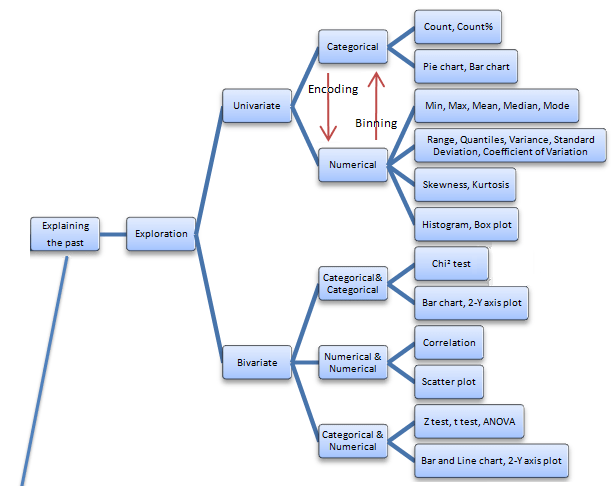
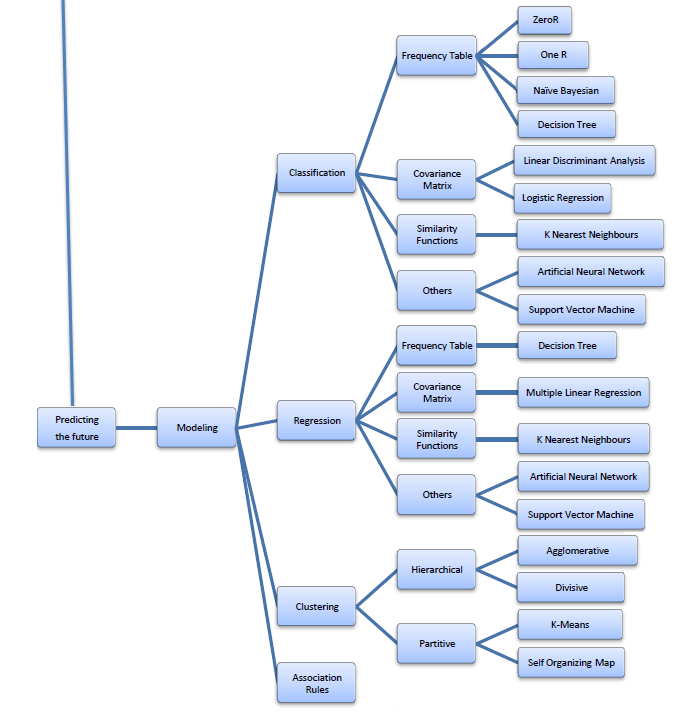
Its succinct and beautiful and describes all of the Data Mining you want to read in one Map (actually 4 images painstakingly assembled with perfection)

The best thing is- in the original map- even the sub items are click-able for specifics like Pie Chart and Stacked Column chart are not in one simple drop down like Charts- but rather by nature of the kind of variables that lead to these charts. For doing that- you would need to go to the site itself- ( see http://chem-eng.utoronto.ca/~datamining/dmc/categorical_variables.htm

vs

http://chem-eng.utoronto.ca/~datamining/dmc/categorical_numerical.htm

Again- there is no mention of the data visualization software used to create the images but I think I can take a hint from the Software Page which says software used are-

Software

See it on your own-online book (c)Professor S. Sayad

Really good DIY tutorial

http://chem-eng.utoronto.ca/~datamining/dmc/data_mining_map.htm

RWui :Creating R Web Interfaces on the go

Here is a great R application created by http://sysbio.mrc-bsu.cam.ac.uk

R Wui for creating R Web Interfaces

its been there for some time now- but presumably R Apache is more well known.

From-

http://sysbio.mrc-bsu.cam.ac.uk/Rwui/tutorial/Rwui_Rnews_final.pdf

The web application Rwui is used to create web interfaces  for running R scripts. All the code is generated automatically so that a fully functional web interface for an R script can be downloaded and up and running in a matter of minutes.

Rwui is aimed at R script writers who have scripts that they want people unversed in R to use. The script writer uses Rwui to create a web application that will run their R script. Rwui allows the script writer to do this without them having to do any web application programming, because Rwui generates all the code for them.

The script writer designs the web application to run their R script by entering information on a sequence of web pages. The script writer then downloads the application they have created and installs it on their own server.

http://sysbio.mrc-bsu.cam.ac.uk/Rwui/tutorial/Technical_Report.pdf

Features of web applications created by Rwui

  1. Whole range of input items available if required – text boxes, checkboxes, file upload etc.
  2. Facility for uploading of an arbitrary number of files (for example, microarray replicates).
  3. Facility for grouping uploaded files (for example, into ‘Diseased’ and ‘Control’ microarray data files).
  4. Results files displayed on results page and available for download.
  5. Results files can be e-mailed to the user.
  6. Interactive results files using image maps.
  7. Repeat analyses with different parameters and data files – new results added to results list, as a link to the corresponding results page.
  8. Real time progress information (text or graphical) displayed when running the application.

Requirements

In order to use the completed web applications created by Rwui you will need:

  1. A Java webserver such as Tomcat version 5.5 or later.
  2. Java version 1.5
  3. R – a version compatible with your R script(s).

Using Rwui

Using Rwui to create a web application for an R script simply involves:

  1. Entering details about your Rscript on a sequence of web pages.
  2. Rwui is quite flexible so you can backtrack, edit and insert, as you design your application.
  3. Rwui then generates the web application, which is Java based and platform independent.
  4. The application can be downloaded either as a .zip or .tgz file.
  5. Unpacked, the download contains all the source code and a .war file.
  6. Once the .war file is copied to the Tomcat webapps directory, the application is ready to use.
  7. Application details are saved in an ‘application definition file’ for reuse and modification.
Interested-
go click and check out a new web app from http://sysbio.mrc-bsu.cam.ac.uk/Rwui/ in a matter of minutes
Also see

American Decline- Why outsourcing doesnt make sense

Bureau of Labor Statistics logo RGB colors.
Image via Wikipedia

Here is a celebrated graphic from an American journalist using U.S. Department of Labor’s Bureau of Labor Statistics. It is a good example of using time as a dimension for animation- and heat maps for geography enabled visualizations.

————————–According to the U.S. Department of Labor’s Bureau of Labor Statistics, there are nearly 31 million people currently unemployed — that’s including those involuntarily working part time and those who want a job, but have given up on trying to find one. In the face of the worst economic upheaval since the Great Depression, millions of Americans are hurting. “The Decline: The Geography of a Recession,” as created by labor writer LaToya Egwuekwe, serves as a vivid representation of just how much. Watch the deteriorating transformation of the U.S. economy from January 2007 — approximately one year before the start of the recession — to the most recent unemployment data available today. Original link: http://www.latoyaegwuekwe.com/geographyofarecession.html. For more information, email latoya.egwuekwe@yahoo.com

————————————————————————————-


31 million unemployed- Does a US corporation seriously think that it can build everything OUTSIDE America and SELL INSIDE America. or who think it is okay intellectual property continues to be stolen as long as labor is cheap.

Shame on you if you outsourced your neighbour’s jobs- or would rather hire in a geography where they steal your intellectual property.


This Christmastime – May the Ghost of  the Unemployed Family Christmases visit you in your sleep instead.

Gartner BI and Inf Mgmt Summit 2011- 30 min One on Ones

From the land Down Under, where Gartner gathers business summit thunder.

http://www.gartner.com/technology/summits/apac/business-intelligence/index.jsp

Gartner Business Intelligence
& Information Management Summit 2011

February 22 – 23 • Sydney, AUSTRALIA
gartner.com/ap/bi

Register Now

From Information to Intelligence:

Evaluate, Execute and Evolve

At Gartner Business Intelligence & Information Management Summit 2011 you will experience a unique mix of Gartner research presentations, guest keynote addresses, real-life case studies and interactive panel discussions to provide you with a holistic view of the business intelligence and performance management landscape. Information, insight and advice are channeled through an increasingly targeted and focused approach, taking you from the high-level strategic view all the way to your specific issue.

Click here to view the full agenda or download the brochure.

AGENDA HIGHLIGHTS

teamsend


Guest Keynote Address

Future Thinking – Global Trends and Thinking that are Upending your Business

Anders Sorman-Nilsson
Creative Director, Thinque

Click here to read more about this session.

Best Practice Workshops:

  • How to Become an Effective Data Warehouse Modeler
  • Analytics – Business Intelligence and Performance Management ITScore

Analyst User Roundtables:

  • Enterprise Information Management – Focusing on What Matters to the Business
  • Sharepoint – thin edge of the wedge to the MS family
  • Preparing for the 2020 workplace

Worldwide Expertise at Your Fingertips!
Your questions on Business Intelligence and Performance Management answered. Meet the Gartner Analysts presenting at the Summit and book your exclusive 30 minute one-on-one ( lap top dance) with the Analysts of your choice.

AsterData partners with Tableau

This chart represents several constituent comp...
Image via Wikipedia

Tableau which has been making waves recntly with its great new data visualization tool announced a partner with my old friends at AsterData. Its really cool piece of data vis and very very fast on the desktop- so I can imagine what speed it can help with AsterData’s MPP Row and Column Zingbang AND Parallel Analytical Functions

Tableau and AsterData also share the common Stanfordian connection (but it seems software is divided quite equally between Stanford, Hardvard Dropouts and North Carolina )

It remains to be seen in this announcement how much each company  can leverage the partnership or whether it turns like the SAS Institute- AsterData partnership last year or whether it is just to announce connectors in their software to talk to each other.

See a Tableau vis at

http://public.tableausoftware.com/views/geographyofdiabetes/Dashboard2?:embed=yes&:toolbar=yes

AsterData remains the guys with the potential but I would be wrong to say MapReduceSQL is as hot in December 2010 as it was in June 2009- and the elephant in the room would be Hadoop. That and Google’s continued shyness from encashing its principal comptency of handling Big Data (but hush – I signed a NDA with the Google Prediction API– so things maaaay change very rapidly on ahem that cloud)

Disclaimer- AsterData was my internship sponsor during my winter training while at Univ of  Tenn.