Based on
For a better zoom level go to
Also read-
http://analytics.blogspot.com/2011/10/introducing-flow-visualization.html

Based on
For a better zoom level go to
Also read-
http://analytics.blogspot.com/2011/10/introducing-flow-visualization.html
I use Windows 7 on my laptop (it came pre-installed) and Ubuntu using the VMWare Player. What are the advantages of using VM Player instead of creating a dual-boot system? Well I can quickly shift from Ubuntu to Windows and bakc again without restarting my computer everytime. Using this approach allows me to utilize software that run only on Windows and run software like Rattle, the R data mining GUI, that are much easier installed on Linux.
However if your statistical software is on your Virtual Disk , and your data is on your Windows disk, you need a way to move data from Windows to Ubuntu.
The solution to this as per Ubuntu forums is –http://communities.vmware.com/thread/55242
Open My Computer, browse to the folder you want to share. Right-click on the folder, select Properties. Sharing tab. Select the radio button to “Share this Folder”. Change the default generated name if you wish; add a description if you wish. Click the Permissions button to modify the security settings of what users can read/write to the share.
On the Linux side, it depends on the distro, the shell, and the window manager.
Well Ubuntu makes it really easy to configure the Linux steps to move data within Windows and Linux partitions.
NEW UPDATE-
VMmare makes it easy to share between your Windows (host) and Linux (guest) OS
Step 1

and step 2

Do this
and
Start the Wizard

when you finish the wizard and share a drive or folder- hey where do I see my shared ones-
see this folder in Linux- /mnt/hgfs (bingo!)

Hacker HW – Make this folder //mnt/hgfs a shortcut in Places your Ubuntu startup
Hacker Hw 2-
Upload using an anon email your VM dark data to Ubuntu one
Delete VM
Purge using software XX
Reinstall VM and bring back backup
Note time to do this
-General Sharing in Windows

Just open the Network tab in Ubuntu- see screenshots below-

Windows will now ask your Ubuntu user for login-
Once Logged in Windows from within Ubuntu Vmware, this is what happens
You see a tab called “users on “windows username”- pc appear on your Ubuntu Desktop (see top right of the screenshot)
If you double click it- you see your windows path
You can now just click and drag data between your windows and linux partitions , just the way you do it in Windows .
So based on this- if you want to build decision trees, artifical neural networks, regression models, and even time series models for zero capital expenditure- you can use both Ubuntu/R without compromising on your IT policy of Windows only in your organization (there is a shortage of Ubuntu trained IT administrators in the enterprise world)
Revised Installation Procedure for utilizing both Ubuntu /R/Rattle data mining on your Windows PC.
Using VMWare to build a free data mining system in R, as well as isolate your analytics system (thus using both Linux and Windows without overburdening your machine)
First Time
- http://downloads.vmware.com/d/info/desktop_end_user_computing/vmware_player/4_0Download and Install
- http://www.ubuntu.com/download/ubuntu/downloadDownload Only
- Create New Virtual Image in VM Ware Player
- Applications—–Terminal——sudo apt get-install R (to download and install)
- sudo R (to open R)
- Once R is opened type this —-install.packages(rattle)—– This will install rattle
- library(rattle) will load Rattle—–
- rattle() will open the GUI—-
Getting Data from Host to Guest VMNext Time
- Go to VM Player
- Open the VM
- sudo R in terminal to bring up R
- library(rattle) within R
- rattle()
At this point even if you dont know any Linux and dont know any R, you can create data mining models using the Rattle GUI (and time series model using E pack in the R Commander GUI) – What can Rattle do in data mining? See this slideshow-http://www.decisionstats.com/data-mining-with-r-gui-rattle-rstats/If Google Docs is banned as per your enterprise organizational IT policy of having Windows Explorer only- well you can see these screenshots http://rattle.togaware.com/rattle-screenshots.html
Why is RATTLE my favorite R package?
because it allows data mining in a very nice interface.
Complicated software need not have complicated interfaces.
Have a look-
(Note- download rattle from http://rattle.togaware.com)
For better visibility please click the full screen button or click the second pps below- automatically advances every 5 secs
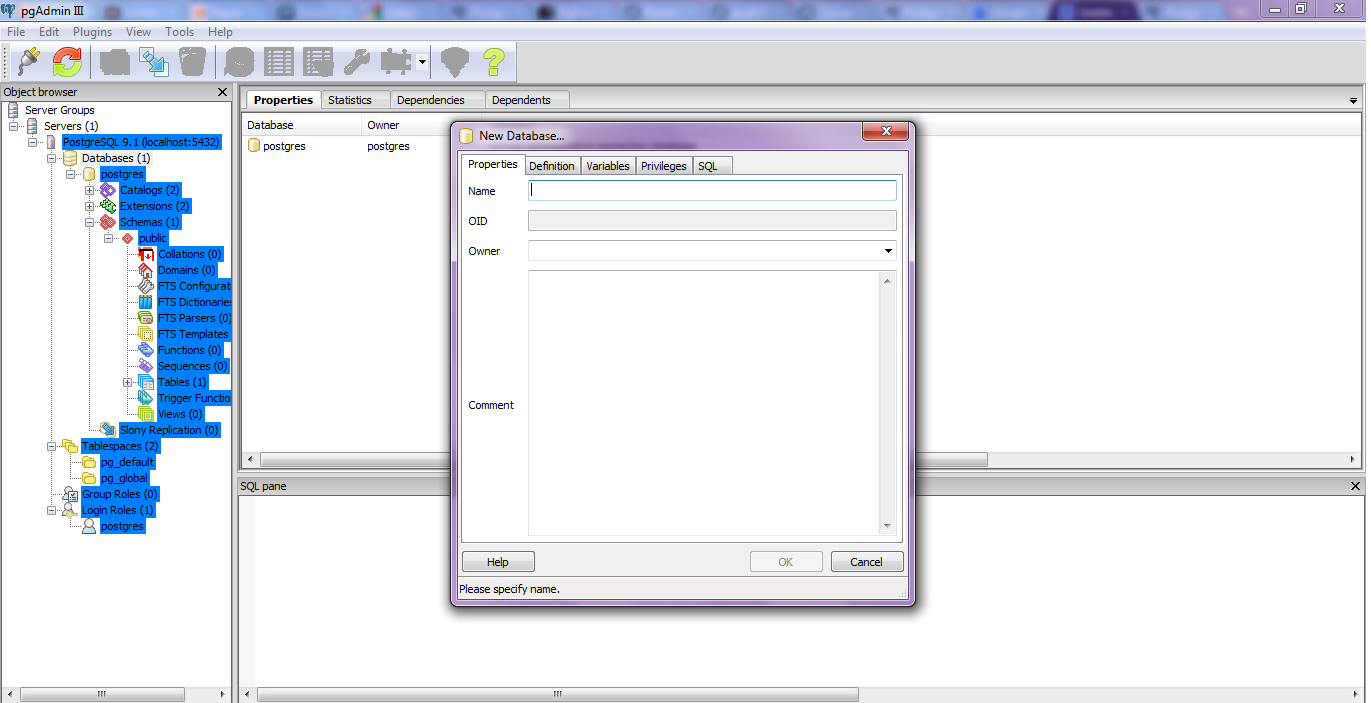
Here is a small brief primer for beginners on configuring an open source database and using an open source analytics package.
All you need to know – is to read!
Remember to store /memorize the password for the user postgres!
Create a connection using pgAdmin feature in Start Menu
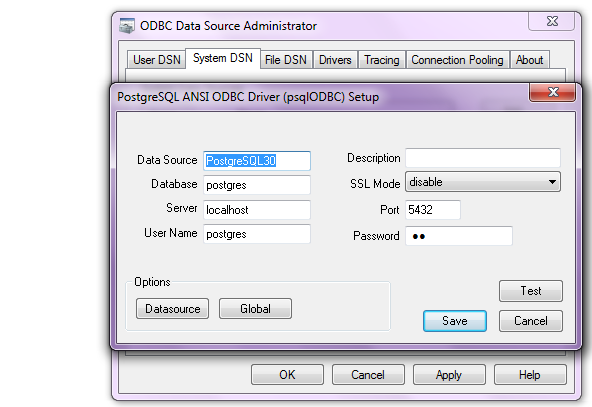
2. download ODBC driver from
http://www.postgresql.org/ftp/odbc/versions/msi/
and the Win 64 edition from
http://wwwmaster.postgresql.org/download/mirrors-ftp/odbc/versions/msi/psqlodbc_09_00_0310-x64.zip
install ODBC driver
3. Go to
Start Menu\Control Panel\All Control Panel Items\Administrative Tools\Data Sources (ODBC)
4. Configure the following details in System DSN and User DSN using the ADD tabs .Test connection to check if connection is working
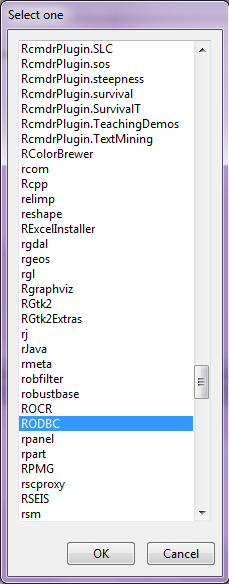
5. Start R and install and load library RODBC
6. Use following initial code for R- if you know SQL you can do the rest
> library(RODBC)
> odbcDataSources(type = c(“all”, “user”, “system”))
SQLServer PostgreSQL30 PostgreSQL35W
“SQL Server” “PostgreSQL ANSI(x64)” “PostgreSQL Unicode(x64)”
> ajay=odbcConnect(“PostgreSQL30”, uid = “postgres”, pwd = “XX”)
> sqlTables(ajay)
TABLE_QUALIFIER TABLE_OWNER TABLE_NAME TABLE_TYPE REMARKS
1 postgres public names TABLE
> crimedat <- sqlFetch(ajay, “names”)
While Six Sigma was initially a quality control system, it has also been very succesful in managing projects. The various stages of an analytical project can be divided using the DMAIC methodology.
DMAIC stands for
Related to this is DMADV, ( “Design For Six Sigma”)
2) CRISP
CRISP-DM stands for Cross Industry Standard Process for Data Mining
CRISP-DM breaks the process of data mining into six major phases- and these can be used for business analytics projects as well.
3) SEMMA
SEMMA stands for
4) ISO 9001
ISO 9001 is a certification as well as a philosophy for making a Quality Management System to measure , reduce and eliminate error and customer complaints. Any customer complaint or followup has to be treated as an error, logged, and investigated for control.
5) LEAN
LEAN is a philosophy to eliminate Wastage in a process. Applying LEAN principles to analytics projects helps a lot in eliminating project bottlenecks, technology compatibility issues and data quality resolution. I think LEAN would be great in data quality issues, and IT infrastructure design because that is where the maximum waste is observed in analytics projects.
6) Demings Plan Do Check Act cycle.
I am spending some time and some money on two games on Google Plus. One is Crime City at https://plus.google.com/games/865772480172 which I talk about in this post
http://www.decisionstats.com/google-plus-games-crime-city-or-fun-with-funzio-on-g/
and Global Warfare https://plus.google.com/games/216622099218 (which is similar to Evony of the bad ads fame, and I will write on that in another post)
But the total number of games at Google Plus is increasingly and quietly getting better. It seems there is a distinct preference for existing blockbuster games , from both Zynga and non Zynga sources Even though Google is an investor in Zynga, it clearly wants Google plus to avoid being so dependent on Zynga as Facebook clearly is. Continue reading “Games on Google Plus get- Faster, Higher, Stronger”
From the press release, Oracle gets on R and me too- NoSQL
http://www.oracle.com/us/corporate/press/512001
The Oracle Big Data Appliance is a new engineered system that includes an open source distribution of Apache™ Hadoop™, Oracle NoSQL Database, Oracle Data Integrator Application Adapter for Hadoop, Oracle Loader for Hadoop, and an open source distribution of R.
From
http://www.theregister.co.uk/2011/10/03/oracle_big_data_appliance/
the Big Data Appliance also includes the R programming language, a popular open source statistical-analysis tool. This R engine will integrate with 11g R2, so presumably if you want to do statistical analysis on unstructured data stored in and chewed by Hadoop, you will have to move it to Oracle after the chewing has subsided.
This approach to R-Hadoop integration is different from that announced last week between Revolution Analytics, the so-called Red Hat for stats that is extending and commercializing the R language and its engine, and Cloudera, which sells a commercial Hadoop setup called CDH3 and which was one of the early companies to offer support for Hadoop. Both Revolution Analytics and Cloudera now have Oracle as their competitor, which was no doubt no surprise to either.
In any event, the way they do it, the R engine is put on each node in the Hadoop cluster, and those R engines just see the Hadoop data as a native format that they can do analysis on individually. As statisticians do analyses on data sets, the summary data from all the nodes in the Hadoop cluster is sent back to their R workstations; they have no idea that they are using MapReduce on unstructured data.
Oracle did not supply configuration and pricing information for the Big Data Appliance, and also did not say when it would be for sale or shipping to customers
From
http://www.oracle.com/us/corporate/features/feature-oracle-nosql-database-505146.html
A Horizontally Scaled, Key-Value Database for the Enterprise
Oracle NoSQL Database is a commercial grade, general-purpose NoSQL database using a key/value paradigm. It allows you to manage massive quantities of data, cope with changing data formats, and submit simple queries. Complex queries are supported using Hadoop or Oracle Database operating upon Oracle NoSQL Database data.
Oracle NoSQL Database delivers scalable throughput with bounded latency, easy administration, and a simple programming model. It scales horizontally to hundreds of nodes with high availability and transparent load balancing. Customers might choose Oracle NoSQL Database to support Web applications, acquire sensor data, scale authentication services, or support online serves and social media.
and
from
http://siliconangle.com/blog/2011/09/30/oracle-adopting-open-source-r-to-connect-legacy-systems/
Oracle says it will integrate R with its Oracle Database. Other signs from Oracle show the deeper interest in using the statistical framework for integration with Hadoop to potentially speed statistical analysis. This has particular value with analyzing vast amounts of unstructured data, which has overwhelmed organizations, especially over the past year.
and
from
http://www.oracle.com/us/corporate/features/features-oracle-r-enterprise-498732.html
Oracle R Enterprise
|