Jim Goodnight on Open Source- and why he is right -sigh

Logo Open Source Initiative
Image via Wikipedia

Jim Goodnight – grand old man and Godfather of the Cosa Nostra of the BI/Database Analytics software industry said recently on open source in BI (btw R is generally termed in business analytics and NOT business intelligence software so these remarks were more apt to Pentaho and Jaspersoft )

Asked whether open source BI and data integration software from the likes of Jaspersoft, Pentaho and Talend is a growing threat, [Goodnight] said: “We haven’t noticed that a lot. Most of our companies need industrial strength software that has been tested, put through every possible scenario or failure to make sure everything works correctly.”

quotes from Jim Goodnight are courtesy Jason’s  story here:
http://www.cbronline.com/news/sas-ceo-says-cep-open-source-and-cloud-bi-have-limited-appeal

and the Pentaho follow-up reaction is here

http://bi.cbronline.com/news/pentaho-fires-back-across-sas-bows-over-limited-open-source-appeal


While you can rage and screech- here is the reality in terms of market share-

From Merv Adrian-‘s excellent article on market shares in BI

http://www.enterpriseirregulars.com/22444/decoding-bi-market-share-numbers-%E2%80%93-play-sudoku-with-analysts/

The first, labeled BI Platforms, is drawn fromGartner Market Share Analysis: Business Intelligence, Analytics and Performance Management Software, Worldwide, 2009, published May 2010 , and Gartner Dataquest Market Share: Business Intelligence, Analytics and Performance Management Software, Worldwide, 2009.

and

Advanced Analytics category.

and 

so whats the performance of Talend, Pentaho and Jaspersoft

From http://www.dbms2.com/category/products-and-vendors/talend/

It seems that Talend’s revenue was somewhat shy of $10 million in 2008.

and Talend itself says

http://www.talend.com/press/Talend-Announces-Record-2009-and-Continues-Growth-in-the-New-Year.php

Additional 2009 highlights include:

  • Achieved record revenue, more then doubling from 2008. The fourth quarter of 2009 was Talend’s tenth consecutive quarter of growth.
  • Grew customer base by 140% to over 1,000 customers, up from 420 at the end of 2008. Of these new customers, over 50% are Fortune 1000 companies.
  • Total downloads reached seven million, with over 300,000 users of the open source products.
  • Talend doubled its staff, increasing to 200 global employees. Continuing this trend, Talend has already hired 15 people in 2010 to support its rapid growth.

now for Jaspersoft numbers

http://www.dbms2.com/2008/09/14/jaspersoft-numbers/

Highlights include:

  • Revenue run rate in the double-digit millions.
  • 40% sequential growth most recent quarter. (I didn’t ask whether there was any reason to suspect seasonality.)
  • 130% annual revenue growth run rate.
  • “Not quite” profitable.
  • Several hundred commercial subscribers, at an average of $25K annually per, including >100 in Europe.
  • 9,000 paying customers of some kind.
  • 100,000+ total deployments, “very conservatively,” counting OEMs as one deployment each and not double-counting for OEMs’ customers. (Nick said Business Objects quotes 45,000 deployments by the same standards.)
  • 70% of revenue from the mid-market, defined as $100 million – $1 billion revenue. 30% from bigger enterprises. (Hmm. That begs a couple of questions, such as where OEM revenue comes in, and whether <$100 million enterprises were truly a negligible part of revenue.)

and for Pentaho numbers-

http://www.dbms2.com/2009/01/27/introduction-to-pentaho/

and http://www.monash.com/uploads/Pentaho-January-2009.pdf

suggests there are far far away from the top 5-6 vendors in BI

and a special mention  for postgreSQL– which is a non Profit but is seriously denting Oracle/MySQL

http://www.postgresql.org/about/

Limit Value
Maximum Database Size Unlimited
Maximum Table Size 32 TB
Maximum Row Size 1.6 TB
Maximum Field Size 1 GB
Maximum Rows per Table Unlimited
Maximum Columns per Table 250 – 1600 depending on column types
Maximum Indexes per Table Unlimited

and leading vendor is EnterpriseDB which is again IBM-partnering as well as IBM funded

http://www.sramanamitra.com/2009/05/18/enterprise-db/

and

http://www.enterprisedb.com/company/news_events/press_releases/2010_21.do

suggest it is still in early stages.

————————————————————–

So what do we conclude-

1) There is a complete lack of transparency in open source BI market shares as almost all these companies are privately held and do not disclose revenues.

2) What may be a pure play open source company may actually be a company funded by a big BI vendor (like Revolution Analytics is funded among others by Intel-Microsoft) and EnterpriseDB has IBM as an investor.MySQL and Sun of course are bought by Oracle

The degree of control by proprietary vendors on open source vendors is still not disclosed- whether they are holding a stake for strategic reasons or otherwise.

3) None of the Open Source Vendors are even close to a 1 Billion dollar revenue number.

Jim Goodnight is pointing out market reality when he says he has not seen much impact (in terms of market share). As for the rest of his remarks, well he’s got a job to do as CEO and thats talk up his company and trash the competition- which he as been doing for 3 decades and unlikely to change now unless there is severe market share impact. Unless you expect him to notice companies less than 5% of his size in revenue.

http://www.cbronline.com/news/sas-ceo-says-cep-open-source-and-cloud-bi-have-limited-appeal

http://bi.cbronline.com/news/pentaho-fires-back-across-sas-bows-over-limited-open-source-appeal


JMP Genomics 5 released

Animation of the structure of a section of DNA...
Image via Wikipedia

Close to the launch of JMP9 with it’s R integration comes the announcement of JMP Genomics 5 released. The product brief is available here http://jmp.com/software/genomics/pdf/103112_jmpg5_prodbrief.pdf and it has an interesting mix of features. If you want to try out the features you can see http://jmp.com/software/license.shtml

As per me, I snagged some “new”stuff in this release-

  • Perform enrichment analysis using functional information from Ingenuity Pathways Analysis.+
  • New bar chart track allows summarization of reads or intensities.
  • New color map track displays heat plots of information for individual subjects.
  • Use a variety of continuous measures for summarization.
  • Using a common identifier, compare list membership for up tofive groups and display overlaps with Venn diagrams.
  • Filter or shade segments by mean intensity, with an optionto display segment mean intensity and set a reference valuefor shading.
  • Adjust intensities or counts for experimental samples using paired or grouped control samples.
  • Screen paired DNA and RNA intensities for allele-specific expression.
  • Standardize using a shifting factor and perform log2transformation after standardization.
  • Use kernel density information in loess and quantile normalization.
  • Depict partition tree information graphically for standard models with new Tree Viewer
  • Predictive modeling for survival analysis with Harrell’s assessment method and integration with Cross-Validation Model Comparison.

That’s right- that is incorporating the work of our favorite professor from R Project himself- http://biostat.mc.vanderbilt.edu/wiki/Main/FrankHarrell

Apparently Prof Frank E was quite a SAS coder himself (see http://biostat.mc.vanderbilt.edu/wiki/Main/SasMacros)

Back to JMP Genomics 5-

The JMP software platform provides:

• New integration capabilities let R users leverage JMP’s interactivegraphics to display analytic results.

• Tools for R programmers to build and package user interfaces that let them share customized R analytics with a broader audience.•

A new add-in infrastructure that simplifies the integration of external analytics into JMP.


+ For people in life sciences who like new stats software you can also download a trial version of IPA here at http://www.ingenuity.com/products/IPA/Free-Trial-Software.html

Interesting R competition at Reddit

Image representing Reddit as depicted in Crunc...
Image via CrunchBase

Here is an interesting R competition going on at Reddit and it is to help Reddit make a recommendation engine 🙂

http://www.reddit.com/r/redditdev/comments/dtg4j/want_to_help_reddit_build_a_recommender_a_public/

by ketralnis

As promised, here is the big dump of voting information that you guys donated to research. Warning: this contains much geekery that may result in discomfort for the nerd-challenged.

I’m trying to use it to build a recommender, and I’ve got some preliminary source code. I’m looking for feedback on all of these steps, since I’m not experienced at machine learning.

Here’s what I’ve done

  • I dumped all of the raw data that we’ll need to generate the public dumps. The queries are the comments in the two .pig files and it took about 52 minutes to do the dump against production. The result of this raw dump looks like:
    $ wc -l *.dump
     13,830,070 reddit_data_link.dump
    136,650,300 reddit_linkvote.dump
         69,489 reddit_research_ids.dump
     13,831,374 reddit_thing_link.dump
    
  • I filtered the list of votes for the list of users that gave us permission to use their data. For the curious, that’s 67,059 users: 62,763 with “public votes” and 6,726 with “allow my data to be used for research”. I’d really like to see that second category significantly increased, and hopefully this project will be what does it. This filtering is done by srrecs_researchers.pig and took 83m55.335s on my laptop.
  • I converted data-dumps that were in our DB schema format to a more useable format using srrecs.pig(about 13min)
  • From that dump I mapped all of the account_ids, link_ids, and sr_ids to salted hashes (using obscure() insrrecs.py with a random seed, so even I don’t know it). This took about 13min on my laptop. The result of this, votes.dump is the file that is actually public. It is a tab-separated file consisting in:
    account_id,link_id,sr_id,dir
    

    There are 23,091,688 votes from 43,976 users over 3,436,063 links in 11,675 reddits. (Interestingly these ~44k users represent almost 17% of our total votes). The dump is 2.2gb uncompressed, 375mb in bz2.

What to do with it

The recommendations system that I’m trying right now turns those votes into a set of affinities. That is, “67% of user #223’s votes on /r/reddit.com are upvotes and 52% on programming). To make these affinities (55m45.107s on my laptop):

 cat votes.dump | ./srrecs.py "affinities_m()" | sort -S200m | ./srrecs.py "affinities_r()" > affinities.dump

Then I turn the affinities into a sparse matrix representing N-dimensional co-ordinates in the vector space of affinities (scaled to -1..1 instead of 0..1), in the format used by R’s skmeans package (less than a minute on my laptop). Imagine that this matrix looks like

          reddit.com pics       programming horseporn  bacon
          ---------- ---------- ----------- ---------  -----
ketralnis -0.5       (no votes) +0.45       (no votes) +1.0
jedberg   (no votes) -0.25      +0.95       +1.0       -1.0
raldi     +0.75      +0.75      +0.7        (no votes) +1.0
...

We build it like:

# they were already grouped by account_id, so we don't have to
# sort. changes to the previous step will probably require this
# step to have to sort the affinities first
cat affinities.dump | ./srrecs.py "write_matrix('affinities.cm', 'affinities.clabel', 'affinities.rlabel')"

I pass that through an R program srrecs.r (if you don’t have R installed, you’ll need to install that, and the packageskmeans like install.packages('skmeans')). This program plots the users in this vector space finding clusters using a sperical kmeans clustering algorithm (on my laptop, takes about 10 minutes with 15 clusters and 16 minutes with 50 clusters, during which R sits at about 220mb of RAM)

# looks for the files created by write_matrix in the current directory
R -f ./srrecs.r

The output of the program is a generated list of cluster-IDs, corresponding in order to the order of user-IDs inaffinities.clabel. The numbers themselves are meaningless, but people in the same cluster ID have been clustered together.

Here are the files

These are torrents of bzip2-compressed files. If you can’t use the torrents for some reason it’s pretty trivial to figure out from the URL how to get to the files directly on S3, but please try the torrents first since it saves us a few bucks. It’s S3 seeding the torrents anyway, so it’s unlikely that direct-downloading is going to go any faster or be any easier.

  • votes.dump.bz2 — A tab-separated list of:
    account_id, link_id, sr_id, direction
    
  • For your convenience, a tab-separated list of votes already reduced to percent-affinities affinities.dump.bz2, formatted:
    account_id, sr_id, affinity (scaled 0..1)
    
  • For your convenience, affinities-matrix.tar.bz2 contains the R CLUTO format matrix files affinities.cm,affinities.clabelaffinities.rlabel

And the code

  • srrecs.pigsrrecs_researchers.pig — what I used to generate and format the dumps (you probably won’t need this)
  • mr_tools.pysrrecs.py — what I used to salt/hash the user information and generate the R CLUTO-format matrix files (you probably won’t need this unless you want different information in the matrix)
  • srrecs.r — the R-code to generate the clusters

Here’s what you can experiment with

  • The code isn’t nearly useable yet. We need to turn the generated clusters into an actual set of recommendations per cluster, preferably ordered by predicted match. We probably need to do some additional post-processing per user, too. (If they gave us an affinity of 0% to /r/askreddit, we shouldn’t recommend it, even if we predicted that the rest of their cluster would like it.)
  • We need a test suite to gauge the accuracy of the results of different approaches. This could be done by dividing the data-set in and using 80% for training and 20% to see if the predictions made by that 80% match.
  • We need to get the whole process to less than two hours, because that’s how often I want to run the recommender. It’s okay to use two or three machines to accomplish that and a lot of the steps can be done in parallel. That said we might just have to accept running it less often. It needs to run end-to-end with no user-intervention, failing gracefully on error
  • It would be handy to be able to idenfity the cluster of just a single user on-the-fly after generating the clusters in bulk
  • The results need to be hooked into the reddit UI. If you’re willing to dive into the codebase, this one will be important as soon as the rest of the process is working and has a lot of room for creativity
  • We need to find the sweet spot for the number of clusters to use. Put another way, how many different types of redditors do you think there are? This could best be done using the aforementioned test-suite and a good-old-fashioned binary search.

Some notes:

  • I’m not attached to doing this in R (I don’t even know much R, it just has a handy prebaked skmeans implementation). In fact I’m not attached to my methods here at all, I just want a good end-result.
  • This is my weekend fun project, so it’s likely to move very slowly if we don’t pick up enough participation here
  • The final version will run against the whole dataset, not just the public one. So even though I can’t release the whole dataset for privacy reasons, I can run your code and a test-suite against it

——————————————————————————————-


I am thinking of using Rattle and using the arules package, and running it on the EC2 to get the horsepower.

How else do you think you can tackle a recommendation engine problem.


Ajay


Bringing Poetry to Life

Here is a new poetry book.

———————————————————————————————–

I’m excited to let you know about Carol Calkins who is releasing her first book of poetry entitled Bring Poetry to Life. This book is a powerful compilation of poetry touching on the most important moments in our everyday lives from new beginnings, to special people and events, to endings and saying goodbye.  Carol who found her life purpose through poetry is excited to release the first of a series of poetry books on Amazon. Grab your copy of Bring Poetry to Life today on Amazon.com – Find out more about Carol and her new book at http://www.bringpoetrytolife.com

We Said Goodbye a Thousand Times


Don’t be sad about my parting

Don’t feel like you never said goodbye

For you and I both know deep in our hearts

That We Said Goodbye a Thousand Times

And shared so much love and joy every day


Be happy that I am now at peace

Be joyful that I have lived a wonderful life

Be happy that we have shared so much together


And remember I am always with you in a thought and a sigh

Every day when you see the beauty in nature think of me

Every day when you see the colorful flowers think of me

Every day when you see a frisky animal prancing around think of me

Every day when you look into the eyes of someone you love think of me


And know beyond a doubt that I am with you in everything you do

And know beyond a doubt that I am with you in everything you say

And know beyond a doubt that I am with you in every quiet moment of your life


Don’t be sad about my parting

Don’t feel like you never said goodbye

For you and I both know deep in our hearts

That We Said Goodbye a Thousand Times

And shared so much love and joy every day


LibreOffice News and Google Musings

Tux, the Linux penguin
Image via Wikipedia

Official Bloggers on LibreOffice- http://planet.documentfoundation.org/

Note- for some strange reason I continue to be on top ranked LibreOffice blogs- maybe because I write more on the software itself than on Oracle politics or coffee spillovers.

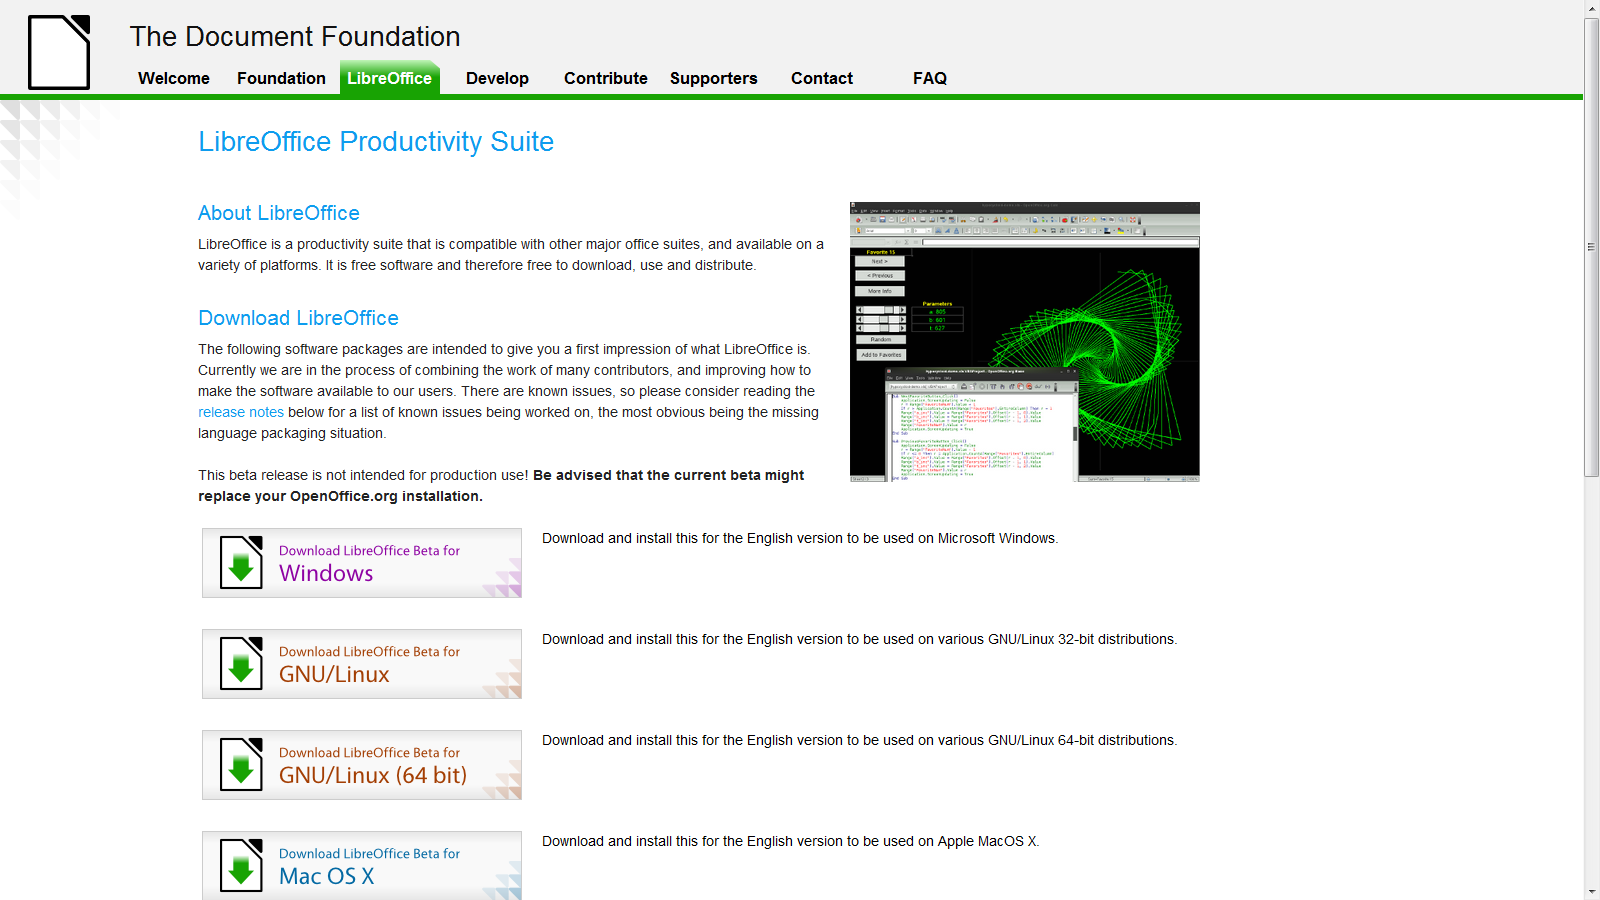
LibreOffice Beta 2  is ready and I just installed it on Windows 7 – works nice- and I somehow think open Office and Google needs an  example to stop being so scary on cautioning—— hey,hey it’s a  beta – (do you see Oracle saying this release is a beta or Windows saying hey this Windows Vista is a beta for Windows 7- No right?)-

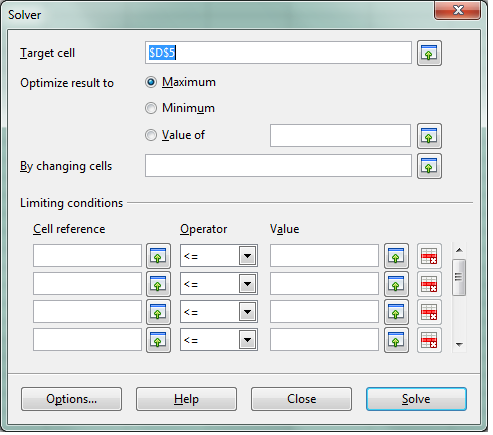
see screenshot of solver in  LibreOffice spreadsheet -works just fine.

We cant wait for Chromium OS and LibreOffice integration (or Google Docs-LibreOffice integration)  so Google starts thinking on those lines (of course

Google also needs to ramp up Google Storage and Google Predict API– but dude are you sure you wanna take on Amazon, Oracle and MS and Yahoo and Apple at the same time. Dear Herr Schmidt- Last German Guy who did that ,  ended up in a bunker in Berlin. (Ever since I had to pay 50 euros as Airline Transit fee -yes Indian passport holders have to do that in Germany- I am kind of non objective on that issue)

Google Management is busy nowadays thinking of trying to beat Facebook -hint -hint-

-buy out the biggest app makers of Facebook apps and create an api for Facebook info download and upload into Orkut –maybe invest like an angel in that startup called Diaspora http://www.joindiaspora.com/) see-

Back to the topic (and there are enough people blogging on Google should or shouldnt do)

-LibreOffice aesthetically rocks! It has a cool feel.

More news- The Wiki is up and awaits you at http://wiki.documentfoundation.org/Documentation

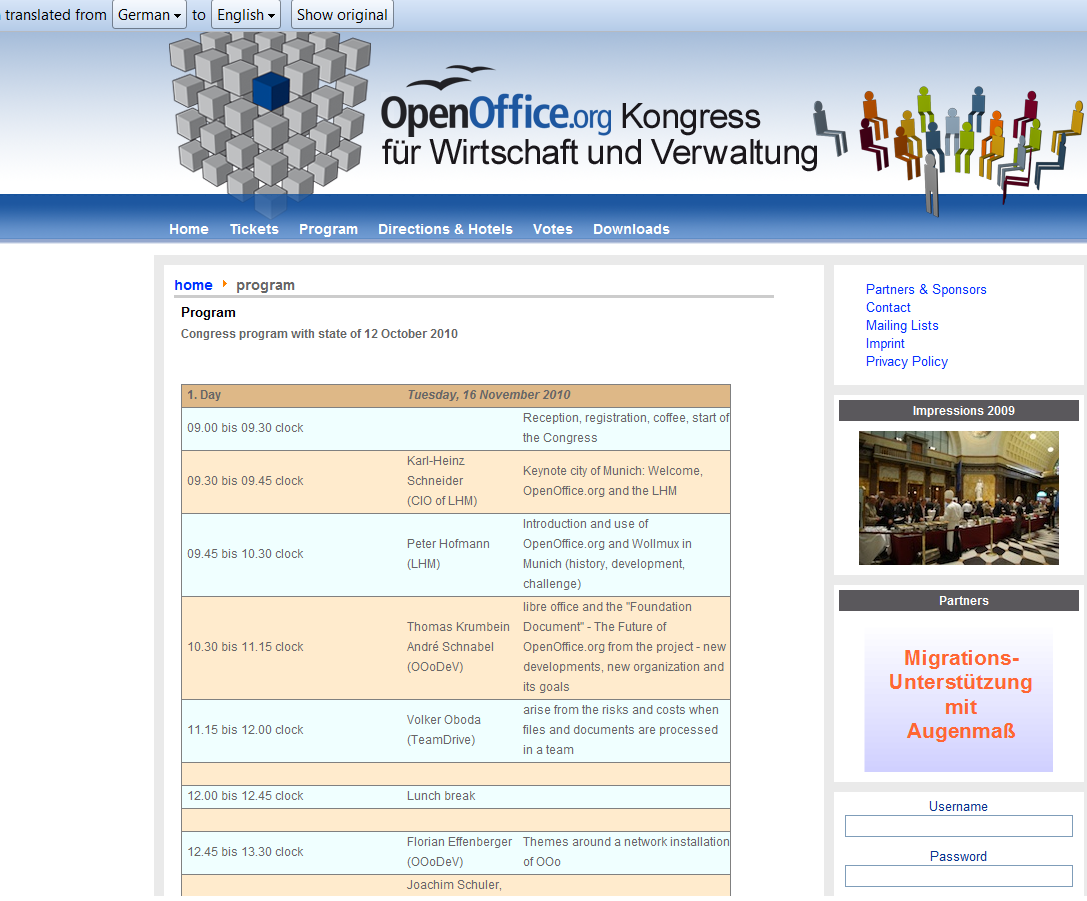
And there is a general pow-wow scheduled at http://www.oookwv.de/ for the Open Office Congress (Kongress)

As you can see I used the Chrome Extension for Google Translate for an instant translation from German into English (though it still needs some work,  Herr Translator)

Back to actually working on LibreOffice- if Word and Powerpoint is all you do- save some money for Christmas and download it today from

Blogging Motivations

Doctor Girlfriend
Image via Wikipedia

My blogging motivations

1. Sum up your blogging motivation, philosophy and experience in exactly 10 words:

I am addicted to writing prose and poetry ergo blog.

2. Pass it on to 10 others.

3. If you read this and are blogging and have not yet done this, consider yourself tagged.

From: Dr. Girlfriend


John Sall sets JMP 9 free to tango with R


Diagnostic graphs produced by plot.lm() functi...
Image via Wikipedia


John Sall, founder SAS AND JMP , has released the latest blockbuster edition of flagship of JMP 9 (JMP Stands for John’s Macintosh Program).

To kill all birds with one software, it is integrated with R and SAS, and the brochure frankly lists all the qualities. Why am I excited for JMP 9 integration with R and with SAS- well it integrates bigger datasets manipulation (thanks to SAS) with R’s superb library of statistical packages and a great statistical GUI (JMP). This makes JMP the latest software apart from SAS/IML, Rapid Miner,Knime, Oracle Data Miner to showcase it’s R integration (without getting into the GPL compliance need for showing source code– it does not ship R- and advises you to just freely download R). I am sure Peter Dalgaard, and Frankie Harell are all overjoyed that R Base and Hmisc packages would be used by fellow statisticians  and students for JMP- which after all is made in the neighborhood state of North Carolina.

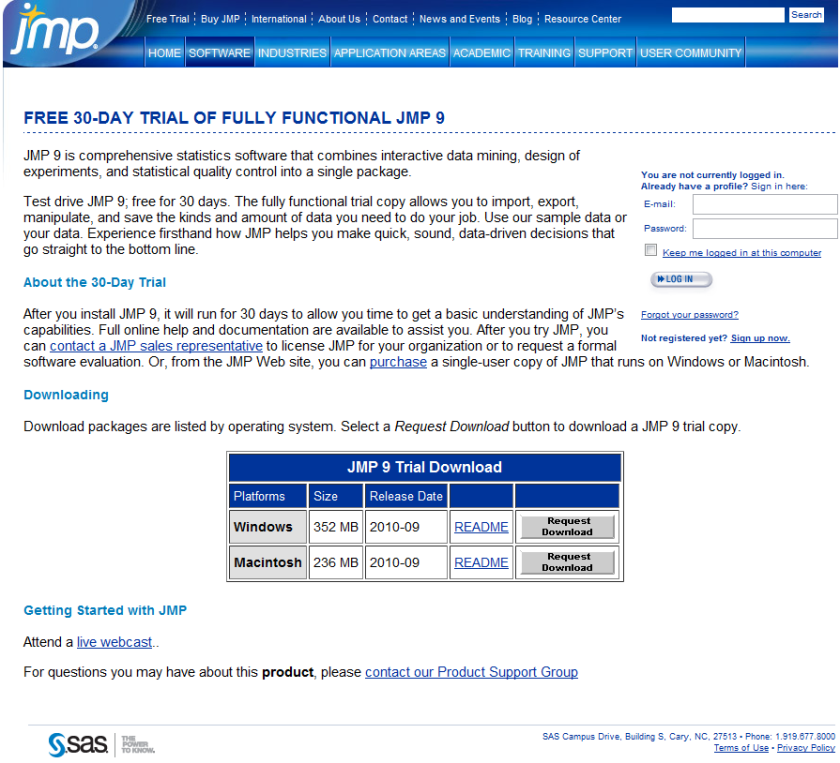
Best of all a JMP 30 day trial is free- so no money lost if you download JMP 9 (and no they dont ask for your credit card number, or do they- but they do have a huuuuuuge form to register before you download. Still JMP 9 the software itself is more thoughtfully designed than the email-prospect-leads-form and the extra functionality in the free 30 day trial is worth it.

Also see “New Features  in JMP 9  http://www.jmp.com/software/jmp9/pdf/new_features.pdf

which has this regarding R.

Working with R

R is a programming language and software environment for statistical computing and graphics. JMP now  supports a set of JSL functions to access R. The JSL functions provide the following options:

• open and close a connection between JMP and R

• exchange data between JMP and R

•submit R code for execution

•display graphics produced by R

JMP and R each have their own sets of computational methods.

R has some methods that JMP does not have. Using JSL functions, you can connect to R and use these R computational methods from within JMP.

Textual output and error messages from R appear in the log window.R must be installed on the same computer as JMP.

JMP is not distributed with a copy of R. You can download R from the Comprehensive R Archive Network Web site:http://cran.r-project.org

Because JMP is supported as both a 32-bit and a 64-bit Windows application, you must install the corresponding 32-bit or 64-bit version of R.

For details, see the Scripting Guide book.

and the download trial page ( search optimized URL) –

http://www.sas.com/apps/demosdownloads/jmptrial9_PROD__sysdep.jsp?packageID=000717&jmpflag=Y

In related news (Richest man in North Carolina also ranks nationally(charlotte.news14.com) , Jim Goodnight is now just as rich as Mark Zuckenberg, creator of Facebook-

though probably they are not creating a movie on Jim yet (imagine a movie titled “The Statistical Software” -not just the same dude feel as “The Social Network”)

See John’s latest interview :

The People Behind the Software: John Sall

http://blogs.sas.com/jmp/index.php?/archives/352-The-People-Behind-the-Software-John-Sall.html

Interview John Sall Founder JMP/SAS Institute

https://decisionstats.com/2009/07/28/interview-john-sall-jmp/

SAS Early Days

https://decisionstats.com/2010/06/02/sas-early-days/