Here is an announcement from Predictive Analytics World, the worlds largest vendor neutral conference dedicated to Predictive Analytics alone. Decisionstats has been a blog partner of PAWCON since inception. This is cool stuff!
|
||||||||||||||||||


Here is an announcement from Predictive Analytics World, the worlds largest vendor neutral conference dedicated to Predictive Analytics alone. Decisionstats has been a blog partner of PAWCON since inception. This is cool stuff!
|
||||||||||||||||||
Well it is summer here in Delhi, India and hacking season has just begun.
Some noteable hacks that have already played-
1) The adventures of Sony Websites and bumbling administrators
2) The loose passwords of InfraGard as played by Lulz Security
http://www.computerworld.com/s/article/9217320/LulzSec_claims_it_hacked_FBI_linked_organization
3) PBS website hacked to revive Tupac is alive myths.
http://blogs.forbes.com/andygreenberg/2011/05/30/pbs-hacked-after-critical-wikileaks-show/
4) Iranian computers hacked
5) Google hacked (not by China)
http://www.zdnet.com/blog/security/google-chrome-hacked-with-sophisticated-exploit/8626
6) Google hacked (again by China)
http://googleblog.blogspot.com/2011/06/ensuring-your-information-is-safe.html
7) US State Department hacked (by you know who)
8) Iranian nuclear reactors hacked (old news but we like this one)
http://www.bbc.co.uk/news/technology-12465688
9) Julian Assange hacked
http://www.guardian.co.uk/media/2011/feb/07/julian-assange-prosecutor
okay Julian got hacked by the oldest hack trap in the world but it is still pertinent.
So how the fuck do we control these evil hackers.
The correct solution to bring talented members of the technical community back into the nice air contioned corporate tent of technology is to-
Unfortunately this will never happen. even the big grand Daddy , Google is willing to define hacking contests only in the narrow frame o technical hacks, rather than a system breach hack. Because system breach hacks generally happen at the people level.
Internal cover your assets mentality prevents technology and media employees from reaching out and helping create a secure online platform, thus harming shareholders.
Destruction testing (even in a controlled sandbox) of online systems would reveal the underbelly of corporate information technology.
I mean who wants to sponsor a hack contest that makes you look bad, when it is much more expensive to have a hacking attacks that decreases share price, but doesnot affect your salary.
We have gone in for crowd sourced coding.
How about incentivizing crowd sourced systems design for secure and free internet.
http://rewiredstate.org/ does it.
Apparently UK is more open for hackers than the US.

–
Coding a Better Country
May 7th, 2011 sees the first Rewired State ALBA event out in Norfolk. More details here.
March 26, 2011
We are very excited about our THIRD National Hack the Government Day, being held on the 26th March.
1) Apps that save money or time or both for government/citizens/business
2) Best use of crime data (the prize will contain the number 300,000, but it won’t be pounds)
3) Best use of justice data (we’re working to arrange for previously unreleased data to be available on the day)
——————————————————————————
Any takers? Julian, ?
For some time now, I had been hoping for a place where new package or algorithm developers get at least a fraction of the money that iPad or iPhone application developers get. Rapid Miner has taken the lead in establishing a marketplace for extensions. Is there going to be paid extensions as well- I hope so!!
This probably makes it the first “app” marketplace in open source and the second app marketplace in analytics after salesforce.com
It is hard work to think of new algols, and some of them can really be usefull.
Can we hope for #rstats marketplace where people downloading say ggplot3.0 atleast get a prompt to donate 99 cents per download to Hadley Wickham’s Amazon wishlist. http://www.amazon.com/gp/registry/1Y65N3VFA613B
Do you think it is okay to pay 99 cents per iTunes song, but not pay a cent for open source software.
I dont know- but I am just a capitalist born in a country that was socialist for the first 13 years of my life. Congratulations once again to Rapid Miner for innovating and leading the way.
http://rapid-i.com/component/option,com_myblog/show,Rapid-I-Marketplace-Launched.html/Itemid,172
| RapidMiner, Marketplace, Extensions | 30 May 2011 |
| Rapid-I Marketplace Launched by Simon Fischer |
Over the years, many of you have been developing new RapidMiner Extensions dedicated to a broad set of topics. Whereas these extensions are easy to install in RapidMiner – just download and place them in the plugins folder – the hard part is to find them in the vastness that is the Internet. Extensions made by ourselves at Rapid-I, on the other hand, are distributed by the update server making them searchable and installable directly inside RapidMiner.
We thought that this was a bit unfair, so we decieded to open up the update server to the public, and not only this, we even gave it a new look and name. The Rapid-I Marketplace is available in beta mode at http://rapidupdate.de:8180/ . You can use the Web interface to browse, comment, and rate the extensions, and you can use the update functionality in RapidMiner by going to the preferences and entering http://rapidupdate.de:8180/UpdateServer/ as the update server URL. (Once the beta test is complete, we will change the port back to 80 so we won’t have any firewall problems.)
As an Extension developer, just register with the Marketplace and drop me an email (fischer at rapid-i dot com) so I can give you permissions to upload your own extension. Upload is simple provided you use the standard RapidMiner Extension build process and will boost visibility of your extension.
Looking forward to see many new extensions there soon!
Disclaimer- Decisionstats is a partner of Rapid Miner. I have been liking the software for a long long time, and recently agreed to partner with them just like I did with KXEN some years back, and with Predictive AnalyticsConference, and Aster Data until last year.
I still think Rapid Miner is a very very good software,and a globally created software after SAP.
Here is the actual marketplace
http://rapidupdate.de:8180/UpdateServer/faces/index.xhtml
The Rapid-I Marketplace will soon replace the RapidMiner update server. Using this marketplace, you can share your RapidMiner extensions and make them available for download by the community of RapidMiner users. Currently, we are beta testing this server. If you want to use this server in RapidMiner, you must go to the preferences and enter http://rapidupdate.de:8180/UpdateServer for the update url. After the beta test, we will change the port back to 80, which is currently occupied by the old update server. You can test the marketplace as a user (downloading extensions) and as an Extension developer. If you want to publish your extension here, please let us know via the contact form.
![]()
| 5/30/11 12:39 PM | User burgetrm has uploaded version 1.1.0 of Imageprocessing. |
| 5/30/11 12:34 PM | User burgetrm has uploaded version 1.0.0 of Imageprocessing. |
| 5/30/11 11:55 AM | User burgetrm has created the new product Imageprocessing. |
| 5/30/11 11:12 AM | User Rapid-I has uploaded version 5.0.7 of RapidMiner. |
| 5/30/11 11:12 AM | User Rapid-I has uploaded version 5.0.2 of RapidMiner. |
![]()
This is a short list of several known as well as lesser known R ( #rstats) language codes, packages and tricks to build a business intelligence application. It will be slightly Messy (and not Messi) but I hope to refine it someday when the cows come home.
It assumes that BI is basically-
a Database, a Document Database, a Report creation/Dashboard pulling software as well unique R packages for business intelligence.
What is business intelligence?
Seamless dissemination of data in the organization. In short let it flow- from raw transactional data to aggregate dashboards, to control and test experiments, to new and legacy data mining models- a business intelligence enabled organization allows information to flow easily AND capture insights and feedback for further action.
BI software has lately meant to be just reporting software- and Business Analytics has meant to be primarily predictive analytics. the terms are interchangeable in my opinion -as BI reports can also be called descriptive aggregated statistics or descriptive analytics, and predictive analytics is useless and incomplete unless you measure the effect in dashboards and summary reports.
Data Mining- is a bit more than predictive analytics- it includes pattern recognizability as well as black box machine learning algorithms. To further aggravate these divides, students mostly learn data mining in computer science, predictive analytics (if at all) in business departments and statistics, and no one teaches metrics , dashboards, reporting in mainstream academia even though a large number of graduates will end up fiddling with spreadsheets or dashboards in real careers.
Using R with
1) Databases-
I created a short list of database connectivity with R here at https://rforanalytics.wordpress.com/odbc-databases-for-r/ but R has released 3 new versions since then.
The RODBC package remains the package of choice for connecting to SQL Databases.
http://cran.r-project.org/web/packages/RODBC/RODBC.pdf
Details on creating DSN and connecting to Databases are given at https://rforanalytics.wordpress.com/odbc-databases-for-r/
For document databases like MongoDB and CouchDB
( what is the difference between traditional RDBMS and NoSQL if you ever need to explain it in a cocktail conversation http://dba.stackexchange.com/questions/5/what-are-the-differences-between-nosql-and-a-traditional-rdbms
Basically dispensing with the relational setup, with primary and foreign keys, and with the additional overhead involved in keeping transactional safety, often gives you extreme increases in performance
NoSQL is a kind of database that doesn’t have a fixed schema like a traditional RDBMS does. With the NoSQL databases the schema is defined by the developer at run time. They don’t write normal SQL statements against the database, but instead use an API to get the data that they need.
instead relating data in one table to another you store things as key value pairs and there is no database schema, it is handled instead in code.)
I believe any corporation with data driven decision making would need to both have atleast one RDBMS and one NoSQL for unstructured data-Ajay. This is a sweeping generic statement 😉 , and is an opinion on future technologies.
From- http://tommy.chheng.com/2010/11/03/rmongo-accessing-mongodb-in-r/
http://plindenbaum.blogspot.com/2010/09/connecting-to-mongodb-database-from-r.html
Connecting to a MongoDB database from R using Java
http://nsaunders.wordpress.com/2010/09/24/connecting-to-a-mongodb-database-from-r-using-java/
Also see a nice basic analysis using R Mongo from
http://pseudofish.com/blog/2011/05/25/analysis-of-data-with-mongodb-and-r/
For CouchDB
please see https://github.com/wactbprot/R4CouchDB and
http://digitheadslabnotebook.blogspot.com/2010/10/couchdb-and-r.html
2) External Report Creating Software-
Jaspersoft- It has good integration with R and is a certified Revolution Analytics partner (who seem to be the only ones with a coherent #Rstats go to market strategy- which begs the question – why is the freest and finest stats software having only ONE vendor- if it was so great lots of companies would make exclusive products for it – (and some do -see https://rforanalytics.wordpress.com/r-business-solutions/ and https://rforanalytics.wordpress.com/using-r-from-other-software/)
From
http://www.jaspersoft.com/sites/default/files/downloads/events/Analytics%20-Jaspersoft-SEP2010.pdf
we see
http://jasperforge.org/projects/rrevodeployrbyrevolutionanalytics
RevoConnectR for JasperReports Server
RevoConnectR for JasperReports Server RevoConnectR for JasperReports Server is a Java library interface between JasperReports Server and Revolution R Enterprise’s RevoDeployR, a standardized collection of web services that integrates security, APIs, scripts and libraries for R into a single server. JasperReports Server dashboards can retrieve R charts and result sets from RevoDeployR.
http://jasperforge.org/plugins/esp_frs/optional_download.php?group_id=409
R and BI – Integrating R with Open Source Business
Intelligence Platforms Pentaho and Jaspersoft
David Reinke, Steve Miller
Keywords: business intelligence
Increasingly, R is becoming the tool of choice for statistical analysis, optimization, machine learning and
visualization in the business world. This trend will only escalate as more R analysts transition to business
from academia. But whereas in academia R is often the central tool for analytics, in business R must coexist
with and enhance mainstream business intelligence (BI) technologies. A modern BI portfolio already includes
relational databeses, data integration (extract, transform, load – ETL), query and reporting, online analytical
processing (OLAP), dashboards, and advanced visualization. The opportunity to extend traditional BI with
R analytics revolves on the introduction of advanced statistical modeling and visualizations native to R. The
challenge is to seamlessly integrate R capabilities within the existing BI space. This presentation will explain
and demo an initial approach to integrating R with two comprehensive open source BI (OSBI) platforms –
Pentaho and Jaspersoft. Our efforts will be successful if we stimulate additional progress, transparency and
innovation by combining the R and BI worlds.
The demonstration will show how we integrated the OSBI platforms with R through use of RServe and
its Java API. The BI platforms provide an end user web application which include application security,
data provisioning and BI functionality. Our integration will demonstrate a process by which BI components
can be created that prompt the user for parameters, acquire data from a relational database and pass into
RServer, invoke R commands for processing, and display the resulting R generated statistics and/or graphs
within the BI platform. Discussion will include concepts related to creating a reusable java class library of
commonly used processes to speed additional development.
If you know Java- try http://ramanareddyg.blog.com/2010/07/03/integrating-r-and-pentaho-data-integration/
and I like this list by two venerable powerhouses of the BI Open Source Movement
http://www.openbi.com/demosarticles.html
Open Source BI as disruptive technology
http://www.openbi.biz/articles/osbi_disruption_openbi.pdf
Open Source Punditry
| TITLE | AUTHOR | COMMENTS |
|---|---|---|
| Commercial Open Source BI Redux | Dave Reinke & Steve Miller | An review and update on the predictions made in our 2007 article focused on the current state of the commercial open source BI market. Also included is a brief analysis of potential options for commercial open source business models and our take on their applicability. |
| Open Source BI as Disruptive Technology | Dave Reinke & Steve Miller | Reprint of May 2007 DM Review article explaining how and why Commercial Open Source BI (COSBI) will disrupt the traditional proprietary market. |
| TITLE | AUTHOR | COMMENTS |
|---|---|---|
| R You Ready for Open Source Statistics? | Steve Miller | R has become the “lingua franca” for academic statistical analysis and modeling, and is now rapidly gaining exposure in the commercial world. Steve examines the R technology and community and its relevancy to mainstream BI. |
| R and BI (Part 1): Data Analysis with R | Steve Miller | An introduction to R and its myriad statistical graphing techniques. |
| R and BI (Part 2): A Statistical Look at Detail Data | Steve Miller | The usage of R’s graphical building blocks – dotplots, stripplots and xyplots – to create dashboards which require little ink yet tell a big story. |
| R and BI (Part 3): The Grooming of Box and Whiskers | Steve Miller | Boxplots and variants (e.g. Violin Plot) are explored as an essential graphical technique to summarize data distributions by categories and dimensions of other attributes. |
| R and BI (Part 4): Embellishing Graphs | Steve Miller | Lattices and logarithmic data transformations are used to illuminate data density and distribution and find patterns otherwise missed using classic charting techniques. |
| R and BI (Part 5): Predictive Modelling | Steve Miller | An introduction to basic predictive modelling terminology and techniques with graphical examples created using R. |
| R and BI (Part 6) : Re-expressing Data |
Steve Miller | How do you deal with highly skewed data distributions? Standard charting techniques on this “deviant” data often fail to illuminate relationships. This article explains techniques to re-express skewed data so that it is more understandable. |
| The Stock Market, 2007 | Steve Miller | R-based dashboards are presented to demonstrate the return performance of various asset classes during 2007. |
| Bootstrapping for Portfolio Returns: The Practice of Statistical Analysis | Steve Miller | Steve uses the R open source stats package and Monte Carlo simulations to examine alternative investment portfolio returns…a good example of applied statistics using R. |
| Statistical Graphs for Portfolio Returns | Steve Miller | Steve uses the R open source stats package to analyze market returns by asset class with some very provocative embedded trellis charts. |
| Frank Harrell, Iowa State and useR!2007 | Steve Miller | In August, Steve attended the 2007 Internation R User conference (useR!2007). This article details his experiences, including his meeting with long-time R community expert, Frank Harrell. |
| An Open Source Statistical “Dashboard” for Investment Performance | Steve Miller | The newly launched Dashboard Insight web site is focused on the most useful of BI tools: dashboards. With this article discussing the use of R and trellis graphics, OpenBI brings the realm of open source to this forum. |
| Unsexy Graphics for Business Intelligence | Steve Miller | Utilizing Tufte’s philosophy of maximizing the data to ink ratio of graphics, Steve demonstrates the value in dot plot diagramming. The R open source statistical/analytics software is showcased. |
 brew: Templating Framework for Report Generation

brew implements a templating framework for mixing text and R code for report generation. brew template syntax is similar to PHP, Ruby's erb module, Java Server Pages, and Python's psp module. http://bit.ly/jINmaI
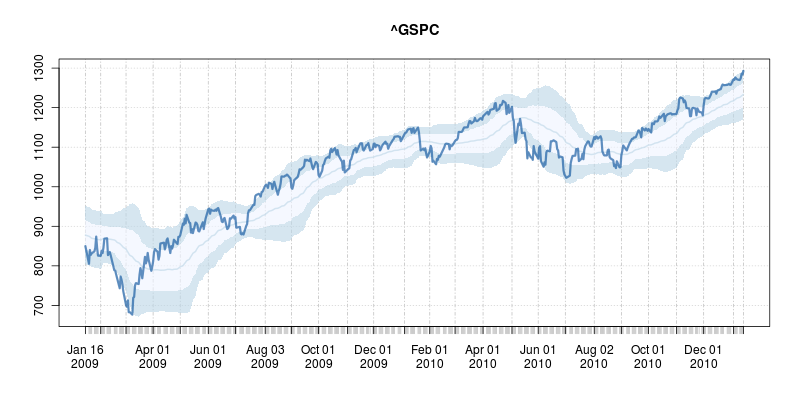
http://dirk.eddelbuettel.com/blog/2011/01/16/#overbought_oversold_plot

After the Navy I worked as a Respiratory Therapist, a roofer, and I repaired print shop equipment. Basically whatever it took to make a buck or two. Eventually I started selling computers. That led me to running a multi-line dial-up BBS and I taught myself how to program. Eventually that led to a job with a small engineering company where we developed WiFi.
After the WiFi project I started consulting on my own. I used Rackspace to host my clients, and eventually they hired me. I’ve been here almost three years and have held several roles. I currently manage Social Media, building 43 and am involved in several other projects such as the Rackspace Startup Program.
Rackspace has met some amazing new customers through the relationships that started with an interview.
and we actually look for people focused on delivering amazing customer experiences during our interviewing and hiring practices. People that find a personal sense of pride and reward by helping others should apply at
Rackspace. We are hiring like crazy!
Brief Biography- (in his own words from http://www.lagesse.org/about/)
My technical background includes working on the development of WiFi, writing wireless applications for the Apple Newton, mentoring/managing several software-based start-ups, running software quality assurance teams and more. In 2008 I joined Rackspace as an employee – a “Racker”. I was previously a 7 year customer and the company impressed me. My initial role was as Director of Software Development for the Rackspace Cloud. It was soon evident that I was better suited to a customer facing role since I LOVE talking to customers. I am currently the Director of Customer Development Chief Disruption Officer. I manage building43 and enjoy working with Robert Scoble and Rocky Barbanica to make that happen. The org chart says they work for me. Reality tells me the opposite ![]()
Go take a look – I’m proud of what we are building there (pardon the pun!).
I do a lot of other stuff at Rackspace – mostly because they let me! I love a company that lets me try. Rackspace does that.Going further back, I have been a Mayor (in Hawaii). I have written successful shareware software. I have managed employees all over the world. I have been all over the world. I have also done roofing, repaired high end print-shop equipment, been a Neonatal Respiratory Therapist, done CPR on a boat, in a plane, and in a hardware store (and of course in hospitals).
I have treated jumpers from the Golden Gate Bridge – and helped save a few. I have lived in Illinois (Kankakee), California (San Diego, San Francisco and Novato), Texas (Corpus Christi and San Antonio), Florida (Pensacola and Palm Bay), Hawaii (Honolulu/Fort Shafter) and several other places for shorter durations.
For the last 8+ years I have been a single parent – and have done an amazing job (yes, I am a proud papa) thanks to having great kids. They are both in College now – something I did NOT manage to accomplish. I love doing anything someone thinks I am not qualified to do.
I can be contacted at rob (at) lagesse (dot) org
you can follow Rob at http://twitter.com/kr8tr

One more contest- open only for US though
but the prizes are hmm okay. The catch is you have to use the software Tableau created
not R or J or ggobi or ggplot or java

Check out http://www.tableausoftware.com/public/biz-viz-contest/?=decisionstats

Are you a business, finance or real estate geek? This contest is for you! In cooperation with The Economist Ideas Economy conference, the Tableau Software Interactive “Viz” Contest will focus on business, finance and real estate data… Find some data then use Tableau Public to analyze and visualize it. That’s all it takes.
A 3-day trip to Las Vegas and a chance to win $2,000 & an iPad2
The winner chosen by our judges will also take away a free roundtrip ticket to attend the2011 Tableau Customer Conference. This includes 3 night’s accommodations at theEncore and a chance to compete in the Iron Viz championship with the winners of two other contests. The winner of Iron Viz will take away a new iPad2, and $2,000.
Cash for the crowd favorite
After entering you’ll receive a custom bit.ly link to your viz. Tweet, Facebook and e-mail that link to everyone you can! Whoever gets the most clicks through their link will become our Crowd Favorite and receive a $250 debit card.
Recognition from The Economist Ideas Economy
Your winning entry will be announced live on stage at The Economist Ideas Economy conference, and Tableau will issue a national press release naming the winner.
Everyone who enters gets a t-shirt!
Everyone who enters will get a very cool Tableau t-shirt. The winner will also receive increased Tableau Public limits and a free copy of Tableau Desktop (a $1999 value)!
(Click on the steps to expand and get the details.)
Check the box to view all steps and details.
The following contest is open to legal residents of the United Sates only. You must publish your “viz” on your blog or website to be qualified. Submission form must be submitted by June 3, 2011. Winners will be notified by June 7, 2010. Incomplete applications will not be accepted.
Please read all the rules in their entirety before entering.

As per Jimmy Wales and his merry band at Wiki (pedia not leaky-ah)- The emphasis is mine
What is the best white paper you have read in the past 15 years.
Categories are-
A white paper is an authoritative report or guide that helps solve a problem. White papers are used to educate readers and help people make decisions, and are often requested and used in politics, policy, business, and technical fields. In commercial use, the term has also come to refer to documents used by businesses as a marketing or sales tool. Policy makers frequently request white papers from universities or academic personnel to inform policy developments with expert opinions or relevant research.
In the Commonwealth of Nations, “white paper” is an informal name for a parliamentary paper enunciating government policy; in the United Kingdom these are mostly issued as “Command papers“. White papers are issued by the government and lay out policy, or proposed action, on a topic of current concern. Although a white paper may on occasion be a consultation as to the details of new legislation, it does signify a clear intention on the part of a government to pass new law. White Papers are a “…. tool of participatory democracy … not [an] unalterable policy commitment.[1] “White Papers have tried to perform the dual role of presenting firm government policies while at the same time inviting opinions upon them.” [2]
In Canada, a white paper “is considered to be a policy document, approved by Cabinet, tabled in the House of Commons and made available to the general public.”[3] A Canadian author notes that the “provision of policy information through the use of white and green papers can help to create an awareness of policy issues among parliamentarians and the public and to encourage an exchange of information and analysis. They can also serve as educational techniques”.[4]
“White Papers are used as a means of presenting government policy preferences prior to the introduction of legislation”; as such, the “publication of a White Paper serves to test the climate of public opinion regarding a controversial policy issue and enables the government to gauge its probable impact”.[5]
By contrast, green papers, which are issued much more frequently, are more open ended. These green papers, also known as consultation documents, may merely propose a strategy to be implemented in the details of other legislation or they may set out proposals on which the government wishes to obtain public views and opinion.
White papers published by the European Commission are documents containing proposals for European Union action in a specific area. They sometimes follow a green paper released to launch a public consultation process.
For examples see the following:
You know whom to blame for all of this. Its Winston Churchill, not Barack Obama
Since the early 1990s, the term white paper has also come to refer to documents used by businesses and so-called think tanks as marketing or sales tools. White papers of this sort argue that the benefits of a particular technology, product or policy are superior for solving a specific problem.
These types of white papers are almost always marketing communications documents designed to promote a specific company’s or group’s solutions or products. As a marketing tool, these papers will highlight information favorable to the company authorizing or sponsoring the paper. Such white papers are often used to generate sales leads, establish thought leadership, make a business case, or to educate customers or voters.
There are four main types of commercial white papers:
