Using Code Editors in R

Using Enhanced Code Editors


Advantages of using enhanced code editors

1) Readability- Features like syntax coloring helps make the code more readable for documentation as well as debugging and improvement. Example functions may be colored in blue, input parameters in green, and simple default code syntax in black. Especially for lengthy programs or tweaking auto generated code by GUI, this readability comes in handy.

2) Automatic syntax error checking- Enhanced editors can prompt you if certain errors in syntax (like brackets not closed, commas misplaced)- and errors may be highlighted in color (red mostly). This helps a lot in correcting code especially if you are either new to R programming or your main focus is business insights and not just coding. Syntax debugging is thus simplified.

3) Speed of writing code- Most programmers report an increase in writing code speed when using an enhanced editor.

4) Point Breaks- You can insert breaks at certain parts of code to run some lines of code together, or debug a program. This is a big help given that default code editor makes it very cumbersome and you have to copy and paste lines of code again and again to run selectively. On an enhanced editor you can submit lines as well as paragraphs of code.

5) Auto-Completion- Auto completion enables or suggests options you to complete the syntax even when you have typed part of the function name.

Some commonly used code editors are –
Notepad++ -It supports R and also has a plugin called NPP to R.
It can be used  for a wide variety of other languages as well, and has all the features mentioned above.

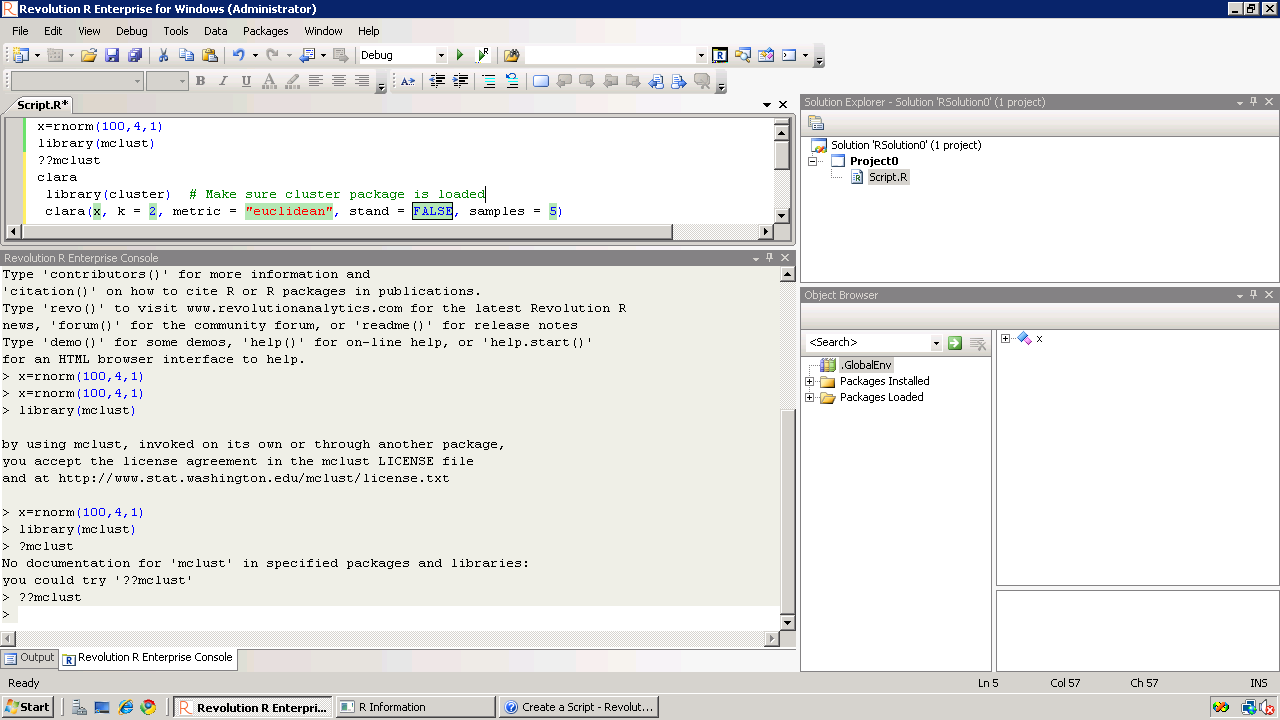
Revolution R Productivity Environment (RPE)-While Revolution R has announced a new GUI to be launched in 2011- the existing enhancements to their software include a code editor called RPE.

Syntax color highlighting is already included. Code Snippets work in a fairly simply way.
Right click-
Click on Insert Code Snippet.

You can get a drop down of tasks to do- (like Analysis)
Selecting Analysis we get another list of sub-tasks (like Clustering).
Once you click on Clustering you get various options.
Like clicking clara will auto insert the code for clara clustering.

Now even if you are averse to using a GUI /or GUI creators don’t have your particular analysis you can basically type in code at an extremely fast pace.
It is useful to even experienced people who do not have to type in the entire code, but it is a boon to beginners as the parameters in function inserted by code snippet are automatically selected in multiple colors. And it can help you modify the auto generated code by your R GUI at a much faster pace.

TinnR -The most popular and a very easy to use code editor. It is available at http://www.sciviews.org/Tinn-R/
It’s disadvantage is it supports Windows operating system only.
Recommended as the beginner’s chose fore code editor.

Eclipse with R plugin http://www.walware.de/goto/statet This is recommended especially to people working with Eclipse and on Unix systems. It enables you to do most of the productivity enhancement featured in other text editors including submitting code the R session.

Gvim (http://www.vim.org/) along Vim-R-plugin2
(http://www.vim.org/scripts/script.php?script_id=2628) should be
cited. The Vim-R-plugin developer recently added windows support to a
lean cross-platform package that works well. It can be suited as a niche text editor to people who like less features in the software. It is not as good as Eclipse or Notepad++ but is probably the simplest to use.

Using Code Snippets in Revolution R

So I am still testing Revo R on the 64 bit AMI i created on the weekend and I really like the code snippets feature in Revolution R.

Code Snippets work in a fairly simply way.

Right click– Click on Insert Code Snippet.

You can get a drop down of tasks to do- (like Analysis) Selecting Analysis we get another list of tasks (like Clustering).

Once you click on Clustering you get various options. Like clicking clara will auto insert the code

Now even if you are averse to using a GUI /or GUI creators don’t have your particular analysis you can basically type in code at an extremely fast pace.

It is useful to people who do not have to type in the entire code, but it is a boon to beginners as the parameters in function inserted by code snippet are automatically selected in multiple colors.

Also separately if are typing code for a function and hover, the various parameters for that particular function are shown.

Quite possibly the fastest way to write R code- and it is un matched by other code editors I am testing including Vim,Notepad++,Eclipse R etc.

The RPE (R Productivity Environment for windows- horrible bureaucratic name is the only flaw here) thus helps as it is quite thoughtfully designed. Interestingly they even have a record macro feature – which I am quite unsure of , but looks like automating some tasks. That’s next 🙂

See screenshot –

It would be quite nice to see the new Revo R GUI if it becomes available if it is equally intuitively designed considering it now has the founders of SPSS and one founder of R* as it’s members-it should be a keenly anticipated product. again Revolution could also try creating a Paid Amazon AMI and try renting the software by the hour at least as technology demonstrator as the big analytics world seems unaware of the work they have been up to.

without getting much noise on how much the other founder of R loves Revo 😉 )

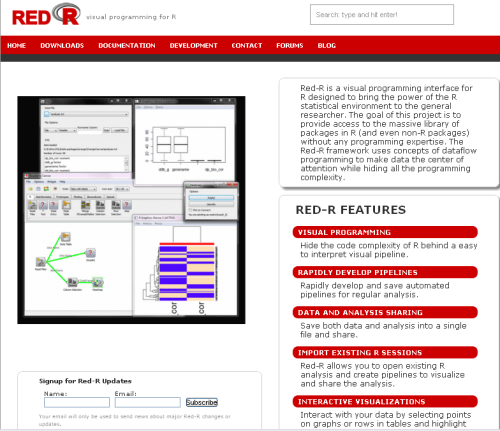
Red R 1.8- Pretty GUI

Red R 1.8 has been compiled and is available for download.

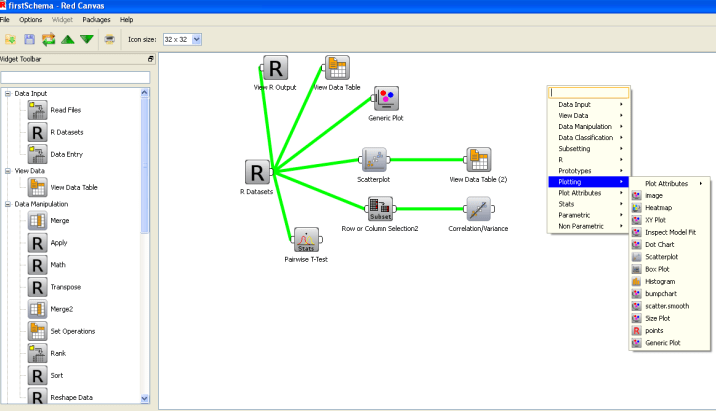
If you have seen Red R, well it resembles software like Enterprise Miner or Rapid Miner in the visual sense as it basically has a work-flow style of showing and setting up data analysis.

I played a bit with it, and this version is a definite improvement over the last ones.- Here is one more really groovy GUI for R- and it’s quite professionally done.

And a Youtube tutorial as well

Take a bow- Kyle and Anup- nice coding indeed.


Analytics and Journals

Some good journals for reading on analytics-

1) JSS

http://www.jstatsoft.org/

present research that demonstrates the joint evolution of computational and statistical methods and techniques.  Implementations can use languages such as C, C++, S, Fortran, Java, PHP, Python and Ruby or environments such as Mathematica, MATLAB, R, S-PLUS, SAS, Stata, and XLISP-STAT.

There are currently 370 articles, 23 code snippets, 86 book reviews, 4 software reviews, and 7 special volumes in archives

2) R Journal

http://journal.r-project.org/

The  Journal

3) Pharma Programming

http://maney.co.uk/index.php/journals/pha/

Pharmaceutical Programming is the official journal of the Pharmaceutical Users Software Exchange (PhUSE), a non-profit membership society with the objective of educating programmers and their managers working in the pharmaceutical industry. Available both in print and online, Pharmaceutical Programming is an international journal with focus on programming in the regulated environment of the pharmaceutical and life sciences industry.

4) SAS Papers – User Groups

http://www.lexjansen.com/

4569 SAS papers presented
at SGF/SUGI 1996-2010.
1343 SAS papers presented
at PharmaSUG 2000-2010.
1810 SAS papers presented
at NESUG 1997-2009.
1191 SAS papers presented
at SESUG 1999-2009.
463 SAS papers presented
at PhUSE 2005-2009.
787 SAS papers presented
at WUSS 2003-2009.
337 SAS papers presented
at MWSUG 2001, 2004-2009.
188 SAS papers presented
at PNWSUG 2004-2009.
246 SAS papers presented
at SCSUG 2003-2007, 2009.
221 SAS papers related to CDISC.
Easy access to the CDISC Forum.

5) http://analyticsmagazine.com/

Magazine by http://www.informs.org/

6) Data Mining Journals

Academic Journals

Journals relevant to Data Mining

SAS/Blades/Servers/ GPU Benchmarks

Just checked out cool new series from NVidia servers.

Now though SAS Inc/ Jim Goodnight thinks HP Blade Servers are the cool thing- the GPU takes hardware high performance computing to another level. It would be interesting to see GPU based cloud computers as well – say for the on Demand SAS (free for academics and students) but which has had some complaints of being slow.

See this for SAS and Blade Servers-

http://www.sas.com/success/ncsu_analytics.html

To give users hands-on experience, the program is underpinned by a virtual computing lab (VCL), a remote access service that allows users to reserve a computer configured with a desired set of applications and operating system and then access that computer over the Internet. The lab is powered by an IBM BladeCenter infrastructure, which includes more than 500 blade servers, distributed between two locations. The assignment of the blade servers can be changed to meet shifts in the balance of demand among the various groups of users. Laura Ladrie, MSA Classroom Coordinator and Technical Support Specialist, says, “The virtual computing lab chose IBM hardware because of its quality, reliability and performance. IBM hardware is also energy efficient and lends itself well to high performance/low overhead computing.

Thats interesting since IBM now competes (as owner of SPSS) and also cooperates with SAS Institute

And

http://www.theaustralian.com.au/australian-it/the-world-according-to-jim-goodnight-blade-switch-slashes-job-times/story-e6frgakx-1225888236107

You’re effectively turbo-charging through deployment of many processors within the blade servers?

Yes. We’ve got machines with 192 blades on them. One of them has 202 or 203 blades. We’re using Hewlett-Packard blades with 12 CP cores on each, so it’s a total 2300 CPU cores doing the computation.

Our idea was to give every one of those cores a little piece of work to do, and we came up with a solution. It involved a very small change to the algorithm we were using, and it’s just incredible how fast we can do things now.

I don’t think of it as a grid, I think of it as essentially one computer. Most people will take a blade and make a grid out of it, where everything’s a separate computer running separate jobs.

We just look at it as one big machine that has memory and processors all over the place, so it’s a totally different concept.

GPU servers can be faster than CPU servers, though , Professor G.


Source-

http://www.nvidia.com/object/preconfigured_clusters.html

TESLA GPU COMPUTING SOLUTIONS FOR DATA CENTERS
Supercharge your cluster with the Tesla family of GPU computing solutions. Deploy 1U systems from NVIDIA or hybrid CPU-GPU servers from OEMs that integrate NVIDIA® Tesla™ GPU computing processors.

When compared to the latest quad-core CPU, Tesla 20-series GPU computing processors deliver equivalent performance at 1/20th the power consumption and 1/10th the cost. Each Tesla GPU features hundreds of parallel CUDA cores and is based on the revolutionary NVIDIA® CUDA™ parallel computing architecture with a rich set of developer tools (compilers, profilers, debuggers) for popular programming languages APIs like C, C++, Fortran, and driver APIs like OpenCL and DirectCompute.

NVIDIA’s partners provide turnkey easy-to-deploy Preconfigured Tesla GPU clusters that are customizable to your needs. For 3D cloud computing applications, our partners offer the Tesla RS clusters that are optimized for running RealityServer with iray.

Available Tesla Products for Data Centers:
– Tesla S2050
– Tesla M2050/M2070
– Tesla S1070
– Tesla M1060

Also I liked the hybrid GPU and CPU

And from a paper on comparing GPU and CPU using Benchmark tests on BLAS from a Debian- Dirk E’s excellent blog

http://dirk.eddelbuettel.com/blog/

Usage of accelerated BLAS libraries seems to shrouded in some mystery, judging from somewhat regularly recurring requests for help on lists such as r-sig-hpc(gmane version), the R list dedicated to High-Performance Computing. Yet it doesn’t have to be; installation can be really simple (on appropriate systems).

Another issue that I felt needed addressing was a comparison between the different alternatives available, quite possibly including GPU computing. So a few weeks ago I sat down and wrote a small package to run, collect, analyse and visualize some benchmarks. That package, called gcbd (more about the name below) is now onCRAN as of this morning. The package both facilitates the data collection for the paper it also contains (in the vignette form common among R packages) and provides code to analyse the data—which is also included as a SQLite database. All this is done in the Debian and Ubuntu context by transparently installing and removing suitable packages providing BLAS implementations: that we can fully automate data collection over several competing implementations via a single script (which is also included). Contributions of benchmark results is encouraged—that is the idea of the package.

And from his paper on the same-

Analysts are often eager to reap the maximum performance from their computing platforms.

A popular suggestion in recent years has been to consider optimised basic linear algebra subprograms (BLAS). Optimised BLAS libraries have been included with some (commercial) analysis platforms for a decade (Moler 2000), and have also been available for (at least some) Linux distributions for an equally long time (Maguire 1999). Setting BLAS up can be daunting: the R language and environment devotes a detailed discussion to the topic in its Installation and Administration manual (R Development Core Team 2010b, appendix A.3.1). Among the available BLAS implementations, several popular choices have emerged. Atlas (an acronym for Automatically Tuned Linear Algebra System) is popular as it has shown very good performance due to its automated and CPU-speci c tuning (Whaley and Dongarra 1999; Whaley and Petitet 2005). It is also licensed in such a way that it permits redistribution leading to fairly wide availability of Atlas.1 We deploy Atlas in both a single-threaded and a multi-threaded con guration. Another popular BLAS implementation is Goto BLAS which is named after its main developer, Kazushige Goto (Goto and Van De Geijn 2008). While `free to use’, its license does not permit redistribution putting the onus of con guration, compilation and installation on the end-user. Lastly, the Intel Math Kernel Library (MKL), a commercial product, also includes an optimised BLAS library. A recent addition to the tool chain of high-performance computing are graphical processing units (GPUs). Originally designed for optimised single-precision arithmetic to accelerate computing as performed by graphics cards, these devices are increasingly used in numerical analysis. Earlier criticism of insucient floating-point precision or severe performance penalties for double-precision calculation are being addressed by the newest models. Dependence on particular vendors remains a concern with NVidia’s CUDA toolkit (NVidia 2010) currently still the preferred development choice whereas the newer OpenCL standard (Khronos Group 2008) may become a more generic alternative that is independent of hardware vendors. Brodtkorb et al. (2010) provide an excellent recent survey. But what has been lacking is a comparison of the e ective performance of these alternatives. This paper works towards answering this question. By analysing performance across ve di erent BLAS implementations|as well as a GPU-based solution|we are able to provide a reasonably broad comparison.

Performance is measured as an end-user would experience it: we record computing times from launching commands in the interactive R environment (R Development Core Team 2010a) to their completion.

And

Basic Linear Algebra Subprograms (BLAS) provide an Application Programming Interface
(API) for linear algebra. For a given task such as, say, a multiplication of two conformant
matrices, an interface is described via a function declaration, in this case sgemm for single
precision and dgemm for double precision. The actual implementation becomes interchangeable
thanks to the API de nition and can be supplied by di erent approaches or algorithms. This
is one of the fundamental code design features we are using here to benchmark the di erence
in performance from di erent implementations.
A second key aspect is the di erence between static and shared linking. In static linking,
object code is taken from the underlying library and copied into the resulting executable.
This has several key implications. First, the executable becomes larger due to the copy of
the binary code. Second, it makes it marginally faster as the library code is present and
no additional look-up and subsequent redirection has to be performed. The actual amount
of this performance penalty is the subject of near-endless debate. We should also note that
this usually amounts to only a small load-time penalty combined with a function pointer
redirection|the actual computation e ort is unchanged as the actual object code is identi-
cal. Third, it makes the program more robust as fewer external dependencies are required.
However, this last point also has a downside: no changes in the underlying library will be
reected in the binary unless a new build is executed. Shared library builds, on the other
hand, result in smaller binaries that may run marginally slower|but which can make use of
di erent libraries without a rebuild.

Basic Linear Algebra Subprograms (BLAS) provide an Application Programming Interface(API) for linear algebra. For a given task such as, say, a multiplication of two conformantmatrices, an interface is described via a function declaration, in this case sgemm for singleprecision and dgemm for double precision. The actual implementation becomes interchangeablethanks to the API de nition and can be supplied by di erent approaches or algorithms. Thisis one of the fundamental code design features we are using here to benchmark the di erencein performance from di erent implementations.A second key aspect is the di erence between static and shared linking. In static linking,object code is taken from the underlying library and copied into the resulting executable.This has several key implications. First, the executable becomes larger due to the copy ofthe binary code. Second, it makes it marginally faster as the library code is present andno additional look-up and subsequent redirection has to be performed. The actual amountof this performance penalty is the subject of near-endless debate. We should also note thatthis usually amounts to only a small load-time penalty combined with a function pointerredirection|the actual computation e ort is unchanged as the actual object code is identi-cal. Third, it makes the program more robust as fewer external dependencies are required.However, this last point also has a downside: no changes in the underlying library will bereected in the binary unless a new build is executed. Shared library builds, on the otherhand, result in smaller binaries that may run marginally slower|but which can make use ofdi erent libraries without a rebuild.

And summing up,

reference BLAS to be dominated in all cases. Single-threaded Atlas BLAS improves on the reference BLAS but loses to multi-threaded BLAS. For multi-threaded BLAS we nd the Goto BLAS dominate the Intel MKL, with a single exception of the QR decomposition on the xeon-based system which may reveal an error. The development version of Atlas, when compiled in multi-threaded mode is competitive with both Goto BLAS and the MKL. GPU computing is found to be compelling only for very large matrix sizes. Our benchmarking framework in the gcbd package can be employed by others through the R packaging system which could lead to a wider set of benchmark results. These results could be helpful for next-generation systems which may need to make heuristic choices about when to compute on the CPU and when to compute on the GPU.

Source – DirkE’paper and blog http://dirk.eddelbuettel.com/papers/gcbd.pdf

Quite appropriately-,

Hardware solutions or atleast need to be a part of Revolution Analytic’s thinking as well. SPSS does not have any choice anymore though 😉

It would be interesting to see how the new SAS Cloud Computing/ Server Farm/ Time Sharing facility is benchmarking CPU and GPU for SAS analytics performance – if being done already it would be nice to see a SUGI paper on the same at http://sascommunity.org.

Multi threading needs to be taken care automatically by statistical software to optimize current local computing (including for New R)

Acceptable benchmarks for testing hardware as well as software need to be reinforced and published across vendors, academics  and companies.

What do you think?


Creating an Anonymous Bot

or Surfing the Net Anonmously and Having some Fun.

On the weekend, while browsing through http://freelancer.com I came across an intriguing offer-

http://www.freelancer.com/projects/by-job/YouTube.html

Basically projects asking for increasing Youtube Views-

Hmm.Hmm.Hmm

So this is one way I though it could be done-

1) Create an IP Address Anonymizer

Thats pretty simple- I used the Tor Project at http://www.torproject.org/easy-download.html.en

Basically it uses a peer to peer network to  connect to the internet and you can reset the connection as you want-so it hides your IP address.

Also useful for sending hatemail- limitation uses Firefox browser only.And also your webpage default keeps changing languages as the ip address changes.

Note-

The Tor Project is a 501(c)(3) non-profit based in the United States. The official address of the organization is:

The Tor Project
969 Main Street, Suite 206
Walpole, MA 02081 USA
Check your IP address at http://www.whatismyip.com/

2) Creating a Bot or an automatic clicking code ( without knowing code)

Go to https://addons.mozilla.org/en-US/firefox/addon/3863/

Remember when you could create an Excel Macro by just recording the Macro (in Excel 2003)

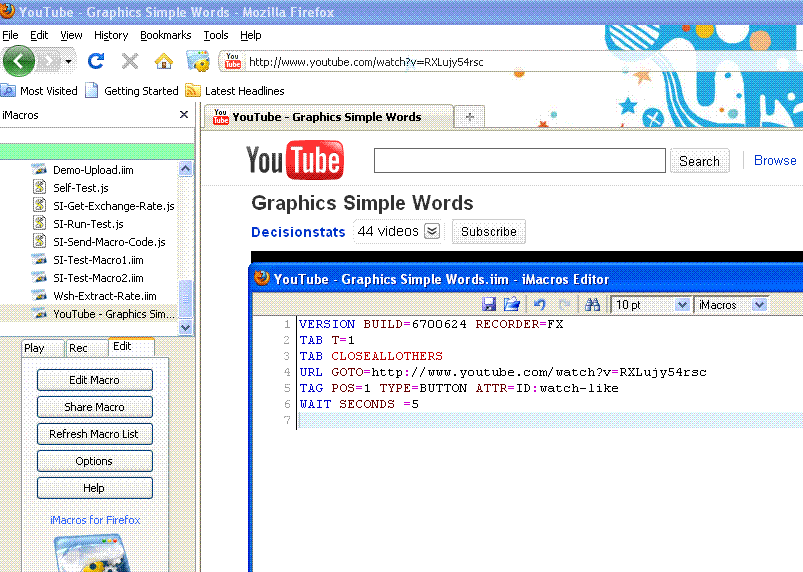
So while surfing if you need to do something again and again (like go the same Youtube video and clicking Like 5000 times) you can press record Macro

  • Do the action you want repeated again and again.
  • Click save Macro
  • Now run the Macro in a loop using the iMacro extension.

see screenshot below-

Note I have added two lines of code -WAIT SECONDS= 6

This means everytime the code runs in a loop it will wait for 6 seconds and then reload.

However I recommend you create a random number of wait seconds using Google Spreadsheet and the function RANDBETWEEN(5,400) (to limit between 5 and 400 seconds) and also use CONCATENATE with click and drag to create RANDOM wait times (instead of typing it say 500 times yourself)

see https://spreadsheets.google.com/ccc?key=tr18JVEE2TmAuH5V8fzJLRA#gid=0

That’s it – Your Anonymous Bot is ready.

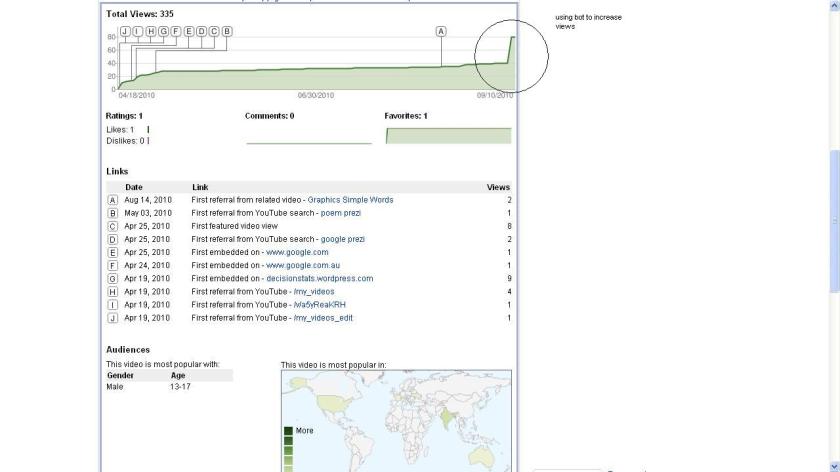
See the  analytical results for my personal favourite Streaming Poetry video http://www.youtube.com/watch?v=a5yReaKRHOM

Easy isn’t it. Lines of code written= 0 , Number of Views =335 (before I grew bored)

Note- Officially it is against Youtube Terms http://www.youtube.com/t/terms to  use scripts or Bots so I did it for Research Purposes only. And the http://Freelancer.com needs to look into the activities underway at http://www.freelancer.com/projects/by-job/YouTube.html and also http://www.freelancer.com/projects/by-job/Facebook.html and http://www.freelancer.com/projects/by-job/Social-Networking.html

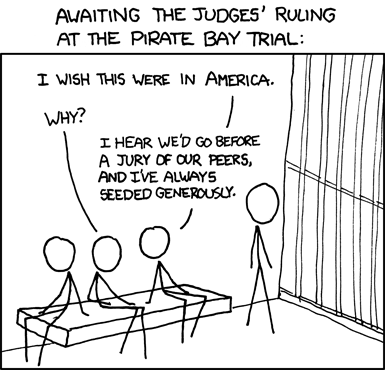
The final word on these activities is by http://xkcd.com or

Interview Stephanie McReynolds Director Product Marketing, AsterData

Here is an interview with Stephanie McReynolds who works as as Director of Product Marketing with AsterData. I asked her a couple of questions about the new product releases from AsterData in analytics and MapReduce.

Ajay – How does the new Eclipse Plugin help people who are already working with huge datasets but are new to AsterData’s platform?

Stephanie- Aster Data Developer Express, our new SQL-MapReduce development plug-in for Eclipse, makes MapReduce applications easy to develop. With Aster Data Developer Express, developers can develop, test and deploy a complete SQL-MapReduce application in under an hour. This is a significant increase in productivity over the traditional analytic application development process for Big Data applications, which requires significant time coding applications in low-level code and testing applications on sample data.

Ajay – What are the various analytical functions that are introduced by you recently- list say the top 10.

Stephanie- At Aster Data, we have an intense focus on making the development process easier for SQL-MapReduce applications. Aster Developer Express is a part of this initiative, as is the release of pre-defined analytic functions. We recently launched both a suite of analytic modules and a partnership program dedicated to delivering pre-defined analytic functions for the Aster Data nCluster platform. Pre-defined analytic functions delivered by Aster Data’s engineering team are delivered as modules within the Aster Data Analytic Foundation offering and include analytics in the areas of pattern matching, clustering, statistics, and text analysis– just to name a few areas. Partners like Fuzzy Logix and Cobi Systems are extending this library by delivering industry-focused analytics like Monte Carlo Simulations for Financial Services and geospatial analytics for Public Sector– to give you a few examples.

Ajay – So okay I want to do a K Means Cluster on say a million rows (and say 200 columns) using the Aster method. How do I go about it using the new plug-in as well as your product.

Stephanie- The power of the Aster Data environment for analytic application development is in SQL-MapReduce. SQL is a powerful analytic query standard because it is a declarative language. MapReduce is a powerful programming framework because it can support high performance parallel processing of Big Data and extreme expressiveness, by supporting a wide variety of programming languages, including Java, C/C#/C++, .Net, Python, etc. Aster Data has taken the performance and expressiveness of MapReduce and combined it with the familiar declarativeness of SQL. This unique combination ensures that anyone who knows standard SQL can access advanced analytic functions programmed for Big Data analysis using MapReduce techniques.

kMeans is a good example of an analytic function that we pre-package for developers as part of the Aster Data Analytic Foundation. What does that mean? It means that the MapReduce portion of the development cycle has been completed for you. Each pre-packaged Aster Data function can be called using standard SQL, and executes the defined analytic in a fully parallelized manner in the Aster Data database using MapReduce techniques. The result? High performance analytics with the expressiveness of low-level languages accessed through declarative SQL.

Ajay – I see an an increasing focus on Analytics. Is this part of your product strategy and how do you see yourself competing with pure analytics vendors.

Stephanie – Aster Data is an infrastructure provider. Our core product is a massively parallel processing database called nCluster that performs at or beyond the capabilities of any other analytic database in the market today. We developed our analytics strategy as a response to demand from our customers who were looking beyond the price/performance wars being fought today and wanted support for richer analytics from their database provider. Aster Data analytics are delivered in nCluster to enable analytic applications that are not possible in more traditional database architectures.

Ajay – Name some recent case studies in Analytics of implementation of MR-SQL with Analytical functions

Stephanie – There are three new classes of applications that Aster Data Express and Aster Analytic Foundation support: iterative analytics, prediction and optimization, and ad hoc analysis.

Aster Data customers are uncovering critical business patterns in Big Data by performing hypothesis-driven, iterative analytics. They are exploring interactively massive volumes of data—terabytes to petabytes—in a top-down deductive manner. ComScore, an Aster Data customer that performs website experience analysis is a good example of an Aster Data customer performing this type of analysis.

Other Aster Data customers are building applications for prediction and optimization that discover trends, patterns, and outliers in data sets. Examples of these types of applications are propensity to churn in telecommunications, proactive product and service recommendations in retail, and pricing and retention strategies in financial services. Full Tilt Poker, who is using Aster Data for fraud prevention is a good example of a customer in this space.

The final class of application that I would like to highlight is ad hoc analysis. Examples of ad hoc analysis that can be performed includes social network analysis, advanced click stream analysis, graph analysis, cluster analysis and a wide variety of mathematical, trigonometry, and statistical functions. LinkedIn, whose analysts and data scientists have access to all of their customer data in Aster Data are a good example of a customer using the system in this manner.

While Aster Data customers are using nCluster in a number of other ways, these three new classes of applications are areas in which we are seeing particularly innovative application development.

Biography-

Stephanie McReynolds is Director of Product Marketing at Aster Data, where she is an evangelist for Aster Data’s massively parallel data-analytics server product. Stephanie has over a decade of experience in product management and marketing for business intelligence, data warehouse, and complex event processing products at companies such as Oracle, Peoplesoft, and Business Objects. She holds both a master’s and undergraduate degree from Stanford University.