PAW Videos

A message from Predictive Analytics World on  newly available videos. It has many free videos as well so you can check them out.

Predictive Analytics World March 2011 in San Francisco

Access PAW DC Session Videos Now

Predictive Analytics World is pleased to announce on-demand access to the videos of PAW Washington DC, October 2010, including over 30 sessions and keynotes that you may view at your convenience. Access this leading predictive analytics content online now:

View the PAW DC session videos online

Register by January 18th and receive $150 off the full 2-day conference program videos (enter code PAW150 at checkout)

Trial videos – view the following for no charge:

Select individual conference sessions, or recognize savings by registering for access to one or two full days of sessions. These on-demand videos deliver PAW DC right to your desk, covering hot topics and advanced methods such as:

Social data 

Text mining

Search marketing

Risk management

Survey analysis

Consumer privacy

Sales force optimization

Response & cross-sell

Recommender systems

Featuring experts such as:
Usama Fayyad, Ph.D.
CEO, Open Insights Former Chief Data Officer, Yahoo!

Andrew Pole
Sr Mgr, Media/DB Mktng
Target
View Keynote for Free

John F. Elder, Ph.D.
CEO and Founder
Elder Research

Bruno Aziza
Director, Worldwide Strategy Lead, BI
Microsoft

Eric Siegel, Ph.D.
Conference Chair
Predictive Analytics World

PAW DC videos feature over 25 speakers with case studies from leading enterprises such as: CIBC, CEB, Forrester, Macy’s, MetLife, Microsoft, Miles Kimball, Monster.com, Oracle, Paychex, SunTrust, Target, UPMC, Xerox, Yahoo!, YMCA, and more.

How video access works:

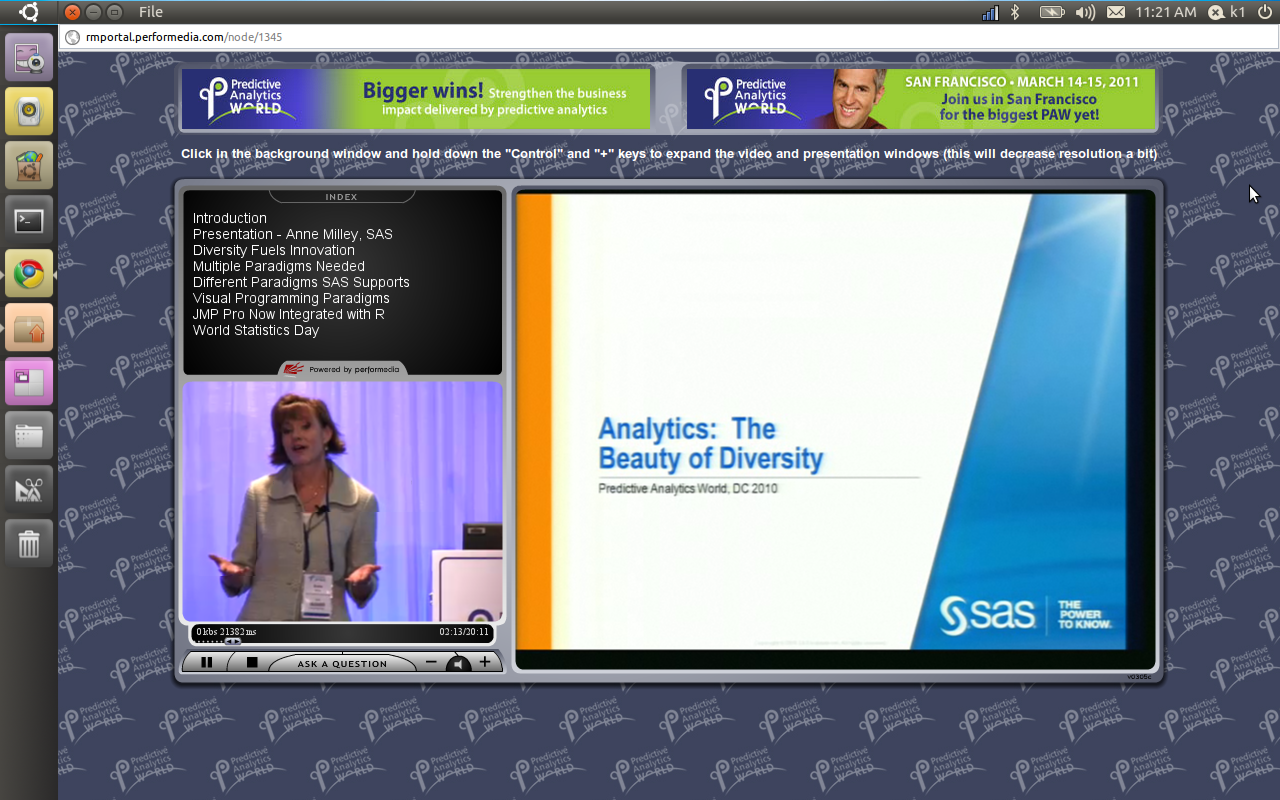
View Slides on the Left See & Hear Speaker in the Right Window

Sign up by January 18 for immediate video access and $150 discount


San Francisco
March 14-15, 2011
Washington DC
October, 2011
London
November, 2011
Contact Us

Produced by:


Session Gallery: Day 1 of 2

Viewing (17) Sessions of (31)


keynote.jpg
Add to Cart
Keynote: Five Ways Predictive Analytics Cuts Enterprise Risk  

Eric Siegel, Ph.D., Program Chair, Predictive Analytics World

All business is an exercise in risk management. All organizations would benefit from measuring, tracking and computing risk as a core process, much like insurance companies do.

Predictive analytics does the trick, one customer at a time. This technology is a data-driven means to compute the risk each customer will defect, not respond to an expensive mailer, consume a retention discount even if she were not going to leave in the first place, not be targeted for a telephone solicitation that would have landed a sale, commit fraud, or become a “loss customer” such as a bad debtor or an insurance policy-holder with high claims.

In this keynote session, Dr. Eric Siegel reveals:

– Five ways predictive analytics evolves your enterprise to reduce risk

– Hidden sources of risk across operational functions

– What every business should learn from insurance companies

– How advancements have reversed the very meaning of fraud

– Why “man + machine” teams are greater than the sum of their parts for enterprise decision support

Length – 00:45:57 | Email to a Colleague

Price: $195


sponsor.jpg
Play video of session: Platinum Sponsor Presentation, Analytics: The Beauty of Diversity
Platinum Sponsor Presentation: Analytics – The Beauty of Diversity 

Anne H. Milley, Senior Director of Analytic Strategy, Worldwide Product Marketing, SAS

Analytics contributes to, and draws from, multiple disciplines. The unifying theme of “making the world a better place” is bred from diversity. For instance, the same methods used in econometrics might be used in market research, psychometrics and other disciplines. In a similar way, diverse paradigms are needed to best solve problems, reveal opportunities and make better decisions. This is why we evolve capabilities to formulate and solve a wide range of problems through multiple integrated languages and interfaces. Extending that, we have provided integration with other languages so that users can draw on the disciplines and paradigms needed to best practice their craft.

Length – 20:11 | Email to a Colleague

Free viewing enabled – no charge


gold sponsor.jpg
Play video of session: Gold Sponsor Presentation Predictive Analytics Accelerate Insight for Financial Services
Gold Sponsor Presentation: Predictive Analytics Accelerate Insight for Financial Services 

Finbarr Deely, Director of Business Development,ParAccel

Financial services organizations face immense hurdles in maintaining profitability and building competitive advantage. Financial services organizations must perform “what-if” scenario analysis, identify risks, and detect fraud patterns. The advanced analytic complexity required often makes such analysis slow and painful, if not impossible. This presentation outlines the analytic challenges facing these organizations and provides a clear path to providing the accelerated insight needed to perform in today’s complex business environment to reduce risk, stop fraud and increase profits. * The value of predictive analytics in Accelerating Insight * Financial Services Analytic Case Studies * Brief Overview of ParAccel Analytic Database

Length – 09:06 | Email to a Colleague

Free viewing enabled – no charge


isson1.jpg
Add to Cart
TOPIC: BUSINESS VALUE
Case Study: Monster.com
Creating Global Competitive Power with Predictive Analytics 

Jean Paul Isson, Vice President, Globab BI & Predictive Analytics, Monster Worldwide

Using Predictive analytics to gain a deeper understanding of customer behaviours, increase marketing ROI and drive growth

– Creating global competitive power with business intelligence: Making the right decisions – at the right time

– Avoiding common change management challenges in sales, marketing, customer service, and products

– Developing a BI vision – and implementing it: successful business intelligence implementation models

– Using predictive analytics as a business driver to stay on top of the competition

– Following the Monster Worldwide global BI evolution: How Monster used BI to go from good to great

Length – 51:17 | Email to a Colleague

Price: $195


abbot.jpg
Add to Cart
TOPIC: SURVEY ANALYSIS
Case Study: YMCA
Turning Member Satisfaction Surveys into an Actionable Narrative 

Dean Abbott, President, Abbott Analytics

Employees are a key constituency at the Y and previous analysis has shown that their attitudes have a direct bearing on Member Satisfaction. This session will describe a successful approach for the analysis of YMCA employee surveys. Decision trees are built and examined in depth to identify key questions in describing key employee satisfaction metrics, including several interesting groupings of employee attitudes. Our approach will be contrasted with other factor analysis and regression-based approaches to survey analysis that we used initially. The predictive models described are currently in use and resulted in both greater understanding of employee attitudes, and a revised “short-form” survey with fewer key questions identified by the decision trees as the most important predictors.

Length – 50:19 | Email to a Colleague

Price: $195


rexer.jpg
Add to Cart
TOPIC: INDUSTRY TRENDS
2010 Data Minter Survey Results: Highlights
 

Karl Rexer, Ph.D., Rexer Analytics

Do you want to know the views, actions, and opinions of the data mining community? Each year, Rexer Analytics conducts a global survey of data miners to find out. This year at PAW we unveil the results of our 4th Annual Data Miner Survey. This session will present the research highlights, such as:

– Analytic goals & key challenges

– Impact of the economy

– Regional differences

– Text mining trends

Length – 15:20 | Email to a Colleague

Price: $195


elder.jpg
Add to Cart
Multiple Case Studies: U.S. DoD, U.S. DHS, SSA
Text Mining: Lessons Learned 

John F. Elder, Chief Scientist, Elder Research, Inc.

Text Mining is the “Wild West” of data mining and predictive analytics – the potential for gain is huge, the capability claims are often tall tales, and the “land rush” for leadership is very much a race.

In solving unstructured (text) analysis challenges, we found that principles from inductive modeling – learning relationships from labeled cases – has great power to enhance text mining. Dr. Elder highlights key technical breakthroughs discovered while working on projects for leading government agencies, including: Text Mining is the “Wild West” of data mining and predictive analytics – the potential for gain is huge, the capability claims are often tall tales, and the “land rush” for leadership is very much a race.

– Prioritizing searches for the Dept. of Homeland Security

– Quick decisions for Social Security Admin. disability

– Document discovery for the Dept. of Defense

– Disease discovery for the Dept. of Homeland Security

– Risk profiling for the Dept. of Defense

Length – 48:58 | Email to a Colleague

Price: $195


target.jpg
Play video of session: Keynote: How Target Gets the Most out of Its Guest Data to Improve Marketing ROI
Keynote: How Target Gets the Most out of Its Guest Data to Improve Marketing ROI 

Andrew Pole, Senior Manager, Media and Database Marketing, Target

In this session, you’ll learn how Target leverages its own internal guest data to optimize its direct marketing – with the ultimate goal of enhancing our guests’ shopping experience and driving in-store and online performance. You will hear about what guest data is available at Target, how and where we collect it, and how it is used to improve the performance and relevance of direct marketing vehicles. Furthermore, we will discuss Target’s development and usage of guest segmentation, response modeling, and optimization as means to suppress poor performers from mailings, determine relevant product categories and services for online targeted content, and optimally assign receipt marketing offers to our guests when offer quantities are limited.

Length – 47:49 | Email to a Colleague

Free viewing enabled – no charge


analytics.jpg
Play video of session: Platinum Sponsor Presentation: Driving Analytics Into Decision Making
Platinum Sponsor Presentation: Driving Analytics Into Decision Making  

Jason Verlen, Director, SPSS Product Strategy & Management, IBM Software Group

Organizations looking to dramatically improve their business outcomes are turning to decision management, a convergence of technology and business processes that is used to streamline and predict the outcome of daily decision-making. IBM SPSS Decision Management technology provides the critical link between analytical insight and recommended actions. In this session you’ll learn how Decision Management software integrates analytics with business rules and business applications for front-line systems such as call center applications, insurance claim processing, and websites. See how you can improve every customer interaction, minimize operational risk, reduce fraud and optimize results.

Length – 17:29 | Email to a Colleague

Free viewing enabled – no charge


macy.jpg
Add to Cart
TOPIC: DATA INFRASTRUCTURE AND INTEGRATION
Case Study: Macy’s
The world is not flat (even though modeling software has to think it is) 

Paul Coleman, Director of Marketing Statistics, Macy’s Inc.

Software for statistical modeling generally use flat files, where each record represents a unique case with all its variables. In contrast most large databases are relational, where data are distributed among various normalized tables for efficient storage. Variable creation and model scoring engines are necessary to bridge data mining and storage needs. Development datasets taken from a sampled history require snapshot management. Scoring datasets are taken from the present timeframe and the entire available universe. Organizations, with significant data, must decide when to store or calculate necessary data and understand the consequences for their modeling program.

Length – 34:54 | Email to a Colleague

Price: $195


gwaltney.jpg
Add to Cart
TOPIC: CUSTOMER VALUE
Case Study: SunTrust
When One Model Will Not Solve the Problem – Using Multiple Models to Create One Solution 

Dudley Gwaltney, Group Vice President, Analytical Modeling, SunTrust Bank

In 2007, SunTrust Bank developed a series of models to identify clients likely to have large changes in deposit balances. The models include three basic binary and two linear regression models.

Based on the models, 15% of SunTrust clients were targeted as those most likely to have large balance changes. These clients accounted for 65% of the absolute balance change and 60% of the large balance change clients. The targeted clients are grouped into a portfolio and assigned to individual SunTrust Retail Branch. Since 2008, the portfolio generated a 2.6% increase in balances over control.

Using the SunTrust example, this presentation will focus on:

– Identifying situations requiring multiple models

– Determining what types of models are needed

– Combining the individual component models into one output

Length – 48:22 | Email to a Colleague

Price: $195


paychex1.jpg
Add to Cart
TOPIC: RESPONSE & CROSS-SELL
Case Study: Paychex
Staying One Step Ahead of the Competition – Development of a Predictive 401(k) Marketing and Sales Campaign 

Jason Fox, Information Systems and Portfolio Manager,Paychex

In-depth case study of Paychex, Inc. utilizing predictive modeling to turn the tides on competitive pressures within their own client base. Paychex, a leading provider of payroll and human resource solutions, will guide you through the development of a Predictive 401(k) Marketing and Sales model. Through the use of sophisticated data mining techniques and regression analysis the model derives the probability a client will add retirement services products with Paychex or with a competitor. Session will include roadblocks that could have ended development and ROI analysis. Speaker: Frank Fiorille, Director of Enterprise Risk Management, Paychex Speaker: Jason Fox, Risk Management Analyst, Paychex

Length – 26:29 | Email to a Colleague

Price: $195


ling.jpg
Add to Cart
TOPIC: SEGMENTATION
Practitioner: Canadian Imperial Bank of Commerce
Segmentation Do’s and Don’ts 

Daymond Ling, Senior Director, Modelling & Analytics,Canadian Imperial Bank of Commerce

The concept of Segmentation is well accepted in business and has withstood the test of time. Even with the advent of new artificial intelligence and machine learning methods, this old war horse still has its place and is alive and well. Like all analytical methods, when used correctly it can lead to enhanced market positioning and competitive advantage, while improper application can have severe negative consequences.

This session will explore what are the elements of success, and what are the worse practices that lead to failure. The relationship between segmentation and predictive modeling will also be discussed to clarify when it is appropriate to use one versus the other, and how to use them together synergistically.

Length – 45:57 | Email to a Colleague

Price: $195


kobelius1.jpg
Add to Cart
TOPIC: SOCIAL DATA
Thought Leadership
Social Network Analysis: Killer Application for Cloud Analytics
 

James Kobielus, Senior Analyst, Forrester Research

Social networks such as Twitter and Facebook are a potential goldmine of insights on what is truly going through customers´minds. Every company wants to know whether, how, how often, and by whom they´re being mentioned across the billowing new cloud of social media. Just as important, every company wants to influence those discussions in their favor, target new business, and harvest maximum revenue potential. In this session, Forrester analyst James Kobielus identifies fruitful applications of social network analysis in customer service, sales, marketing, and brand management. He presents a roadmap for enterprises to leverage their inline analytics initiatives and leverage high-performance data warehousing (DW) clouds and appliances in order to analyze shifting patterns of customer sentiment, influence, and propensity. Leveraging Forrester’s ongoing research in advanced analytics and customer relationship management, Kobielus will discuss industry trends, commercial modeling tools, and emerging best practices in social network analysis, which represents a game-changing new discipline in predictive analytics.

Length – 48:16 | Email to a Colleague

Price: $195


dogan.jpg
Add to Cart
TOPIC: HEALTHCARE – INTERNATIONAL TARGETING
Case Study: Life Line Screening
Taking CRM Global Through Predictive Analytics 

Ozgur Dogan,
VP, Quantitative Solutions Group, Merkle Inc

Trish Mathe,
Director of Database Marketing, Life Line Screening

While Life Line is successfully executing a US CRM roadmap, they are also beginning this same evolution abroad. They are beginning in the UK where Merkle procured data and built a response model that is pulling responses over 30% higher than competitors. This presentation will give an overview of the US CRM roadmap, and then focus on the beginning of their strategy abroad, focusing on the data procurement they could not get anywhere else but through Merkle and the successful modeling and analytics for the UK. Speaker: Ozgur Dogan, VP, Quantitative Solutions Group, Merkle Inc Speaker: Trish Mathe, Director of Database Marketing, Life Line Screening

Length – 40:12 | Email to a Colleague

Price: $195


sambamoorthi1.jpg
Add to Cart
TOPIC: SURVEY ANALYSIS
Case Study: Forrester
Making Survey Insights Addressable and Scalable – The Case Study of Forrester’s Technographics Benchmark Survey 

Nethra Sambamoorthi, Team Leader, Consumer Dynamics & Analytics, Global Consulting, Acxiom Corporation

Marketers use surveys to create enterprise wide applicable strategic insights to: (1) develop segmentation schemes, (2) summarize consumer behaviors and attitudes for the whole US population, and (3) use multiple surveys to draw unified views about their target audience. However, these insights are not directly addressable and scalable to the whole consumer universe which is very important when applying the power of survey intelligence to the one to one consumer marketing problems marketers routinely face. Acxiom partnered with Forrester Research, creating addressable and scalable applications of Forrester’s Technographics Survey and applied it successfully to a number of industries and applications.

Length – 39:23 | Email to a Colleague

Price: $195


zasadil.jpg
Add to Cart
TOPIC: HEALTHCARE
Case Study: UPMC Health Plan
A Predictive Model for Hospital Readmissions 

Scott Zasadil, Senior Scientist, UPMC Health Plan

Hospital readmissions are a significant component of our nation’s healthcare costs. Predicting who is likely to be readmitted is a challenging problem. Using a set of 123,951 hospital discharges spanning nearly three years, we developed a model that predicts an individual’s 30-day readmission should they incur a hospital admission. The model uses an ensemble of boosted decision trees and prior medical claims and captures 64% of all 30-day readmits with a true positive rate of over 27%. Moreover, many of the ‘false’ positives are simply delayed true positives. 53% of the predicted 30-day readmissions are readmitted within 180 days.

Length – 54:18 | Email to a Colleague

Price: $195

Interesting R competition at Reddit

Image representing Reddit as depicted in Crunc...
Image via CrunchBase

Here is an interesting R competition going on at Reddit and it is to help Reddit make a recommendation engine 🙂

http://www.reddit.com/r/redditdev/comments/dtg4j/want_to_help_reddit_build_a_recommender_a_public/

by ketralnis

As promised, here is the big dump of voting information that you guys donated to research. Warning: this contains much geekery that may result in discomfort for the nerd-challenged.

I’m trying to use it to build a recommender, and I’ve got some preliminary source code. I’m looking for feedback on all of these steps, since I’m not experienced at machine learning.

Here’s what I’ve done

  • I dumped all of the raw data that we’ll need to generate the public dumps. The queries are the comments in the two .pig files and it took about 52 minutes to do the dump against production. The result of this raw dump looks like:
    $ wc -l *.dump
     13,830,070 reddit_data_link.dump
    136,650,300 reddit_linkvote.dump
         69,489 reddit_research_ids.dump
     13,831,374 reddit_thing_link.dump
    
  • I filtered the list of votes for the list of users that gave us permission to use their data. For the curious, that’s 67,059 users: 62,763 with “public votes” and 6,726 with “allow my data to be used for research”. I’d really like to see that second category significantly increased, and hopefully this project will be what does it. This filtering is done by srrecs_researchers.pig and took 83m55.335s on my laptop.
  • I converted data-dumps that were in our DB schema format to a more useable format using srrecs.pig(about 13min)
  • From that dump I mapped all of the account_ids, link_ids, and sr_ids to salted hashes (using obscure() insrrecs.py with a random seed, so even I don’t know it). This took about 13min on my laptop. The result of this, votes.dump is the file that is actually public. It is a tab-separated file consisting in:
    account_id,link_id,sr_id,dir
    

    There are 23,091,688 votes from 43,976 users over 3,436,063 links in 11,675 reddits. (Interestingly these ~44k users represent almost 17% of our total votes). The dump is 2.2gb uncompressed, 375mb in bz2.

What to do with it

The recommendations system that I’m trying right now turns those votes into a set of affinities. That is, “67% of user #223’s votes on /r/reddit.com are upvotes and 52% on programming). To make these affinities (55m45.107s on my laptop):

 cat votes.dump | ./srrecs.py "affinities_m()" | sort -S200m | ./srrecs.py "affinities_r()" > affinities.dump

Then I turn the affinities into a sparse matrix representing N-dimensional co-ordinates in the vector space of affinities (scaled to -1..1 instead of 0..1), in the format used by R’s skmeans package (less than a minute on my laptop). Imagine that this matrix looks like

          reddit.com pics       programming horseporn  bacon
          ---------- ---------- ----------- ---------  -----
ketralnis -0.5       (no votes) +0.45       (no votes) +1.0
jedberg   (no votes) -0.25      +0.95       +1.0       -1.0
raldi     +0.75      +0.75      +0.7        (no votes) +1.0
...

We build it like:

# they were already grouped by account_id, so we don't have to
# sort. changes to the previous step will probably require this
# step to have to sort the affinities first
cat affinities.dump | ./srrecs.py "write_matrix('affinities.cm', 'affinities.clabel', 'affinities.rlabel')"

I pass that through an R program srrecs.r (if you don’t have R installed, you’ll need to install that, and the packageskmeans like install.packages('skmeans')). This program plots the users in this vector space finding clusters using a sperical kmeans clustering algorithm (on my laptop, takes about 10 minutes with 15 clusters and 16 minutes with 50 clusters, during which R sits at about 220mb of RAM)

# looks for the files created by write_matrix in the current directory
R -f ./srrecs.r

The output of the program is a generated list of cluster-IDs, corresponding in order to the order of user-IDs inaffinities.clabel. The numbers themselves are meaningless, but people in the same cluster ID have been clustered together.

Here are the files

These are torrents of bzip2-compressed files. If you can’t use the torrents for some reason it’s pretty trivial to figure out from the URL how to get to the files directly on S3, but please try the torrents first since it saves us a few bucks. It’s S3 seeding the torrents anyway, so it’s unlikely that direct-downloading is going to go any faster or be any easier.

  • votes.dump.bz2 — A tab-separated list of:
    account_id, link_id, sr_id, direction
    
  • For your convenience, a tab-separated list of votes already reduced to percent-affinities affinities.dump.bz2, formatted:
    account_id, sr_id, affinity (scaled 0..1)
    
  • For your convenience, affinities-matrix.tar.bz2 contains the R CLUTO format matrix files affinities.cm,affinities.clabelaffinities.rlabel

And the code

  • srrecs.pigsrrecs_researchers.pig — what I used to generate and format the dumps (you probably won’t need this)
  • mr_tools.pysrrecs.py — what I used to salt/hash the user information and generate the R CLUTO-format matrix files (you probably won’t need this unless you want different information in the matrix)
  • srrecs.r — the R-code to generate the clusters

Here’s what you can experiment with

  • The code isn’t nearly useable yet. We need to turn the generated clusters into an actual set of recommendations per cluster, preferably ordered by predicted match. We probably need to do some additional post-processing per user, too. (If they gave us an affinity of 0% to /r/askreddit, we shouldn’t recommend it, even if we predicted that the rest of their cluster would like it.)
  • We need a test suite to gauge the accuracy of the results of different approaches. This could be done by dividing the data-set in and using 80% for training and 20% to see if the predictions made by that 80% match.
  • We need to get the whole process to less than two hours, because that’s how often I want to run the recommender. It’s okay to use two or three machines to accomplish that and a lot of the steps can be done in parallel. That said we might just have to accept running it less often. It needs to run end-to-end with no user-intervention, failing gracefully on error
  • It would be handy to be able to idenfity the cluster of just a single user on-the-fly after generating the clusters in bulk
  • The results need to be hooked into the reddit UI. If you’re willing to dive into the codebase, this one will be important as soon as the rest of the process is working and has a lot of room for creativity
  • We need to find the sweet spot for the number of clusters to use. Put another way, how many different types of redditors do you think there are? This could best be done using the aforementioned test-suite and a good-old-fashioned binary search.

Some notes:

  • I’m not attached to doing this in R (I don’t even know much R, it just has a handy prebaked skmeans implementation). In fact I’m not attached to my methods here at all, I just want a good end-result.
  • This is my weekend fun project, so it’s likely to move very slowly if we don’t pick up enough participation here
  • The final version will run against the whole dataset, not just the public one. So even though I can’t release the whole dataset for privacy reasons, I can run your code and a test-suite against it

——————————————————————————————-


I am thinking of using Rattle and using the arules package, and running it on the EC2 to get the horsepower.

How else do you think you can tackle a recommendation engine problem.


Ajay


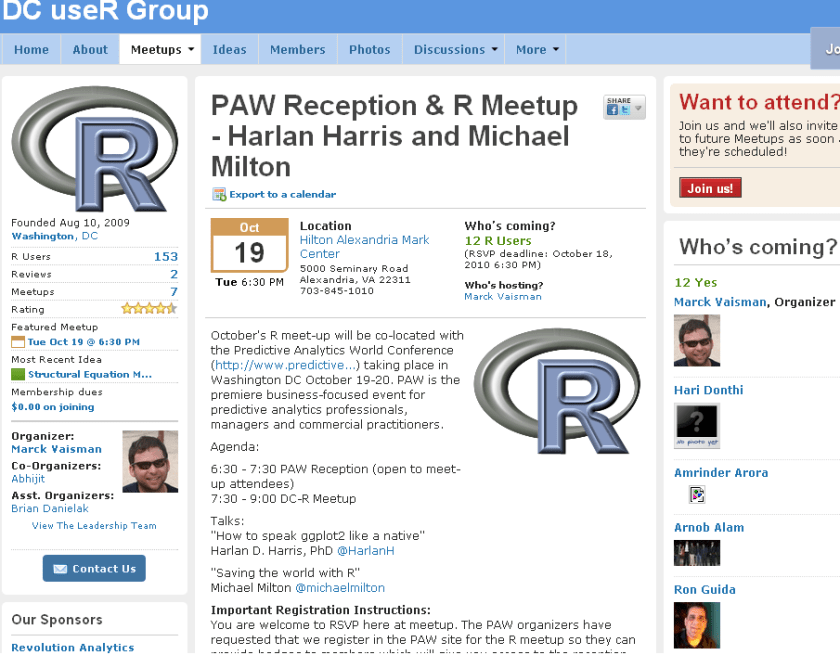
PAW Reception and R Meetup

New DC meetup for R Users-

source- http://www.meetup.com/R-users-DC/calendar/14236478/

October’s R meet-up will be co-located with the Predictive Analytics World Conference (http://www.predictive…) taking place in Washington DC October 19-20. PAW is the premiere business-focused event for predictive analytics professionals, managers and commercial practitioners.

Agenda:

6:30 – 7:30 PAW Reception (open to meet-up attendees)
7:30 – 9:00 DC-R Meetup

Talks:
“How to speak ggplot2 like a native”
Harlan D. Harris, PhD @HarlanH

“Saving the world with R”
Michael Milton @michaelmilton

Important Registration Instructions:
You are welcome to RSVP here at meetup. The PAW organizers have requested that we register in the PAW site for the R meetup so they can provide badges to members which will give you access to the reception. There is no charge to register using the PAW site. Please click here to register.


Speaker Bios

Harlan D. Harris, PhD, is a statistical data scientist working for Kaplan Test Prep and Admissions in New York City. He has degrees from the University of Wisconsin-Madison and the University of Illinois at Urbana-Champaign. Prior to turning to the private sector, he worked as a researcher and lecturer in various areas of Artificial Intelligence and Cognitive Science at the University of Illinois, Columbia University, the University of Connecticut, and New York University.

Harlan’s talk is titled “How to speak ggplot2 like a native.”. One of the most innovative ideas in data visualization in recent years is that graphical images can be described using a grammar. Just as a fluent speaker of a language can talk more precisely and clearly than someone using a tourist phrasebook, graphics based on a grammar can yield more insights than graphics based on a limited set of templates (bar chart, pie graph, etc.). There are at least two implementations of the Grammar of Graphics idea in R, of which the most popular is the ggplot2 package written by Prof. Hadley Wickham. Just as with natural languages, ggplot2 has a surface structure made up of R vocabulary elements, as well as a deep structure that mediates the link between the vocabulary and the “semantic” representation of the data shown on a computer screen. In this introductory presentation, the links among these levels of representation are demonstrated, so that new ggplot2 users can build the mental models necessary for fluent and creative visualization of their data.

Michael Milton is a Client Manager at Blue State Digital. When he’s not saving the world by designing interactive marketing strategies that connect passionate users with causes and organizations, he writes about data and analytics. For O’Reilly Media, he wrote Head First Data Analysis and Head First Excel and has created the videos Great R: Level 1 and Getting the Most Out of Google Apps for Business.

Michael’s talk is called “How to Save the World Using R.” In this wide-ranging discussion, Michael will highlight individuals and organizations who are using R to help others as well as ways in which R can be used to promote good statistical thinking.

Analytics and Journals

Some good journals for reading on analytics-

1) JSS

http://www.jstatsoft.org/

present research that demonstrates the joint evolution of computational and statistical methods and techniques.  Implementations can use languages such as C, C++, S, Fortran, Java, PHP, Python and Ruby or environments such as Mathematica, MATLAB, R, S-PLUS, SAS, Stata, and XLISP-STAT.

There are currently 370 articles, 23 code snippets, 86 book reviews, 4 software reviews, and 7 special volumes in archives

2) R Journal

http://journal.r-project.org/

The  Journal

3) Pharma Programming

http://maney.co.uk/index.php/journals/pha/

Pharmaceutical Programming is the official journal of the Pharmaceutical Users Software Exchange (PhUSE), a non-profit membership society with the objective of educating programmers and their managers working in the pharmaceutical industry. Available both in print and online, Pharmaceutical Programming is an international journal with focus on programming in the regulated environment of the pharmaceutical and life sciences industry.

4) SAS Papers – User Groups

http://www.lexjansen.com/

4569 SAS papers presented
at SGF/SUGI 1996-2010.
1343 SAS papers presented
at PharmaSUG 2000-2010.
1810 SAS papers presented
at NESUG 1997-2009.
1191 SAS papers presented
at SESUG 1999-2009.
463 SAS papers presented
at PhUSE 2005-2009.
787 SAS papers presented
at WUSS 2003-2009.
337 SAS papers presented
at MWSUG 2001, 2004-2009.
188 SAS papers presented
at PNWSUG 2004-2009.
246 SAS papers presented
at SCSUG 2003-2007, 2009.
221 SAS papers related to CDISC.
Easy access to the CDISC Forum.

5) http://analyticsmagazine.com/

Magazine by http://www.informs.org/

6) Data Mining Journals

Academic Journals

Journals relevant to Data Mining

Interview :Dr Graham Williams

(Updated with comments from Dr Graham in the comments section )


I have often talked about how the Graphical User Interface ,Rattle for R language makes learning R and building models quite simple. Rattle‘s latest version has been released and got extensive publicity including in KD Nuggets .I wrote to it’s creator Dr Graham, and he agreed for an extensive interview explaining data mining, its evolution and the philosophy and logic behind open source languages like R as well as Rattle.

Dr Graham Williams is the author of the Rattle data mining software and Adjunct Professor, University of Canberra and Australian National University.  Rattle is available from rattle.togaware.com.

Ajay Could you describe your career journey . What made you enter this field and what experiences helped shape your perspectives . What would your advice be to young professionals entering this field today.

Graham – With a PhD in Artificial Intelligence (topic: combining multiple decision trees to build ensembles) and a strong interest in practical applications, I started out in the late 1980’s developing expert systems for business and government, including bank loan assessment systems and bush fire prediction.

When data mining emerged as a discipline in the early 1990’s I was involved in setting up the first data mining team in Australia with the government research organization (CSIRO). In 2004 I joined the Australian Taxation Office and provide the technical lead for the deployment of its Analytics team, overseeing the development of a data
mining capability. I have been teaching data mining at the Australian National University (and elsewhere) since 1995 and continue to do so.

The business needs for Data Mining and Analytics continues to grow, although courses in Data Mining are still not so common. A data miner combines good backgrounds in Computer Science and Statistics. The Computer Science is too little emphasized, but is crucial for skills in developing repeatable procedures and good software engineering
practices, which I believe to be important in Data Mining.

Data Mining is more than just using a point and click graphical user interface (GUI). It is an experimental endeavor where we really need to be able to follow our nose as we explore through our data, and then capture the whole process in an automatically repeatable manner that can be readily communicated to others. A programming language offers this sophisticated level of communications.

Too often, I see analysts, when given a new dataset that updates last years data, essentially start from scratch with the data pre-processing, cleaning, and then mining, rather than beginning with last year’s captured processes and tuning to this year’s data.  The GUI generation of software often does not encourage repeatability.

Ajay -What made you get involved with R . What is the advantage of using Rattle
versus normal R.

Graham- I have used Clementine and SAS Enterprise miner over many years (and IBM’s original Intelligent Miner and Thinking Machines’ Darwin, and many other tools that emerged early on with Data Mining). Commercial vendors come and go (even large one’s like IBM, in terms of the products they support).

Lock-in is one problem with commercial tools. Another is that many vendors, understandably, won’t put resources into new algorithms until they are well accepted.
Because it is open source, R is robust, reliable, and provides access to the most advanced statistics. Many research Statisticians publish their new algorithms in R. But what is most important is that the source code is always going to be available. Not everyone has the skill to delve into that source code, but at least we have a chance to
do so. We also know that there is a team of highly qualified developers whose work is openly peer reviewed. I can monitor their coding changes, if I so wanted.  This helps ensure quality and integrity.

Rolling out R to a community of data analysts, though, does present challenges. Being primarily a language for statistics, we need to learn to speak that language. That is, we need to communicate with language rather than pictures (or GUI). It is, of course, easier to draw pictures, but pictures can be limiting. I believe a written language allows us to express and communicate ideas better and more formally. But it needs to be with the philosophy that we are communicating those ideas to our fellow humans, not just writing code to be executed by the computer.

Nonetheless, GUIs are great as memory aides, for doing simple tasks, and for learning how to perform particular tasks. Rattle aims to do the standard data mining steps, but to also expose everything that is done as R commands in the log. In fact, the log is designed to be able to be run as an R script, and to teach the user the R commands.

Ajay- What are the advantages of using Rattle  instead of SAS or SPSS. What are the disadvantages of using Rattle instead of SAS or SPSS.

Graham- Because it is free and open source, Rattle (and R) can be readily used in teaching data mining.  In business it is, initially, useful for people who want to experiment with data mining without the sometimes quite significant up front costs of the commercial offerings. For serious data mining, Rattle and R offers all of the data mining algorithms offered by the commercial vendors, but also many more. Rattle provides a simple, tab-based, user interface which is not as graphically sophisticated as Clementine in SPSS and SAS Enterprise Miner.

But with just 4 button clicks you will have built your first data mining model.

The usual disadvantage quoted for R (and so Rattle) is in the handling of large datasets – SAS and SPSS can handle datasets out of memory although they do slow down when doing so. R is memory based, so going to a 64bit platform is often necessary for the larger datasets. A very rough rule of thumb has been that the 2-3GB limit of the common 32bit processors can handle a dataset of up to about 50,000 rows with 100 columns (or 100,000 rows and 10 columns, etc), depending on the algorithms you deploy. I generally recommend, as quite a powerful yet inexpensive data mining machine, one running on an AMD64 processor, running the Debian GNU/Linux operating system, with as much memory as you can afford (e.g., 4GB to 32GB, although some machines today can go up to 128 GB, but memory gets expensive at that end of the scale).

Ajay – Rattle is free to download and use- yet it must have taken you some time
to build it.What are your revenue streams to support your time and efforts?

Graham –Yes, Rattle is free software: free for anyone to use, free to review the code, free to extend the code, free to use it for whatever purpose.  I have been developing Rattle for a few years now, with a number of
contributions from other users. Rattle, of course, gets its full power from R. The R community works together to help each other,
and others, for the benefit of all. Rattle and R can be the basic toolkit for knowledge workers providing analyses. I know of a number of data mining consultants around the world who are using Rattle to support their day-to-day consultancy work.

As a company, Togaware provides user support, installations of R and Rattle, runs training in using Rattle and in doing data mining. It also delivers data mining projects to clients. Togaware also provides support for incorporating Rattle (and R) into other products (e.g., as RStat for Information Builders).

Ajay – What is your vision of analytics for the future. How do you think the recession of 2008 and slowdown in 2009 will affect choice of softwares.

Graham- Watching the growth of data mining and analytics over the past 18 years it does seem that there has been and continues to be a monotonically increasing interest and demand for Analytics. Analytics continues to demonstrate benefit.

The global financial crisis, as others have suggested, should lead organizations to consider alternatives to expensive software. Good quality free and open source software has been available for a while now, but the typical CTO is still more comfortable purchasing expensive software. A purchase gives some sense of (false?) security but formally provides no warranty. My philosophy has been that we
should invest in our people, within an organization, and treat software as a commodity, that we openly contribute back into.

Imagine a world where we only use free open source software. The savings made by all will be substantial (consider OpenOffice versus MS/Office license fees paid by governments world wide, or Rattle versus SAS Enterprise Miner annual license fees). A small part of that saving might be expended on ensuring we have staff who are capable of understanding and extending that software to suit our needs, rather than vice versa (i.e., changing our needs to suit the software). We feed our extensions back into the grid of open source software, whilst also benefiting from contributions others are making. Some commercial vendors like to call this “communism” as part of their attempt to discredit open source, but we had better learn to share, for the good of the planet, before we lose it.

( Note from Ajay – If you are curious to try R , and have just 15 minutes to try it in, download Rattle from rattle.togaware.com. It has a click and point  interface and auto generates R code in it’s log. Trust me, it would time well spent.)